Volatility Targeting Strategy: Why Institutions Choose Risk-Adjusted Returns
How volatility-targeting strategies taught us that sometimes, less really is more
Picture this: You have $10,000 to invest. You could split it equally between three promising stocks and let it ride, or you could use the same sophisticated algorithm that trillion-dollar hedge funds and pension managers use daily. Which approach do you think would win over five years?
The answer might surprise you.
The Great Portfolio Face-Off
I recently ran a fascinating experiment comparing three different investment strategies using real market data from November 2020 to November 2025. The contestants:
Strategy 1: "The Steady Eddie" (Equal Weight)
- Split $10,000 equally between Tesla (TSLA), Nvidia (NVDA), and UnitedHealth (UNH)
- Rebalance weekly to maintain equal weights
- Simple, straightforward, no fancy algorithms
Strategy 2: "The Conservative Pro" (10% Volatility Targeting)
- Same three stocks, but with institutional-grade risk management
- Target exactly 10% annual volatility
- When markets get choppy, automatically move money to cash
- Used by pension funds and conservative institutional investors
Strategy 3: "The Balanced Pro" (15% Volatility Targeting)
- Higher risk tolerance version of the same algorithm
- Target 15% annual volatility for higher growth potential
- Popular among hedge funds and growth-oriented institutions
These volatility targeting strategies aren't just academic exercises—they manage trillions of dollars globally. Major institutions like pension funds, sovereign wealth funds, and hedge funds use them because they optimize for something called the Sharpe ratio.
What's a Sharpe Ratio and Why Should You Care?
Before we dive into results, let's talk about the Sharpe ratio—it's like a report card for investments that considers both returns AND risk. Named after Nobel Prize winner William Sharpe, it answers this question: "How much extra return do I get for each unit of risk I take?"
The formula is simple: (Return - Risk-free rate) ÷ Volatility
A Sharpe ratio of 1.0 means you get 1% extra return for every 1% of risk. Higher is better. Most professional investors consider anything above 1.0 to be good, and above 1.5 to be excellent.
The Numbers Don't Lie
After 261 weeks of real market data, here's what happened to our $10,000:
| Strategy | Final Value | Total Return | Annual Return | Max Loss | Sharpe Ratio |
|---|---|---|---|---|---|
| Equal Weight | $45489 | 354.9% | 35.6% | -43.5% | 1.08 |
| Vol Target 10% | $21369 | 113.7% | 16.1% | -17.3% | 1.17 |
| Vol Target 15% | $28734 | 187.3% | 23.1% | -25.1% | 1.15 |
Wait, what? The "dumb" equal-weight strategy made the most money, but look at those Sharpe ratios! Both volatility targeting strategies achieved better risk-adjusted returns—exactly what they were designed to do.
Before you jump to conclusions, let me show you why this story is more nuanced than it appears.
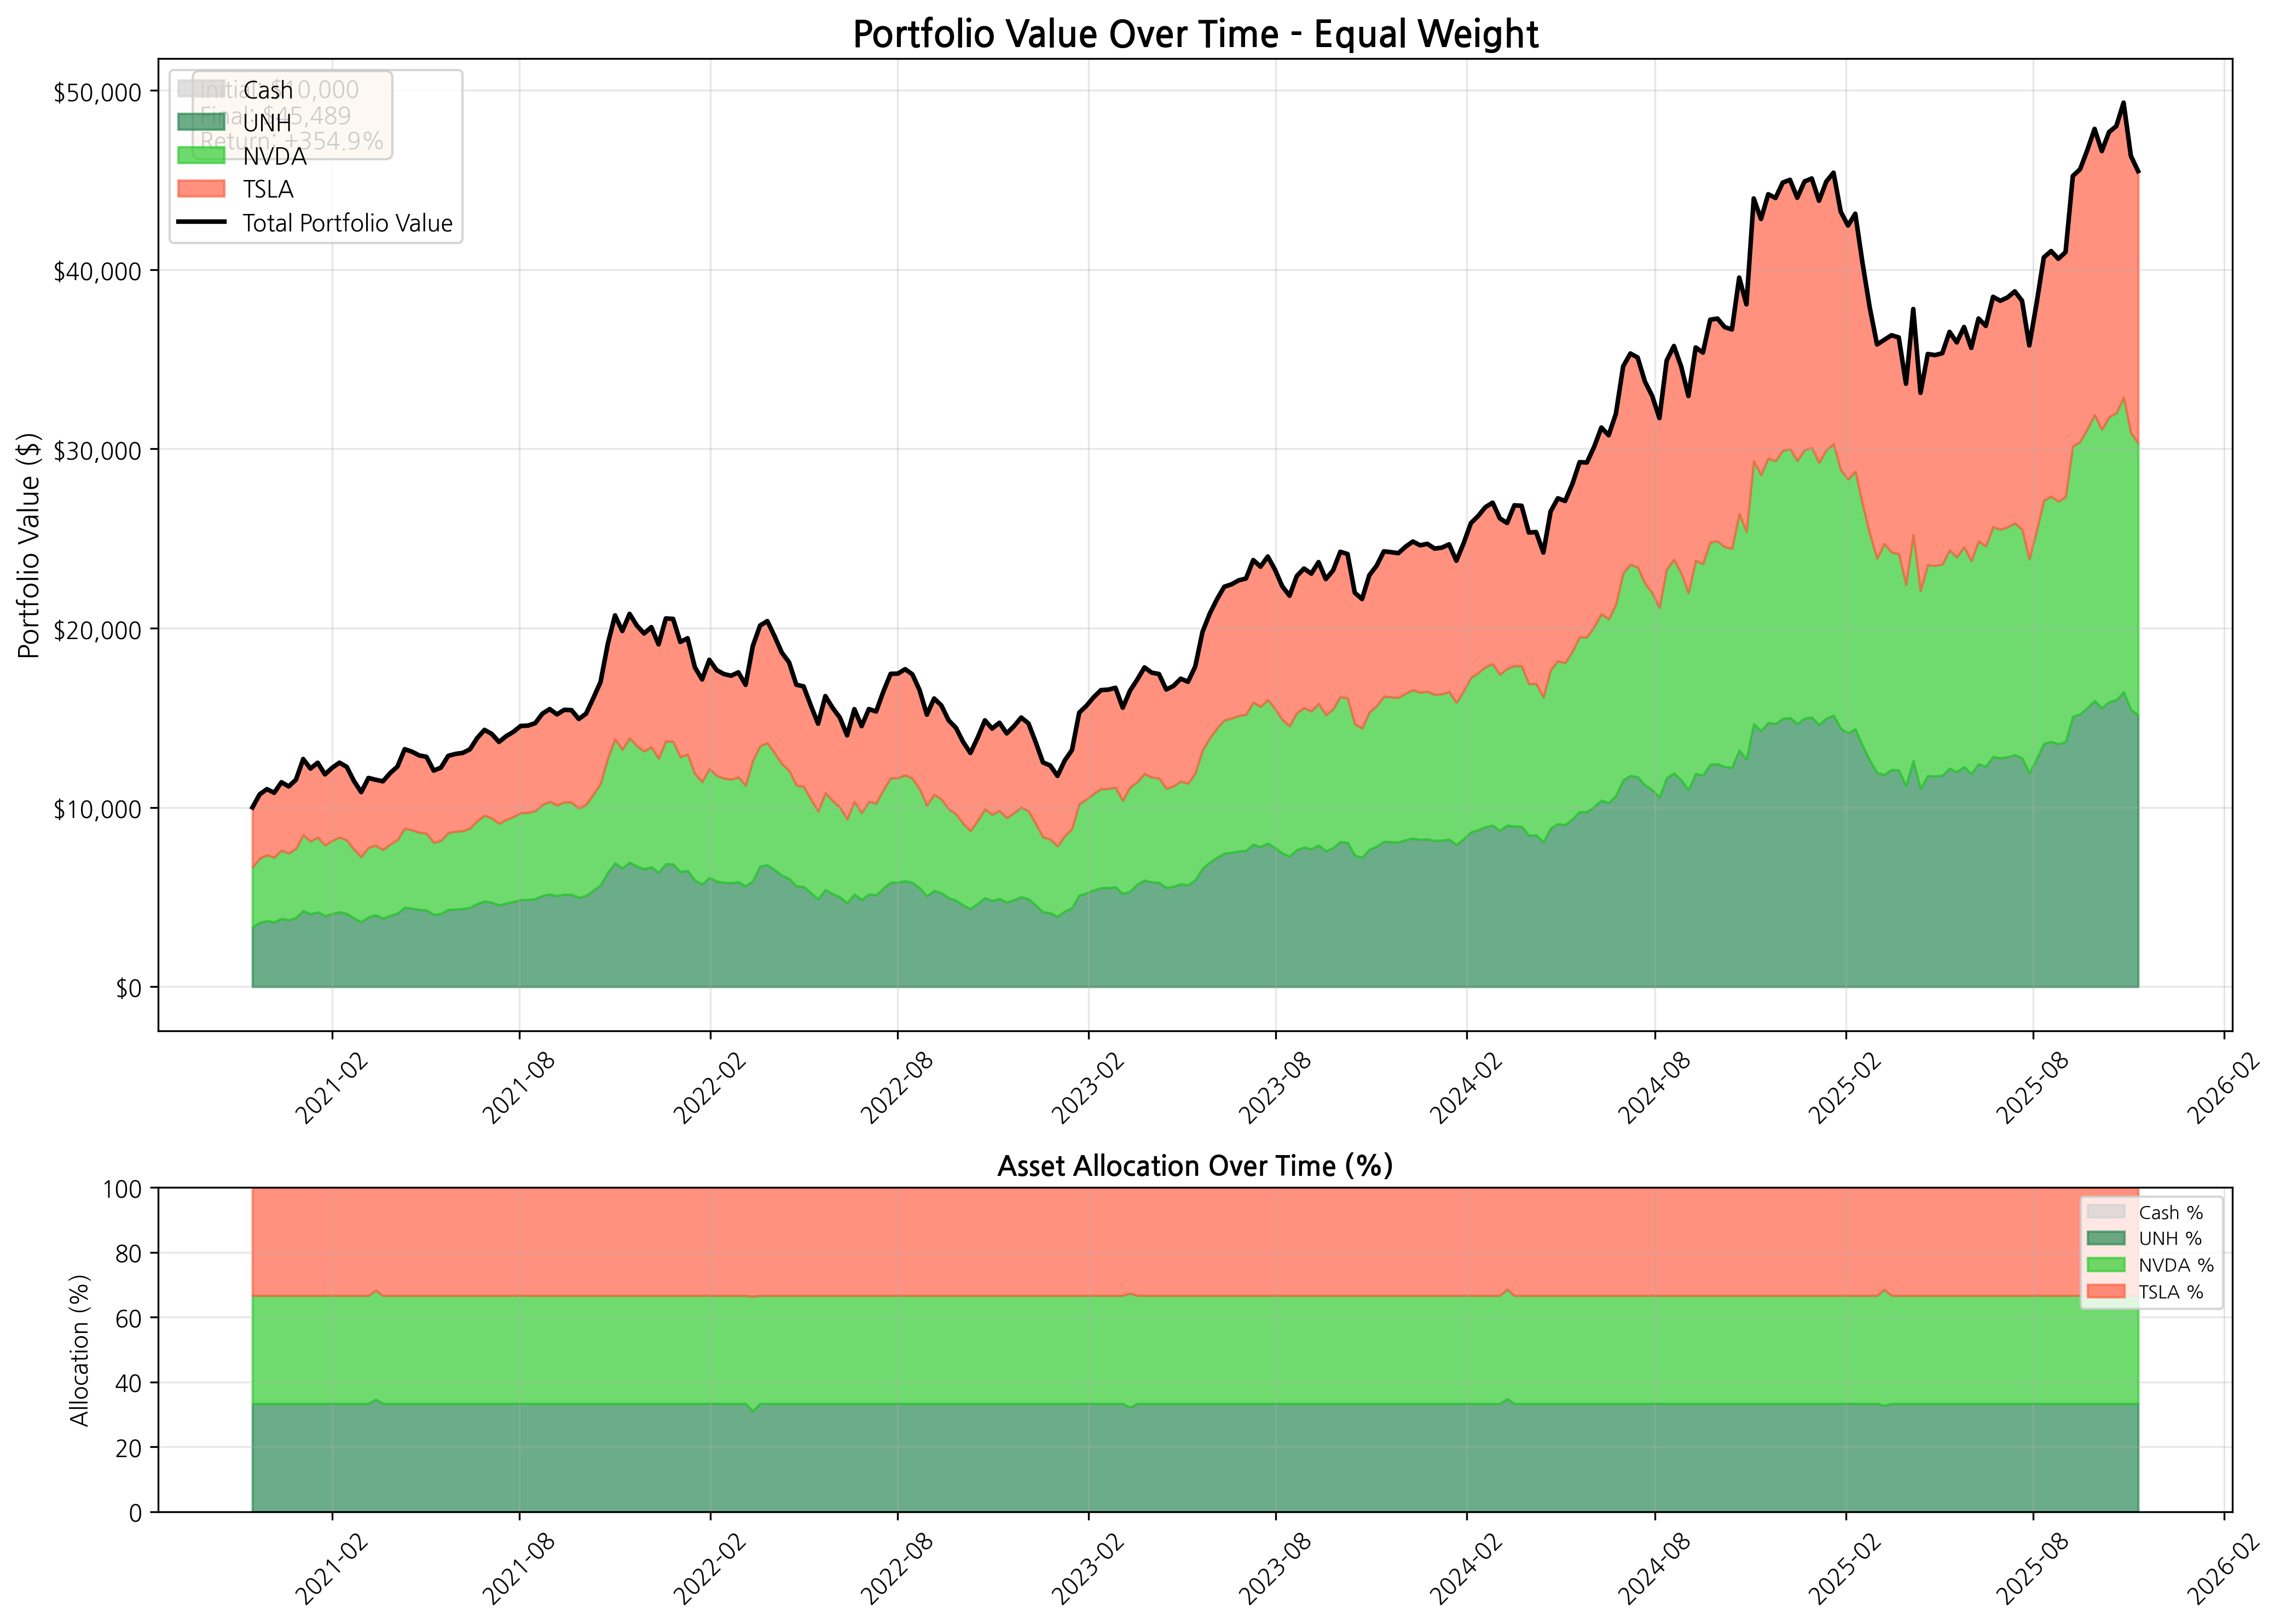 The equal weight strategy's growth trajectory - impressive, but notice those dramatic dips
 The 10% volatility targeting strategy - steadiest growth with smallest setbacks
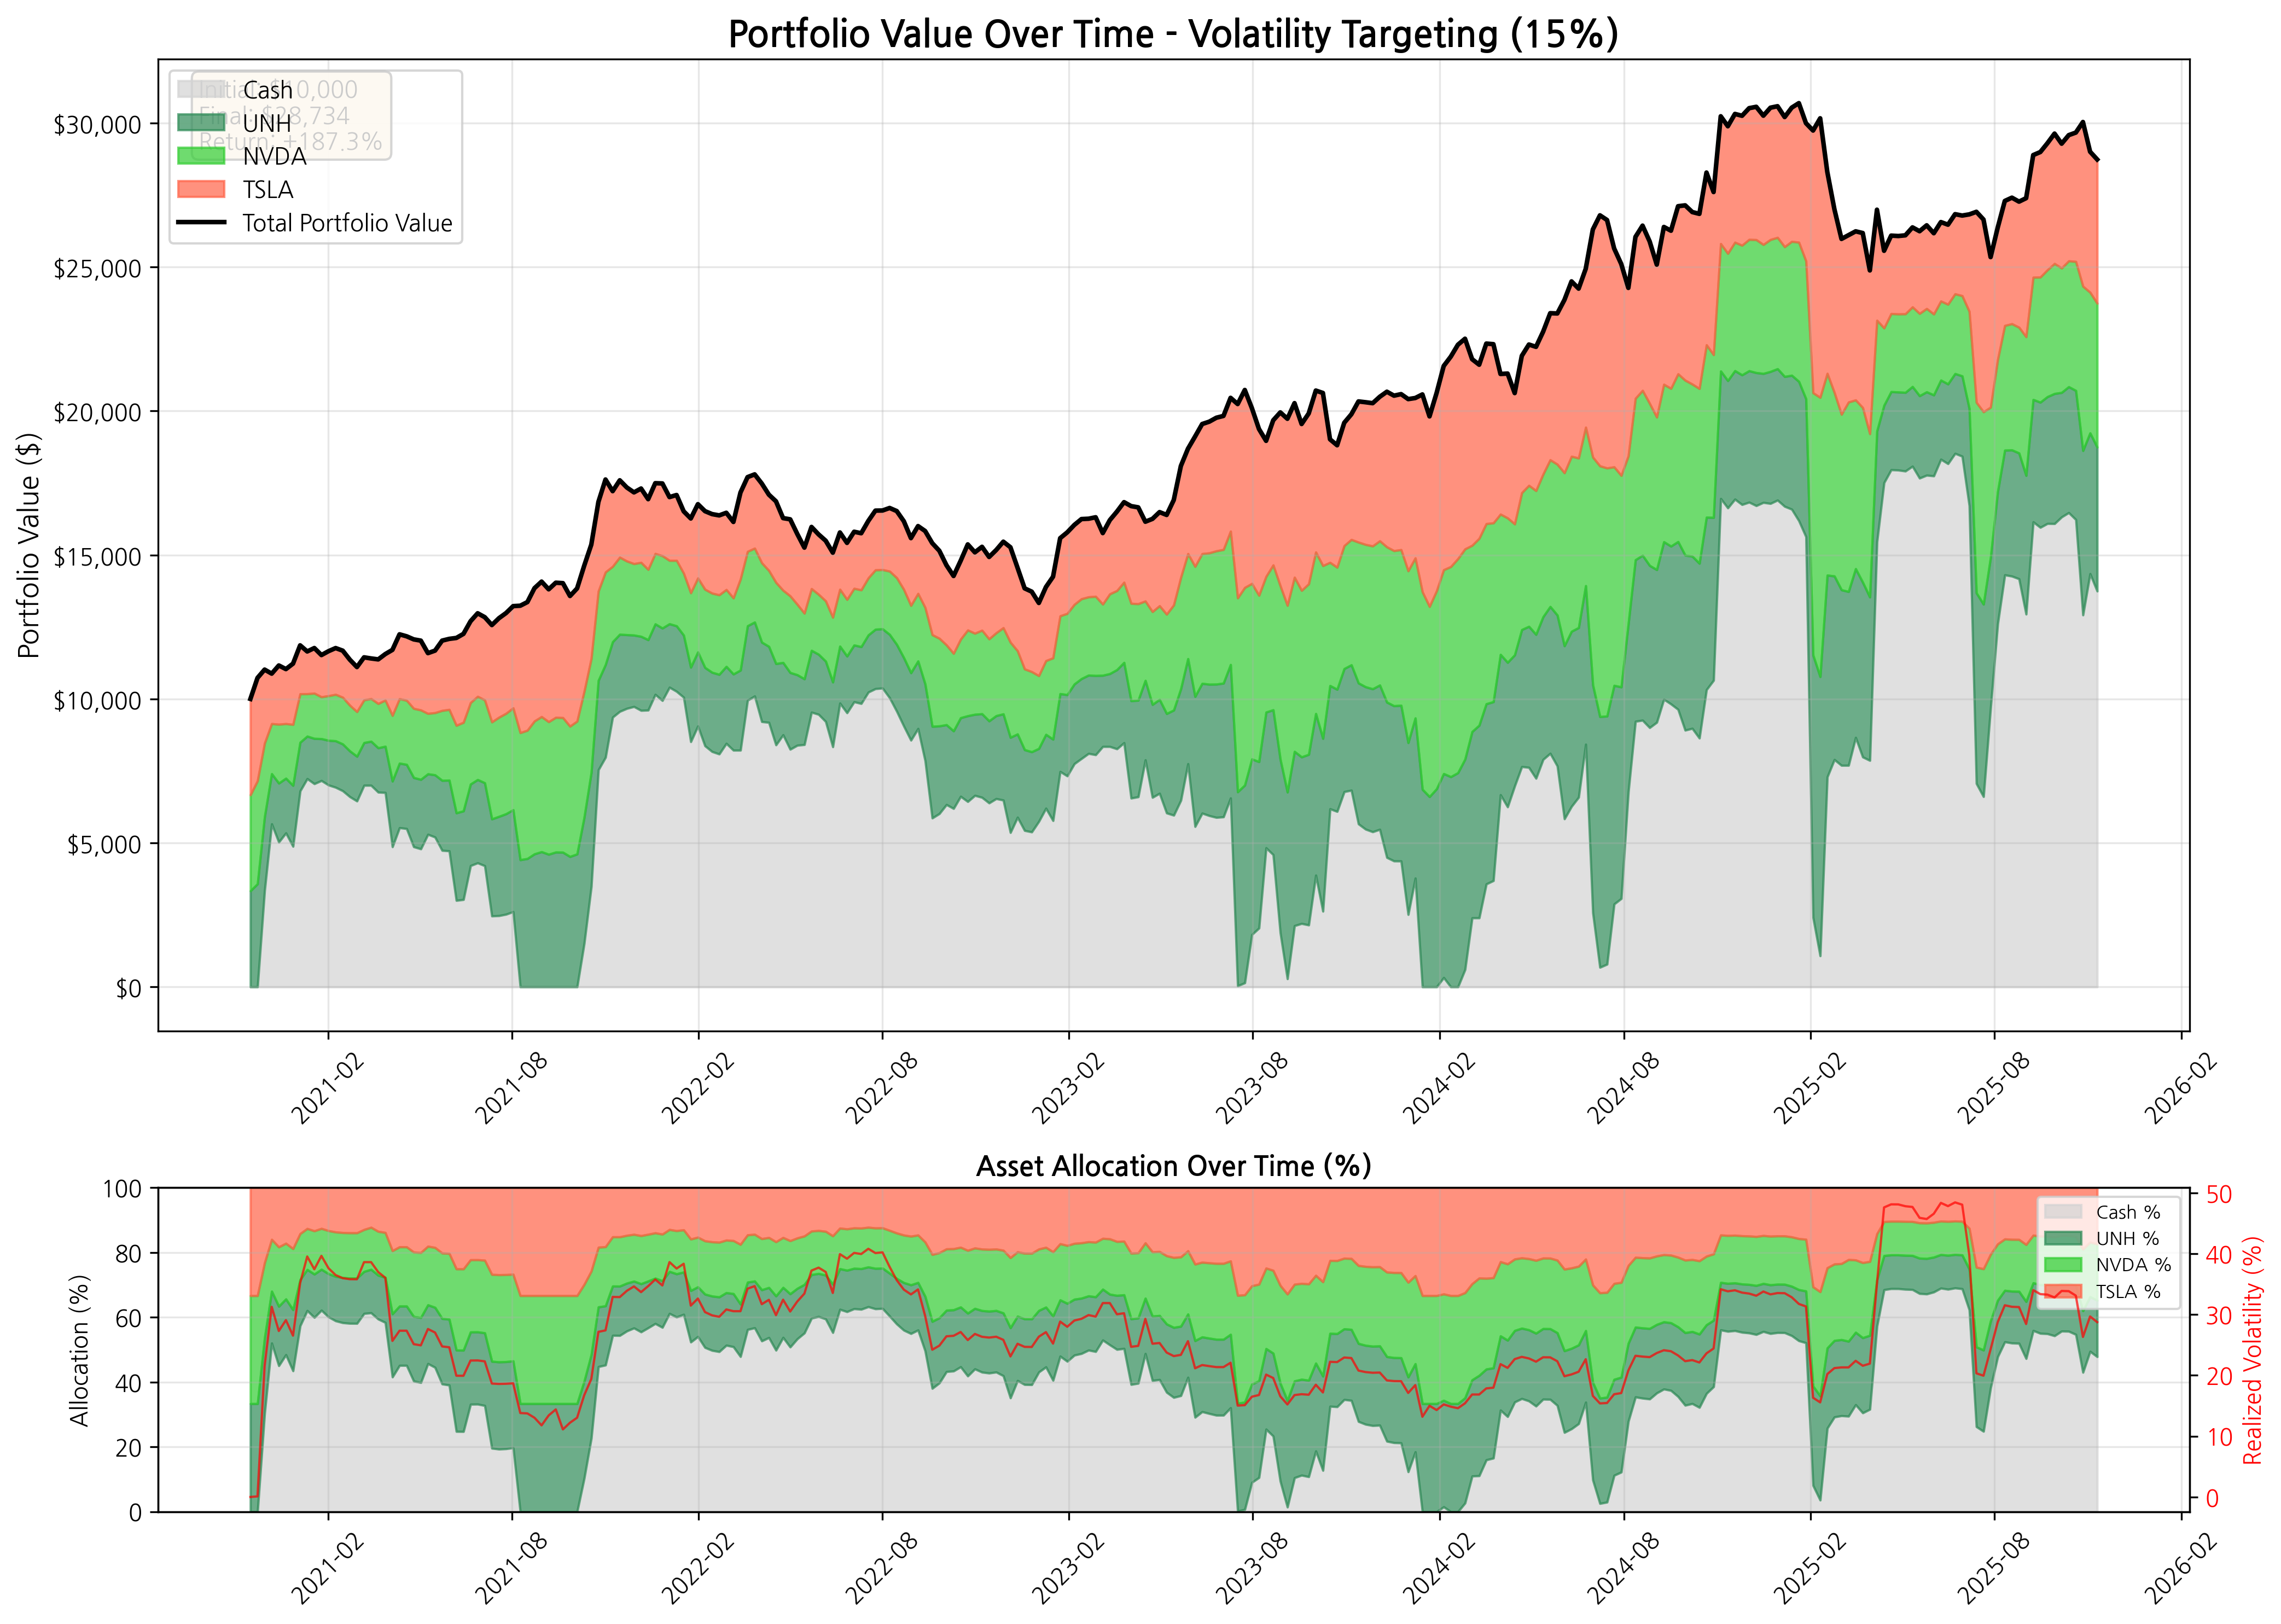 The 15% volatility targeting strategy - balanced approach between growth and stability
The Plot Twist: It's Not Just About Returns
Here's where the story gets interesting. While the equal-weight strategy did deliver higher absolute returns (354.9%), look at what happened when markets got scary:
- Equal Weight Maximum Loss: -43.5%
- 10% Vol Target Maximum Loss: -17.3%
- 15% Vol Target Maximum Loss: -25.1%
That's a huge difference! The 10% volatility targeting strategy lost only -17.3% in its worst period, while the equal-weight approach saw nearly half the portfolio value disappear at one point.
But here's the real kicker: both volatility targeting strategies had higher Sharpe ratios:
- Equal Weight: 1.08
- 10% Vol Target: 1.17
- 15% Vol Target: 1.15
This is exactly why trillion-dollar institutions use these strategies—they deliver better returns per unit of risk taken. The 15% volatility target struck an interesting middle ground, delivering 187.3% returns with a -25.1% maximum drawdown.
The Day Everything Changed: November 4, 2024
To really understand how these strategies work, let me tell you about November 4, 2024 – a day that perfectly illustrates why volatility targeting exists.
In the week leading up to November 4th, markets were getting increasingly nervous. The algorithm that powers our volatility targeting strategy was watching, calculating, and measuring market stress every single day using the previous 13 weeks of data.
Here's what happened:
Before the Storm (October 28, 2024):
- Market volatility: 24.4%
- Cash position: 59.0%
- Stock allocation: 41.0%
After the Storm (November 4, 2024):
- Market volatility: 34.2%
- Cash position: 70.7%
- Stock allocation: 29.3%
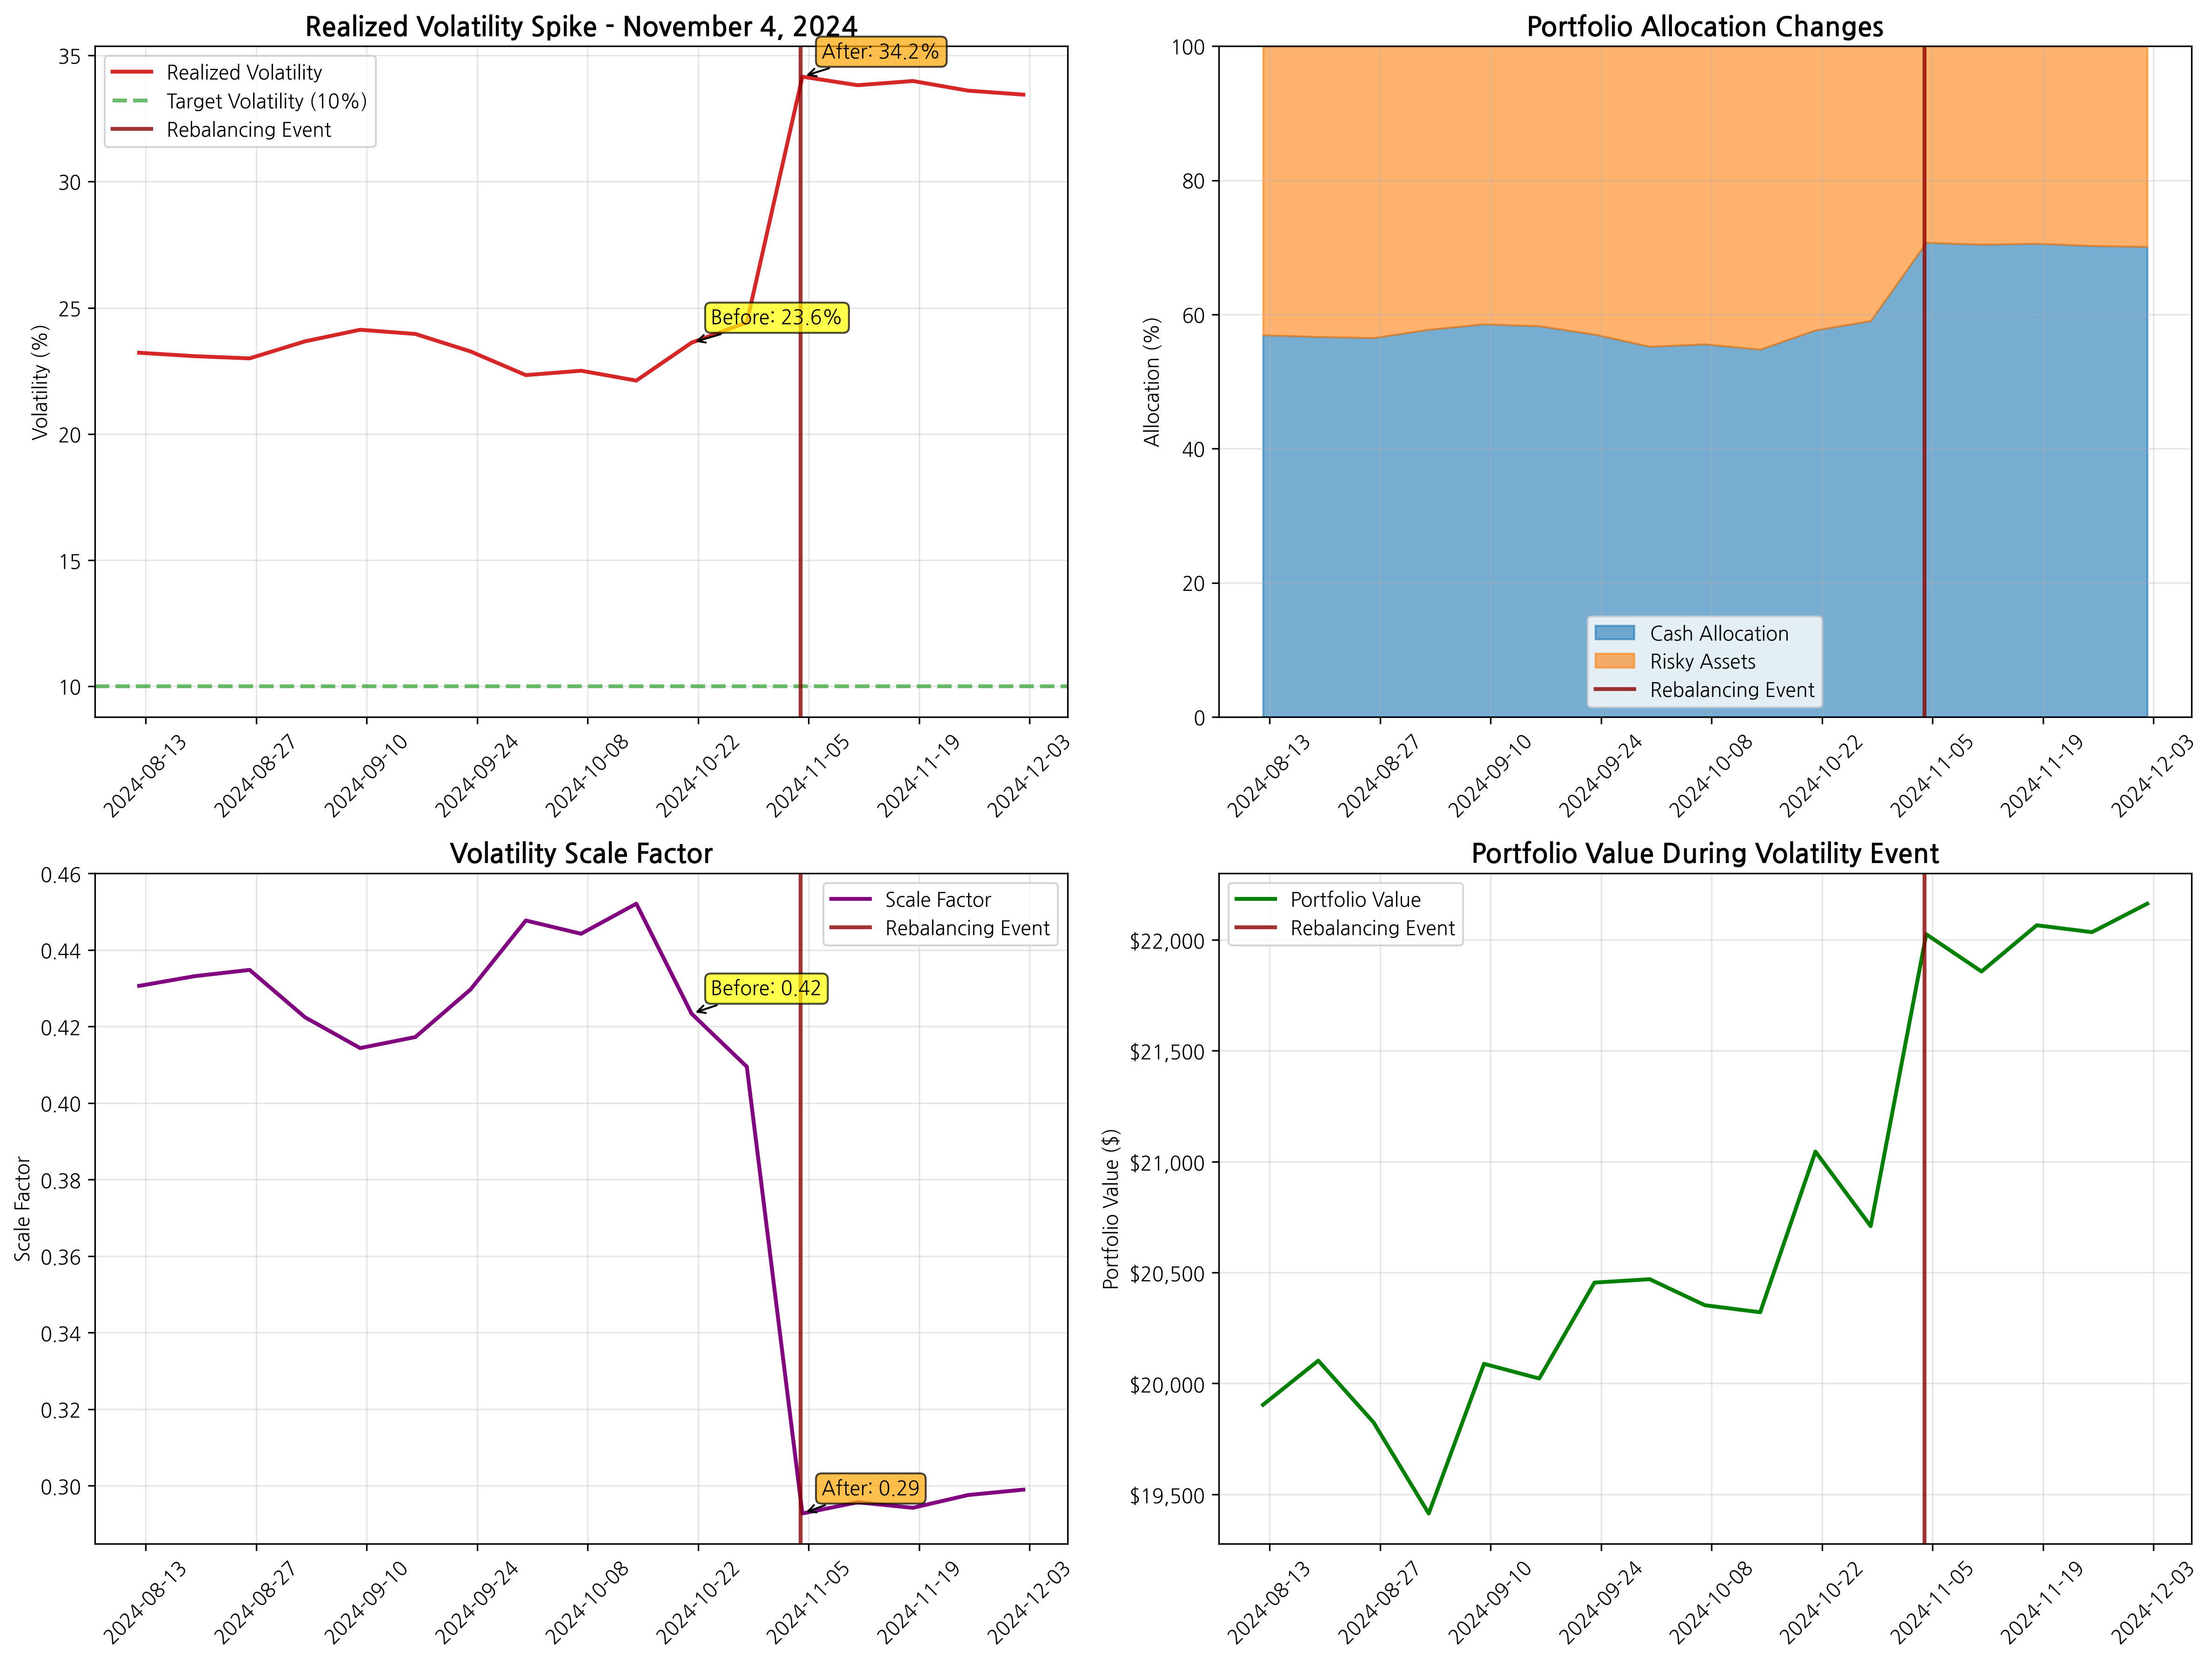 The November 4, 2024 volatility spike - notice how the algorithm automatically reduced risk exposure
In just one week, market volatility spiked by 9.7 percentage points (a 40% increase!). The equal-weight strategy? It just sat there, fully exposed to the storm.
But the volatility targeting algorithm? It was like having a smart financial advisor who automatically moved 70.7% of the portfolio to the safety of cash, reducing stock exposure from 41.0% to just 29.3%.
How Does the Rebalancing Algorithm Work?
In simple terms, this algorithm operates in three key steps: First, it calculates the portfolio's realized volatility using the previous 13 weeks of data. Second, it determines a scale factor by dividing the target volatility (10% or 15%) by the realized volatility. Third, it automatically adjusts the allocation between risky assets and cash according to this scale factor to maintain the target volatility.
Simple example: If the portfolio's realized volatility is 20% and the target is 10%, the scale factor becomes 10% ÷ 20% = 0.5. This means investing only 50% in risky assets and holding the other 50% in cash. If volatility spikes to 30%, the scale factor becomes 10% ÷ 30% = 0.33, automatically adjusting to 33% risky assets and 67% cash.
The Human Psychology Factor
This brings us to a crucial point that pure return numbers can't capture: human behavior.
Imagine you're an investor watching your portfolio drop -43.5% in the equal-weight strategy. That's terrifying! Many real investors would panic and sell at the worst possible time.
Now imagine the same scenario with volatility targeting, where your maximum loss was only -17.3%. Much easier to sleep at night, right?
Both volatility targeting strategies had 54.8% win rates – meaning 54.8% of weeks showed positive returns. This consistency matters enormously for real-world investing success.
Why Institutions Love Volatility Targeting
Here's something most individual investors don't know: volatility targeting isn't designed to maximize returns—it's designed to maximize Sharpe ratios. This is why:
- Risk budgeting: Institutions have specific risk limits they cannot exceed
- Leverage efficiency: Higher Sharpe ratios mean you can use leverage more safely
- Consistency: Pension funds need predictable performance for liability matching
- Behavioral discipline: Removes human emotions from risk management
The Norwegian Government Pension Fund (world's largest sovereign wealth fund) uses volatility targeting. So do most major pension funds. They're not trying to beat the market—they're trying to deliver consistent, risk-adjusted returns.
What This Means for Your Money
So, which strategy "won"? It depends on what you value:
Choose Equal Weight If:
- You can stomach large temporary losses (-43.5% drawdown)
- You want maximum growth potential
- You won't panic-sell during market crashes
- You're investing money you won't need for many years
Choose 10% Volatility Targeting If:
- You want the smoothest ride (only -17.3% max loss)
- You're approaching or in retirement
- You want the highest risk-adjusted returns (Sharpe: 1.17)
- You value consistency over maximum gains
Choose 15% Volatility Targeting If:
- You want a balance between growth and stability
- You can handle moderate volatility (-25.1% max loss)
- You want institutional-quality risk management
- You're building long-term wealth with some downside protection
The Bigger Picture
This experiment revealed something fascinating about modern investing: sometimes the "sophisticated" approach isn't about making more money – it's about making money more consistently and with less stress.
Look at the risk-return trade-offs:
- Equal Weight: 354.9% returns with 32.9% annual volatility (Sharpe: 1.08)
- 10% Vol Target: 113.7% returns with 13.7% volatility (Sharpe: 1.17)
- 15% Vol Target: 187.3% returns with 20.1% volatility (Sharpe: 1.15)
The sophistication of volatility targeting isn't about complexity for its own sake—it's about achieving better risk-adjusted returns. That's why it manages trillions globally.
The Takeaway
Here's what I learned from this $10,000 experiment:
- Sharpe ratio matters more than absolute returns – institutions optimize for risk-adjusted performance for good reason
- Volatility targeting delivers on its promise – it automatically reduces risk when markets get scary while maintaining target volatility
- There's a strategy for every risk appetite – 10% for conservatives, 15% for balanced investors, equal weight for growth seekers
- Institutional strategies have merit – what works for trillion-dollar funds can work for individual investors too
- Consistency beats perfection – a strategy you can stick with long-term beats a strategy that's theoretically optimal
The next time someone tells you that simple strategies always beat complex ones, show them these Sharpe ratios. Sometimes, institutional-grade sophistication goes a long way – not just in managing risk, but in creating sustainable long-term wealth.
And sometimes, that's the most valuable thing of all.
This analysis was based on weekly rebalancing data from November 2020 to November 2025 using real market prices for TSLA, NVDA, and UNH. Past performance doesn't guarantee future results, but it sure makes for interesting stories.
Want to dive deeper? The complete analysis includes 261 weeks of data, detailed risk metrics, and month-by-month breakdowns. All calculations used actual market data with realistic transaction assumptions.
What would you choose – maximum returns or maximum peace of mind? Let me know in the comments below.
Comments (0)
No comments yet. Be the first to comment!