Educational breakdowns of core investing concepts, market behavior, and data-driven investing principles.
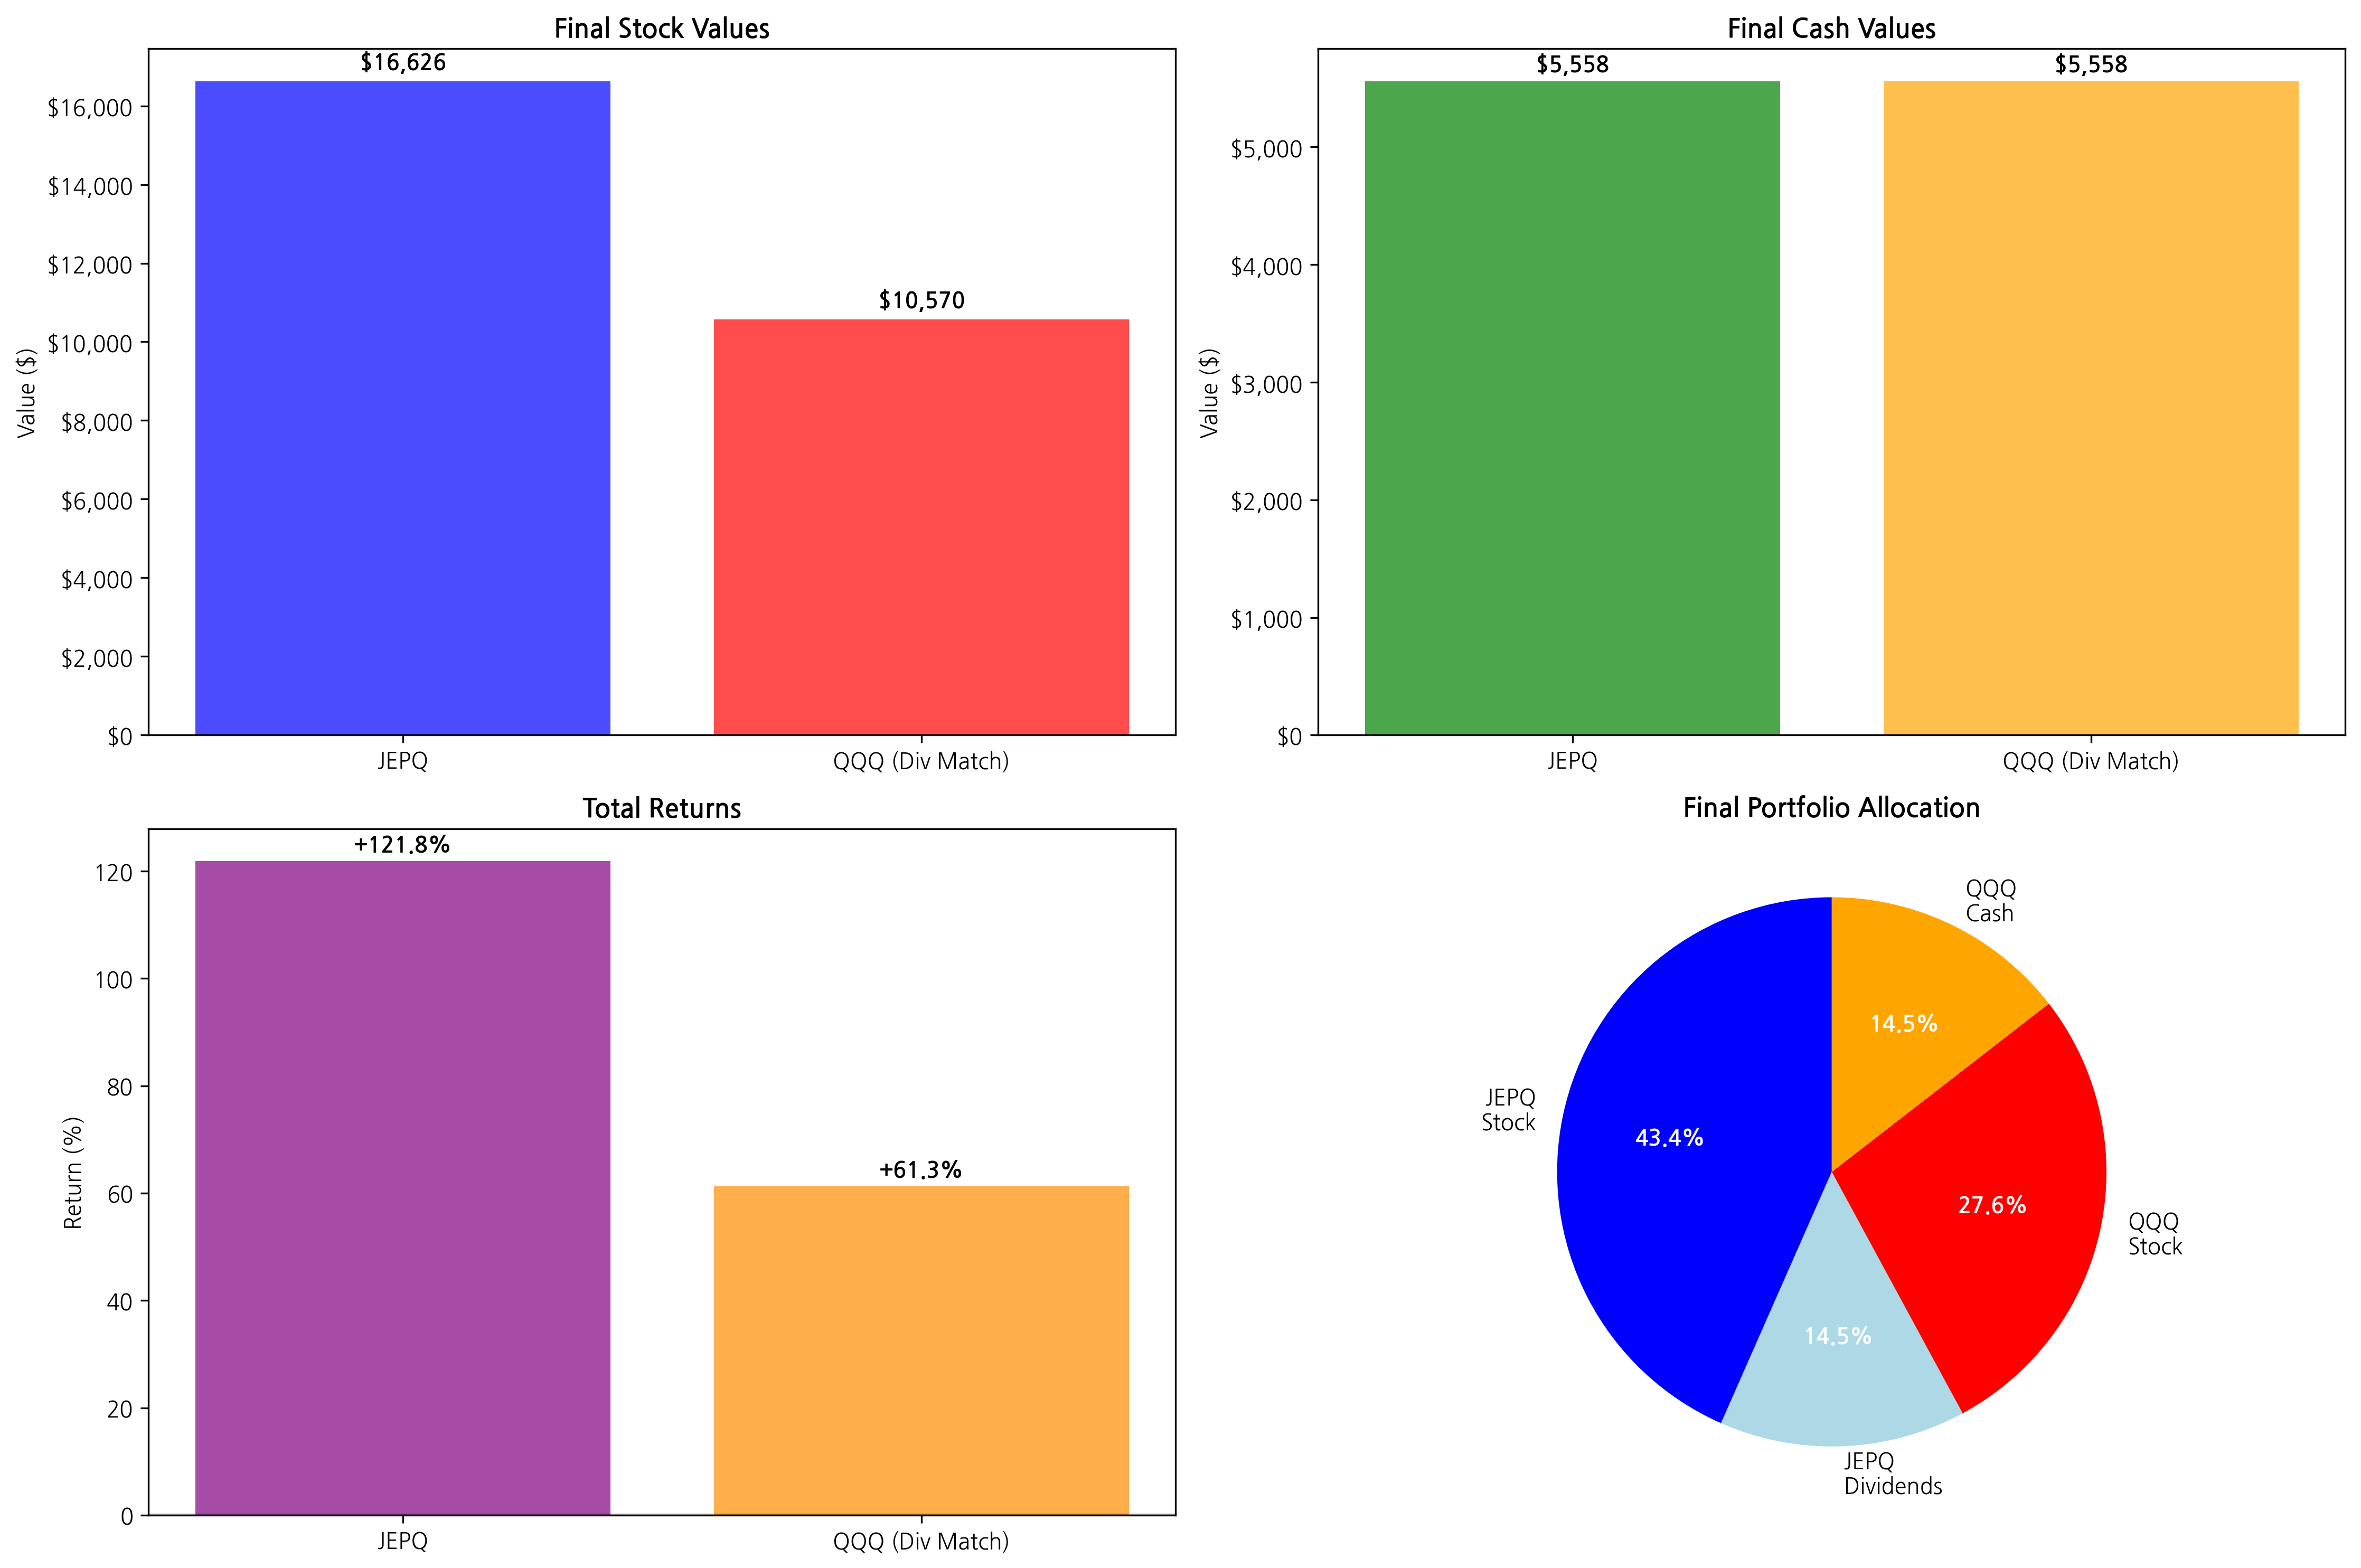
What happens when you try to turn a growth ETF into an income machine? I ran the numbers, and the results might surprise you.
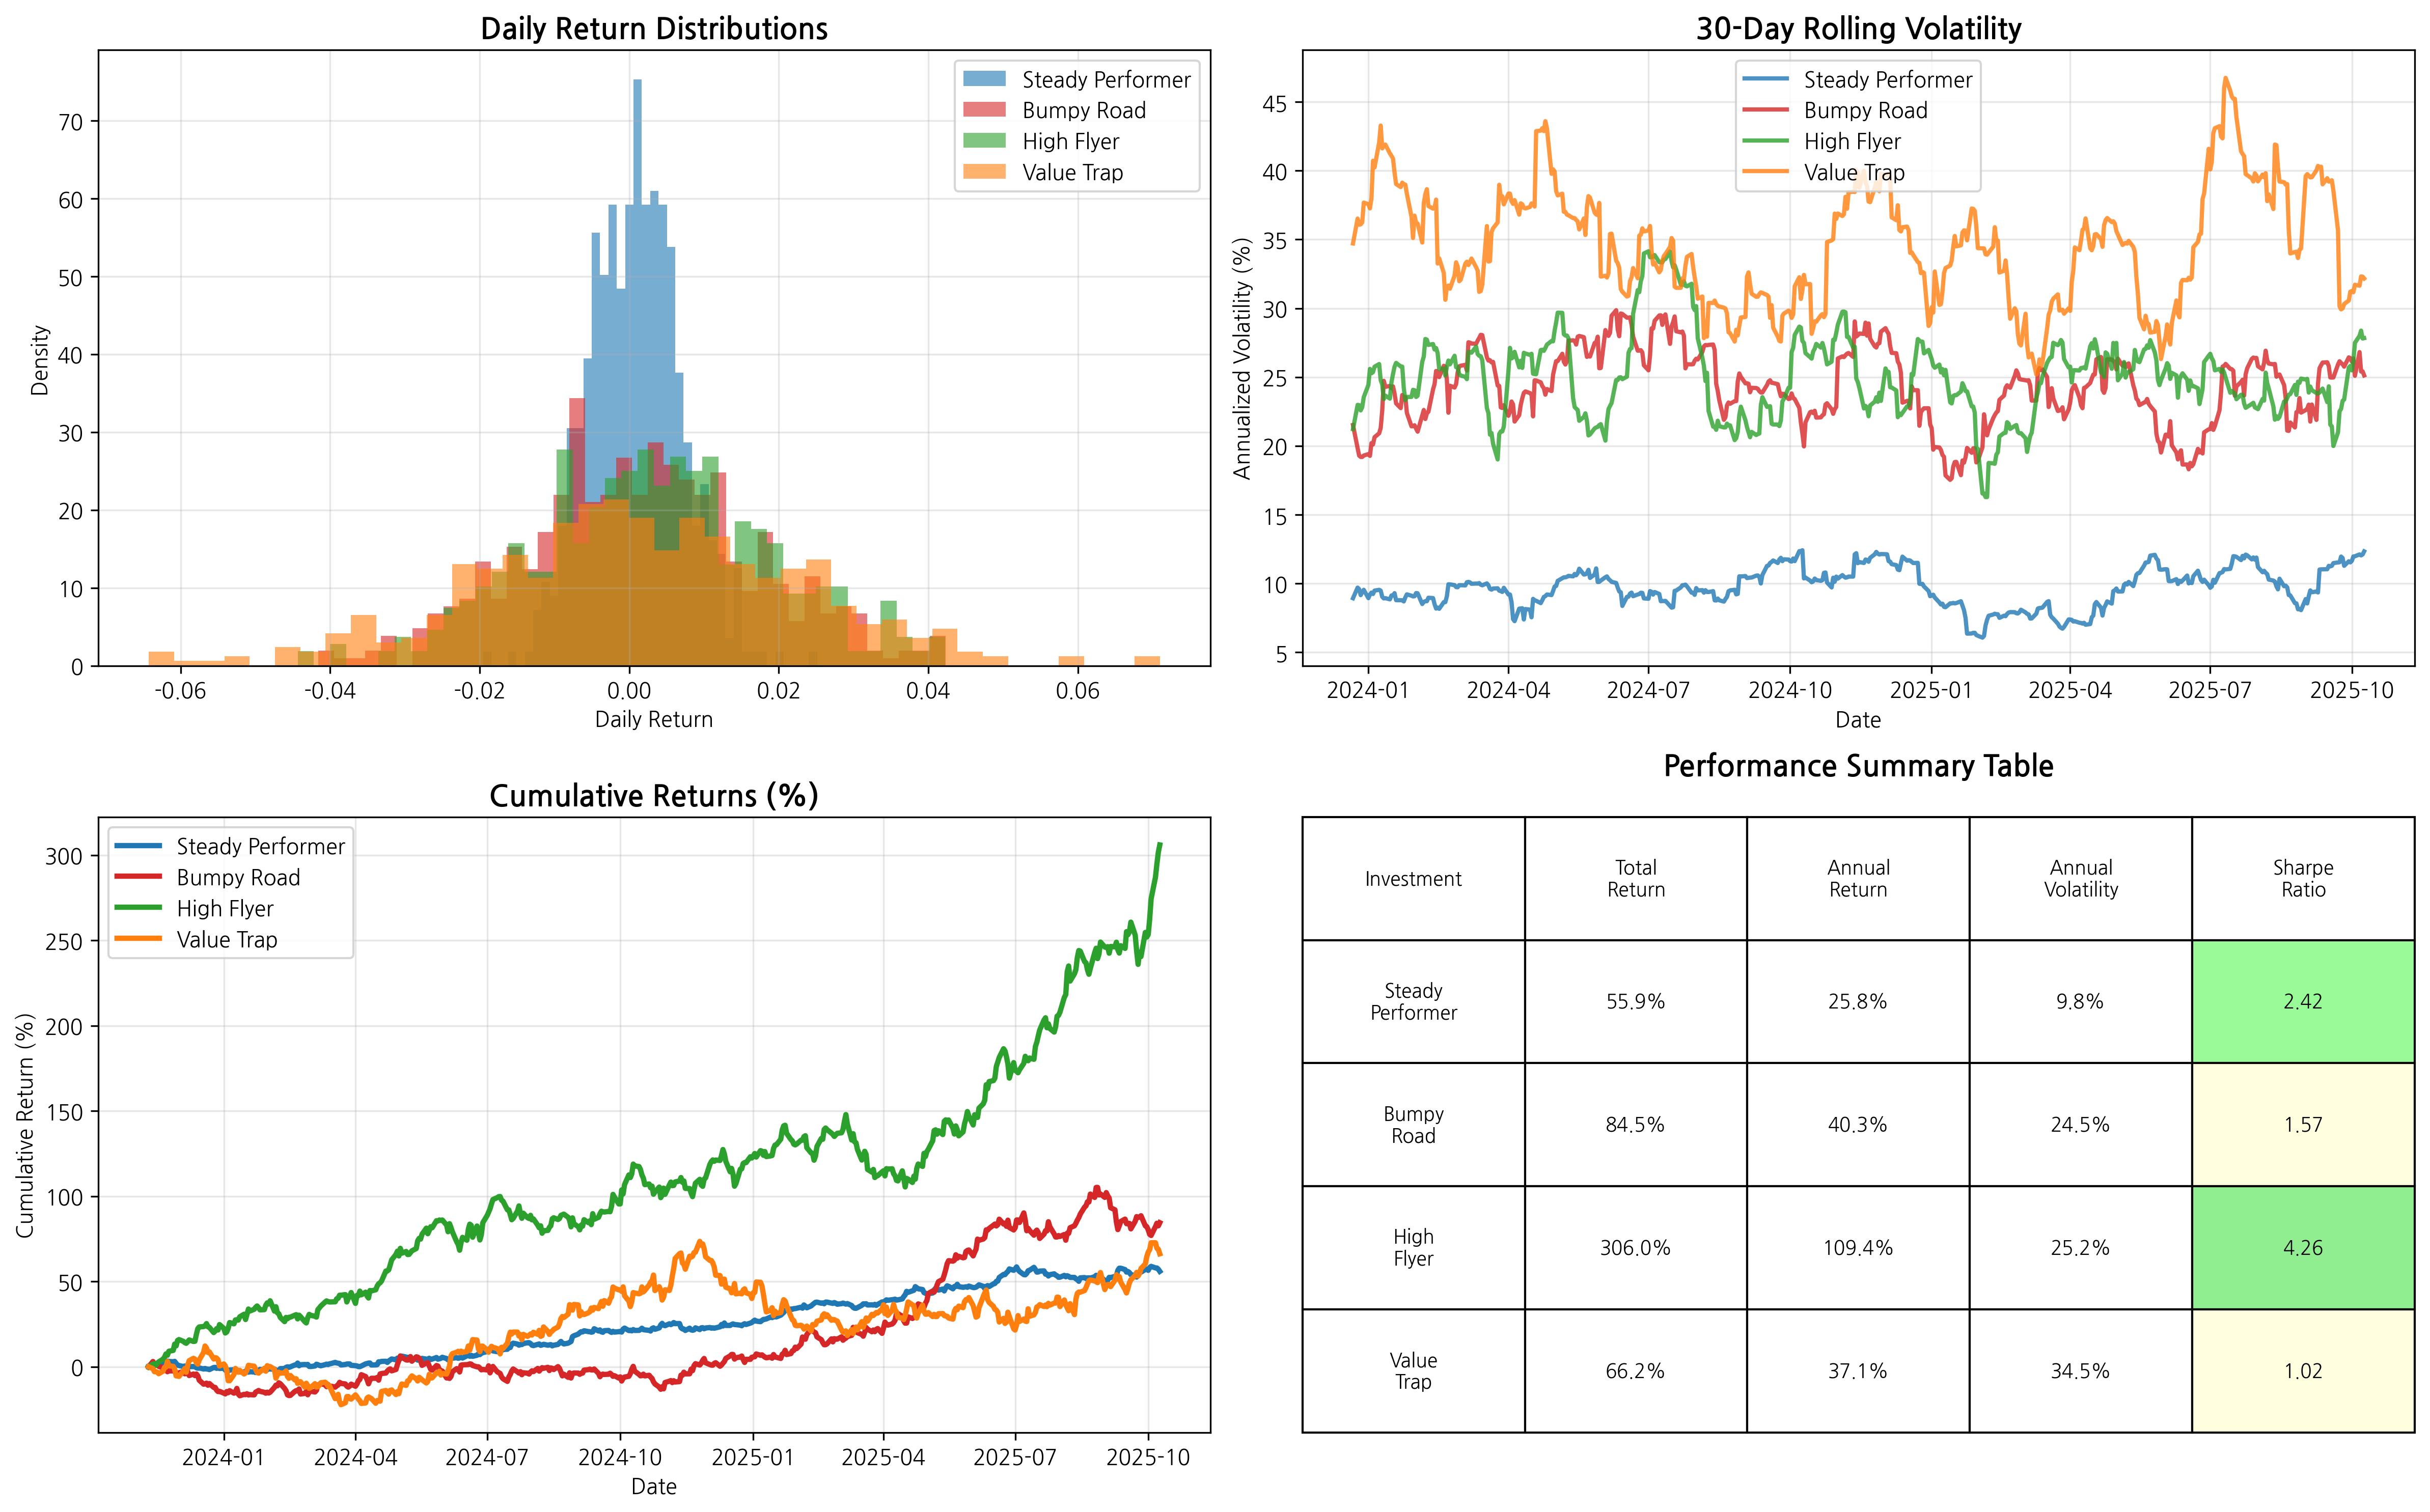
Learn how the Sharpe Ratio measures investment performance by accounting for risk. This guide covers calculation methods, interpretation, practical applications, and limitations of this essential portfolio management metric.
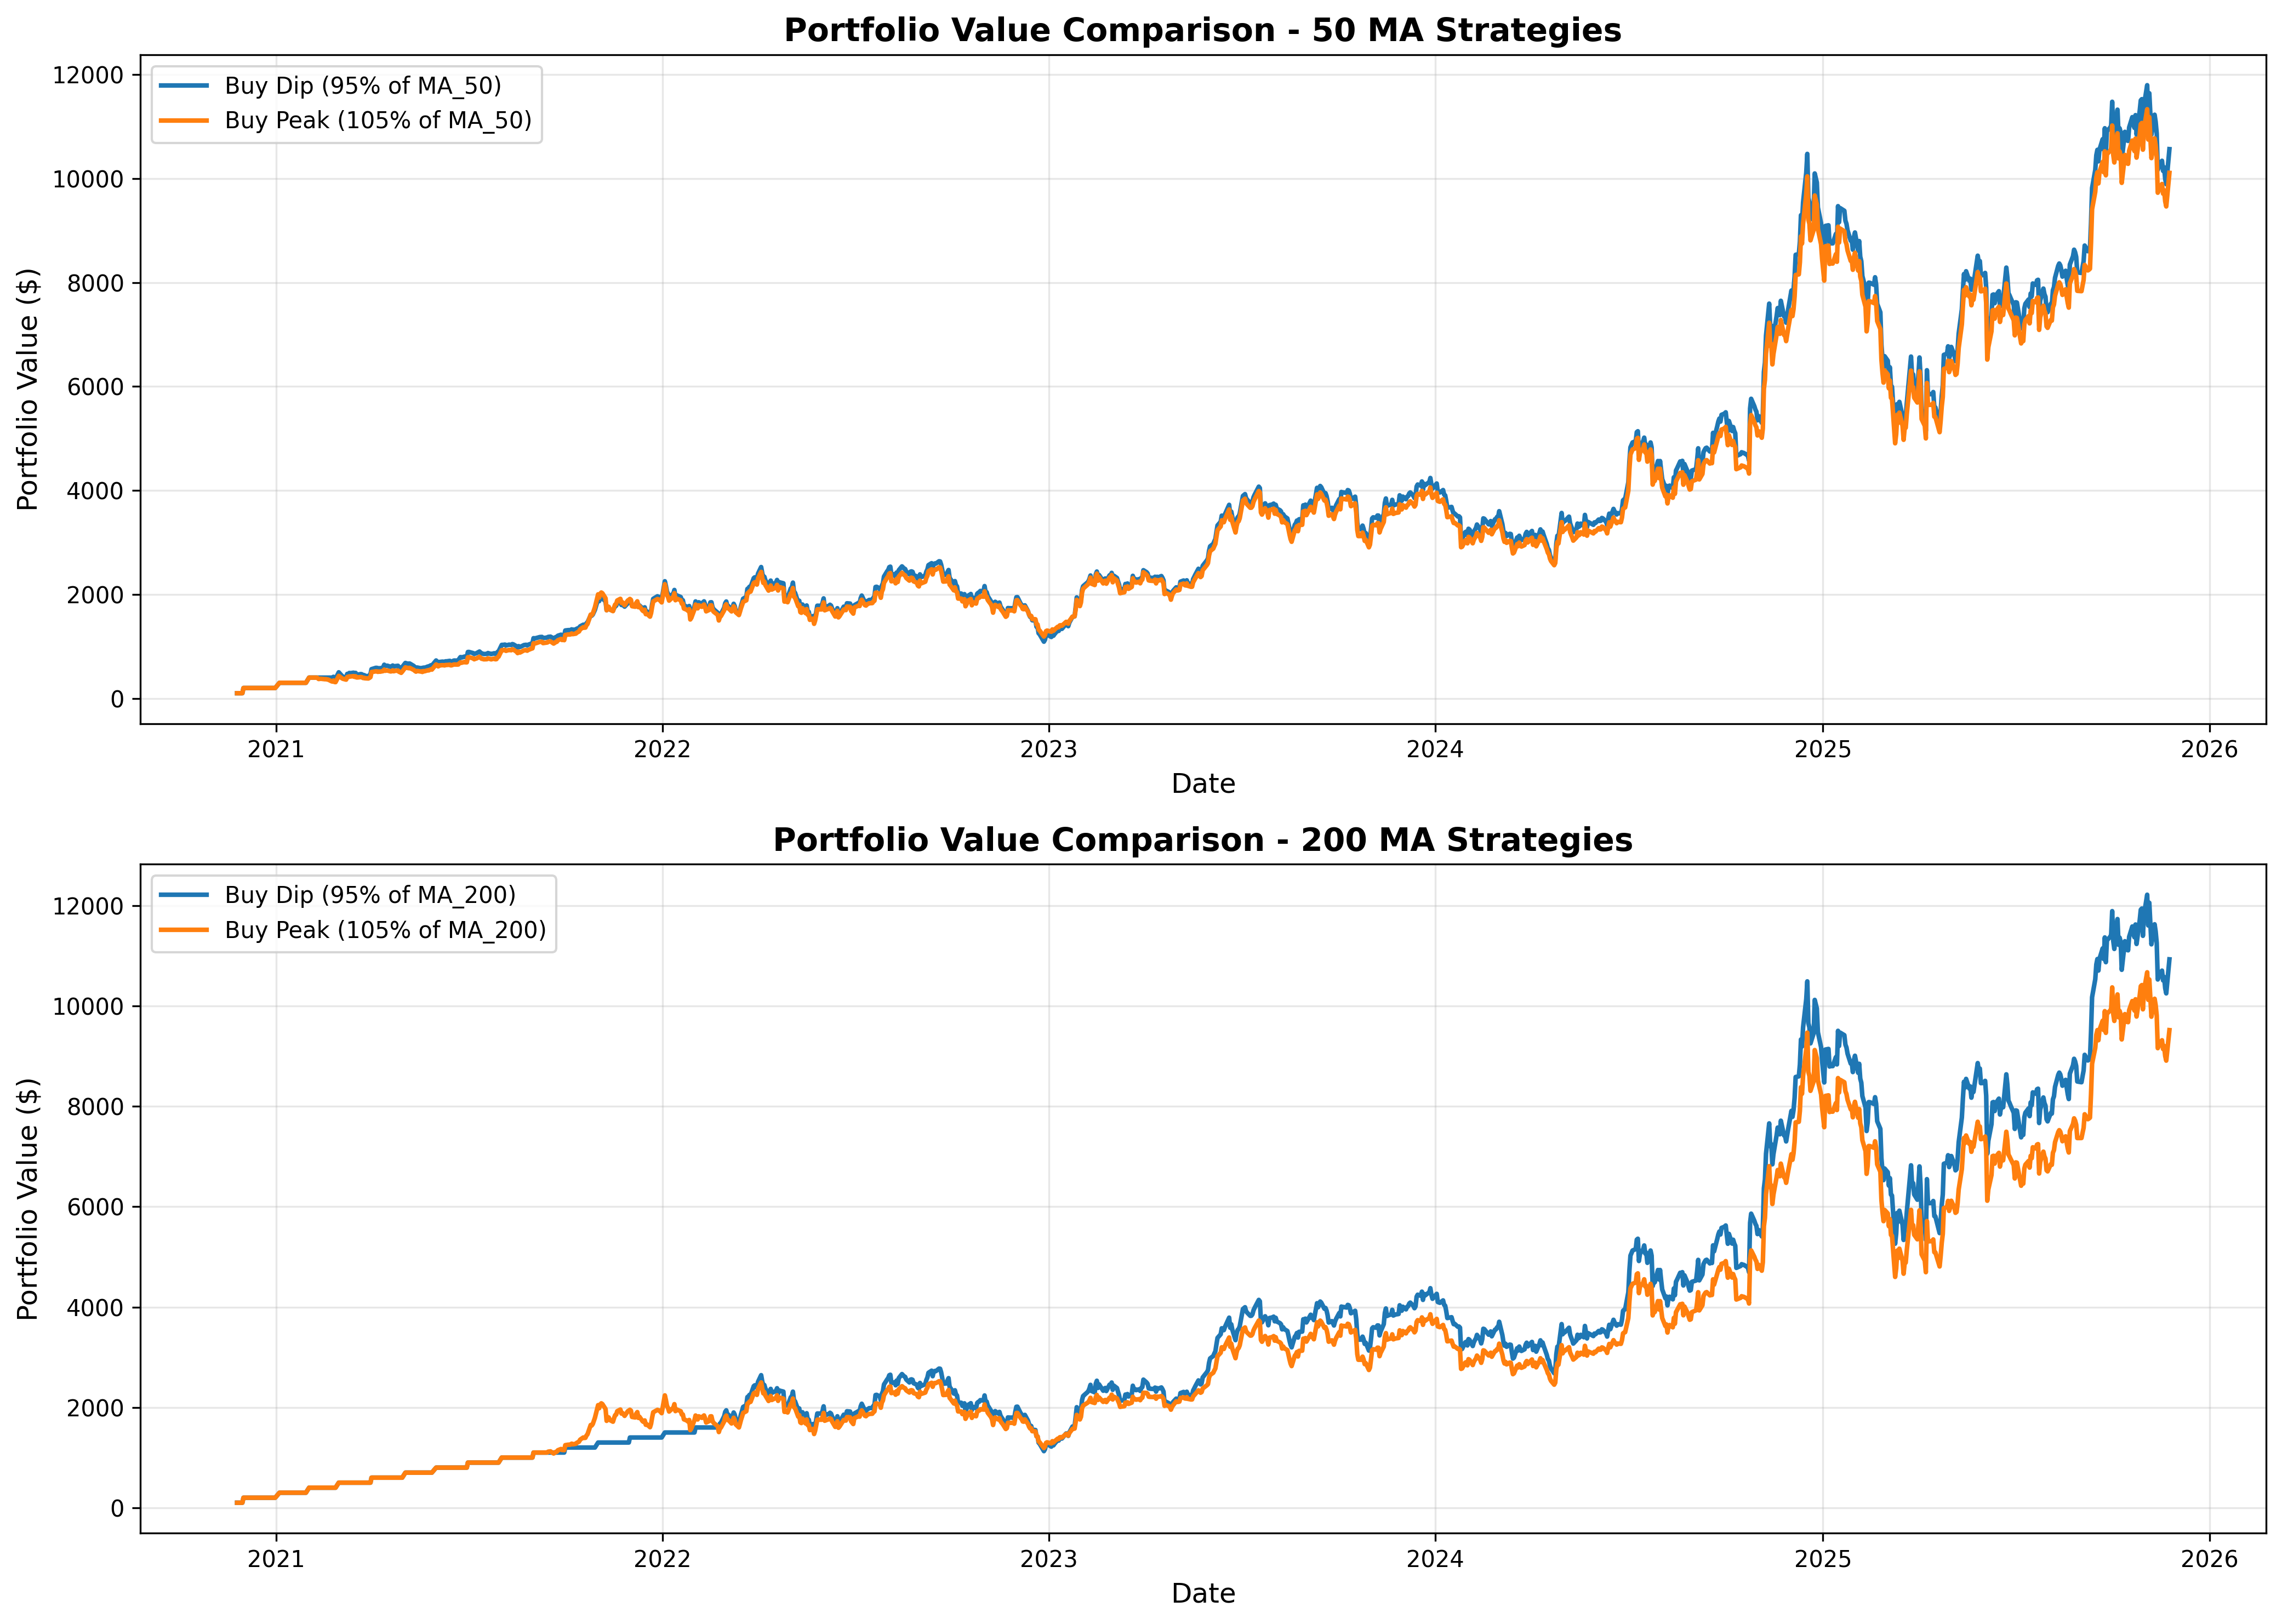
A data-driven comparison testing Buy the Dip vs Buy the Peak strategies on Tesla stock with monthly investments over 61 months, revealing surprising results about both approaches.
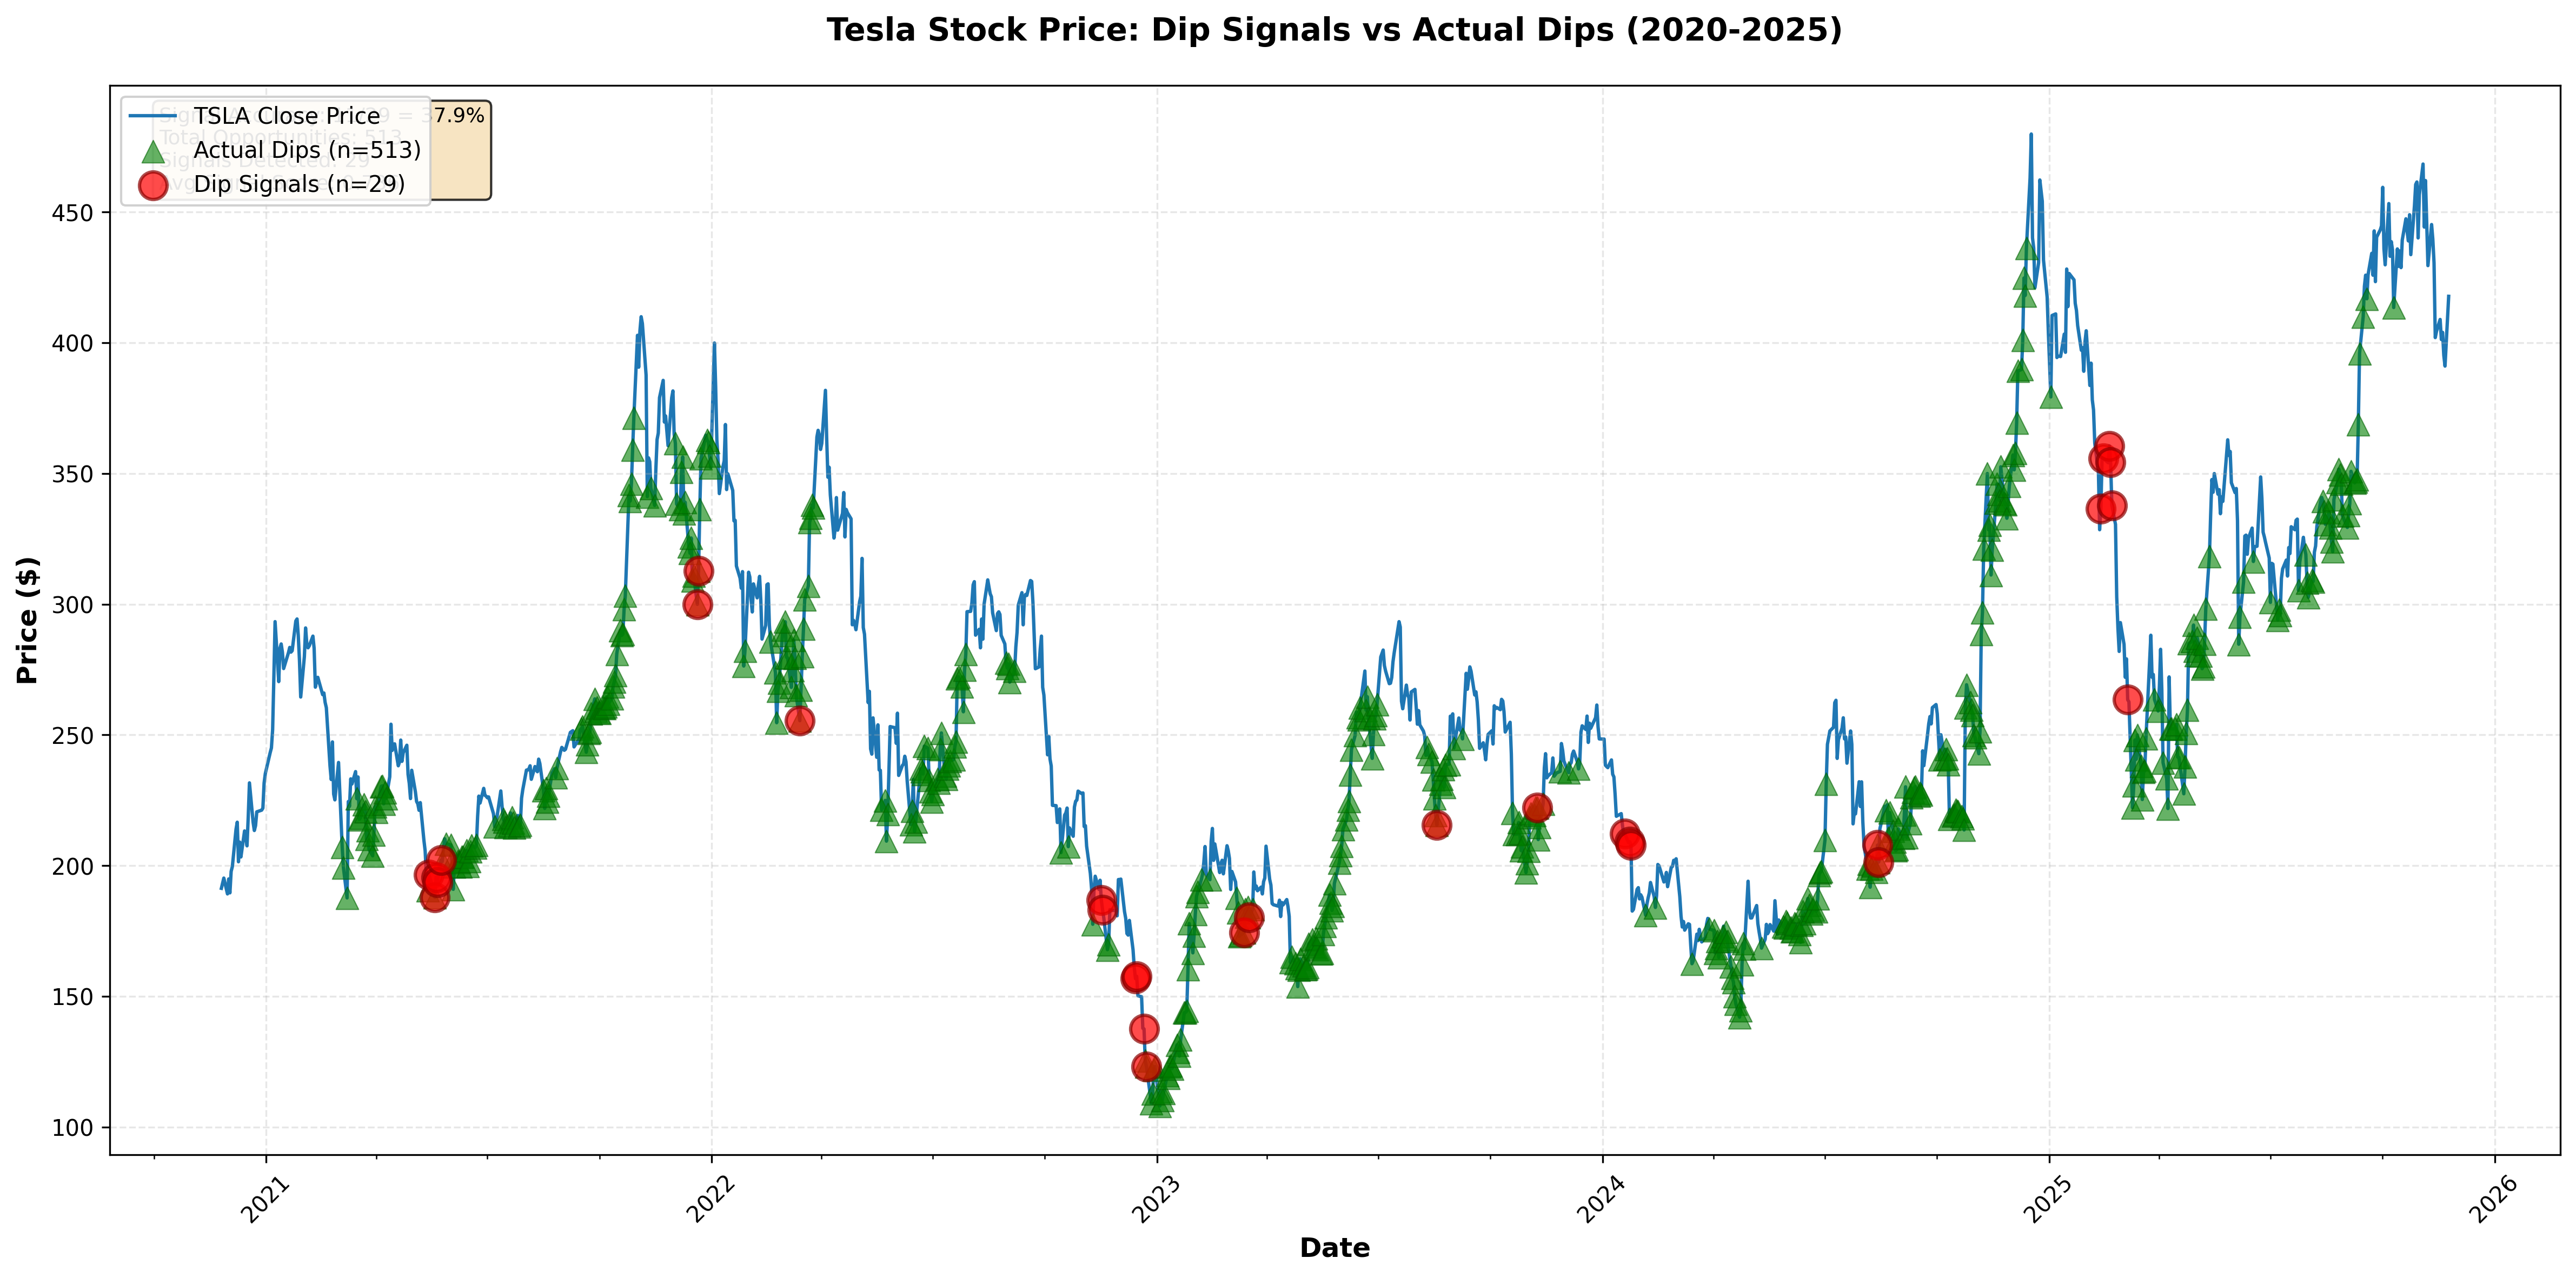
A data-driven exploration of buying opportunities in volatile markets. Testing a mean reversion strategy on 5 years of Tesla data to see if we can systematically identify profitable dips.
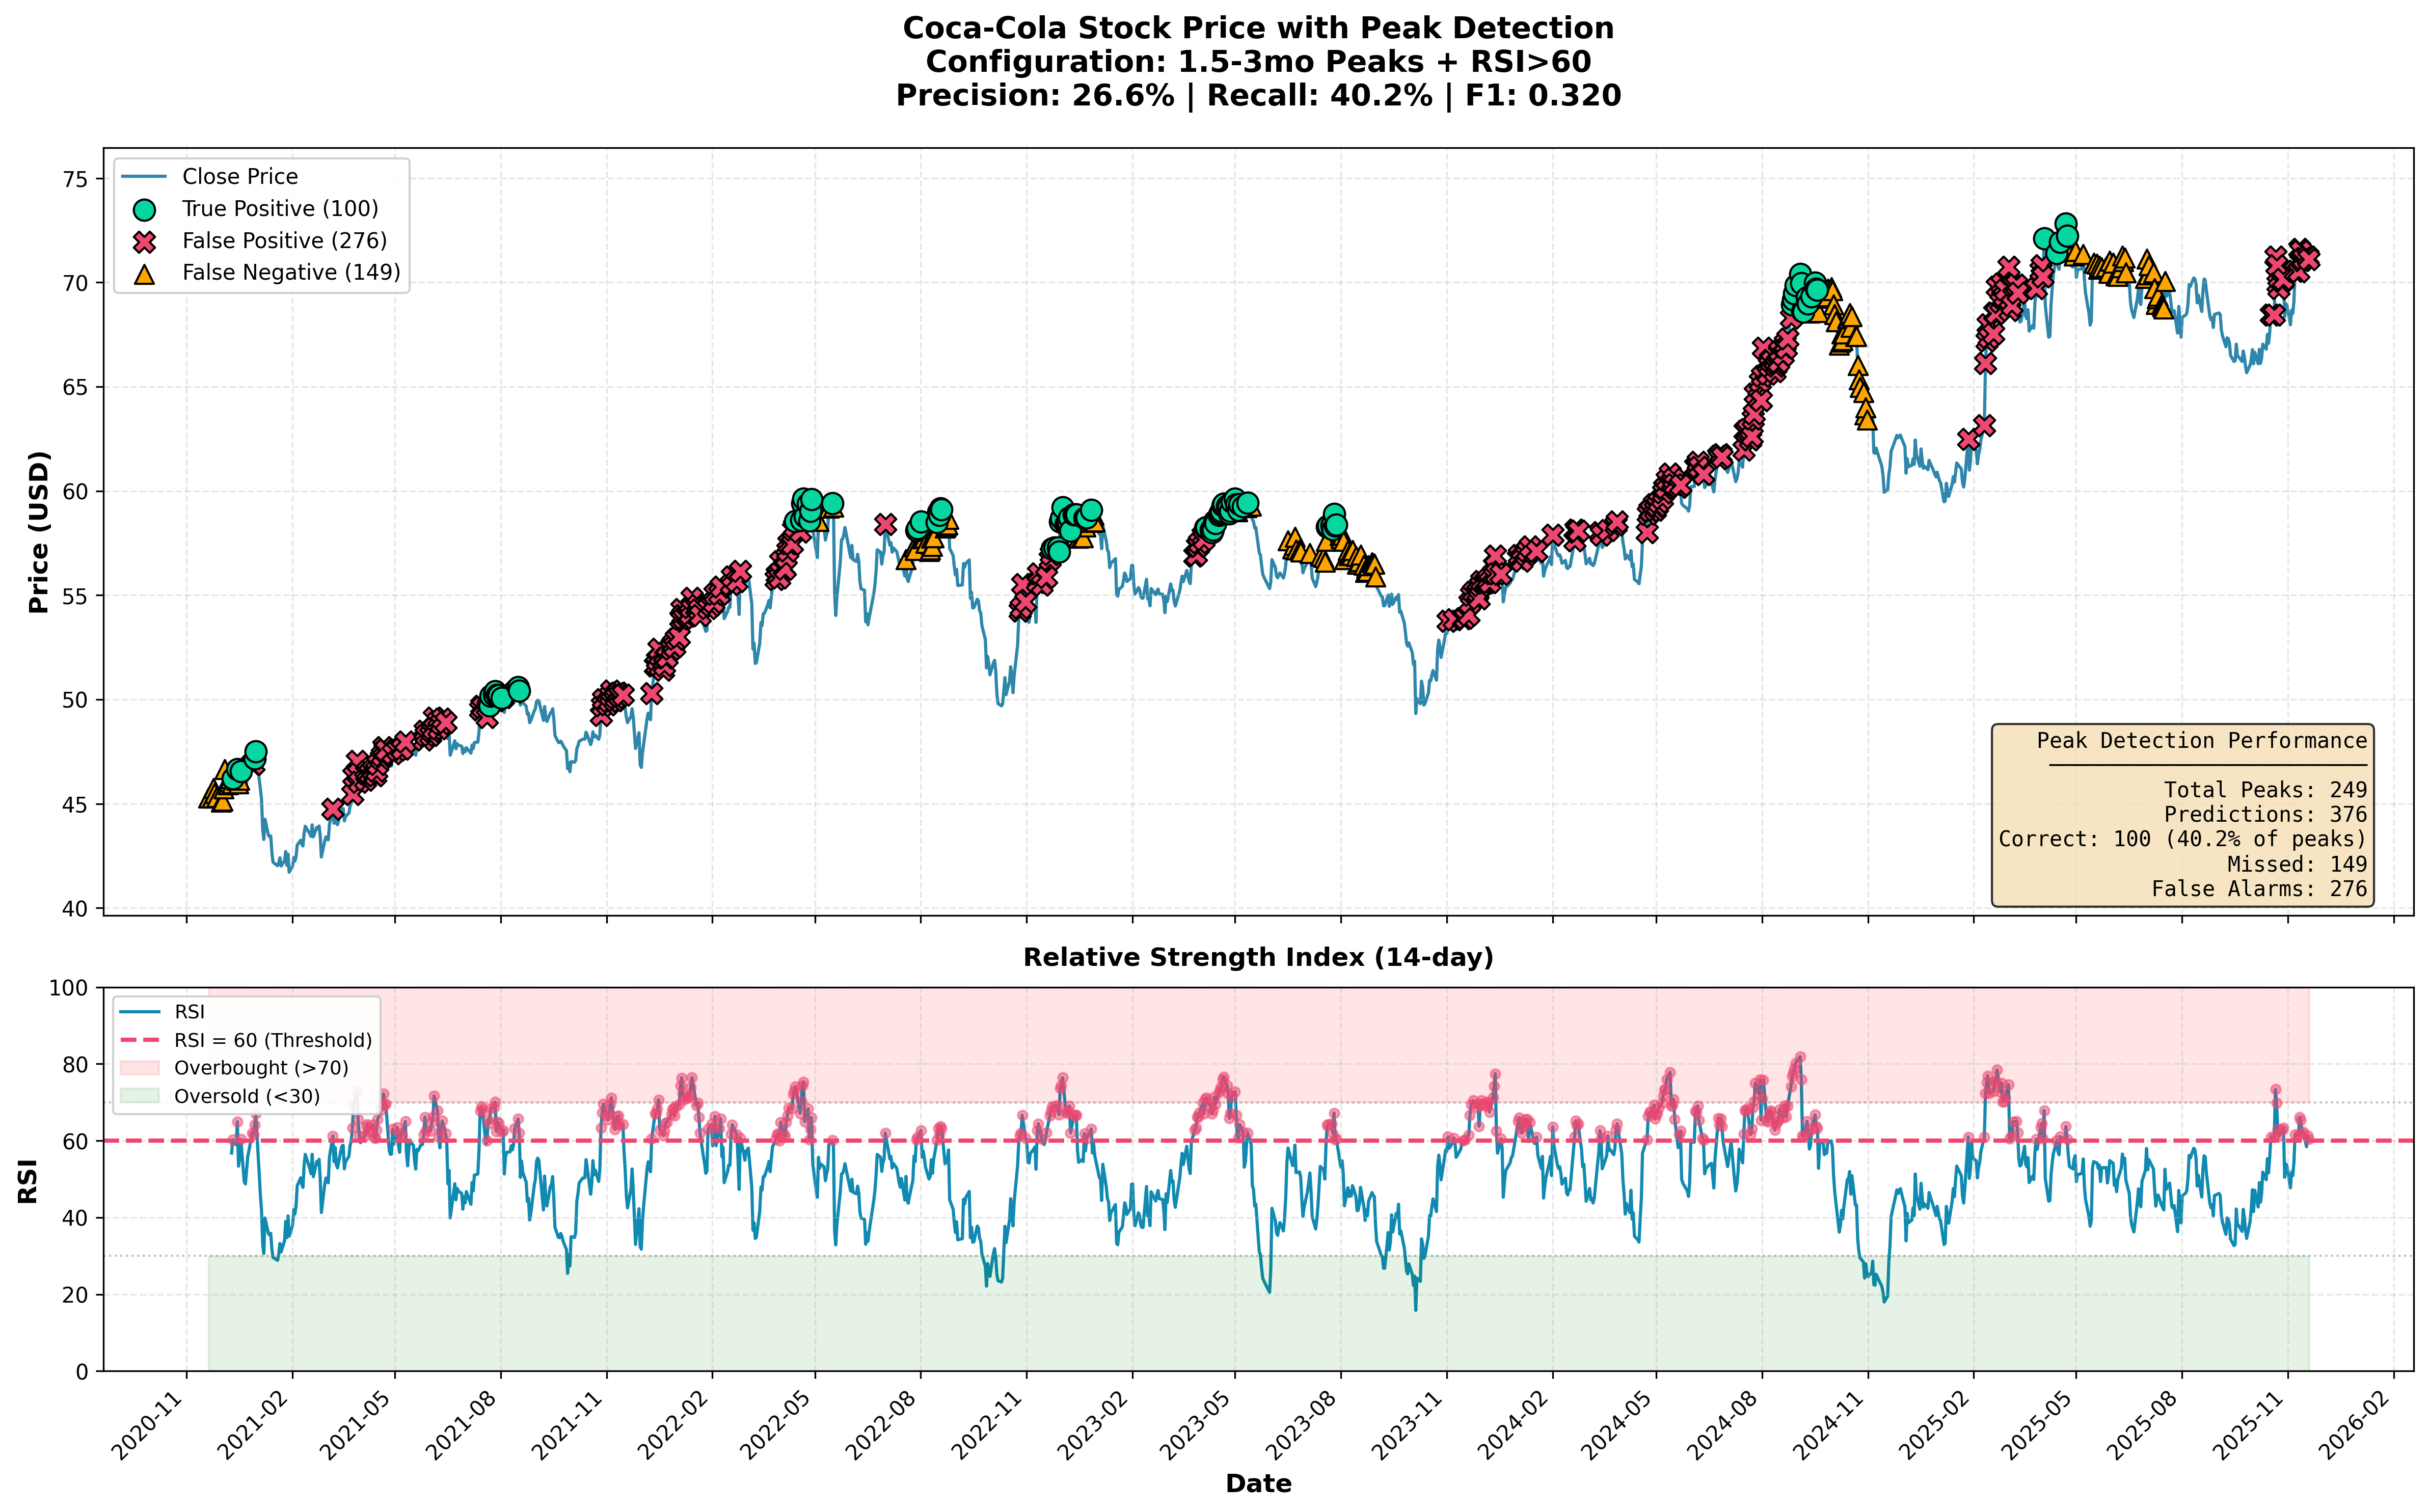
Testing whether RSI (Relative Strength Index) can actually predict stock price peaks. Analysis of 1,255 trading days of Coca-Cola stock reveals RSI performs only 1.34x better than random guessing, with 26.6% precision and high false alarm rates. The data shows why technical indicators should never be used alone for peak prediction.
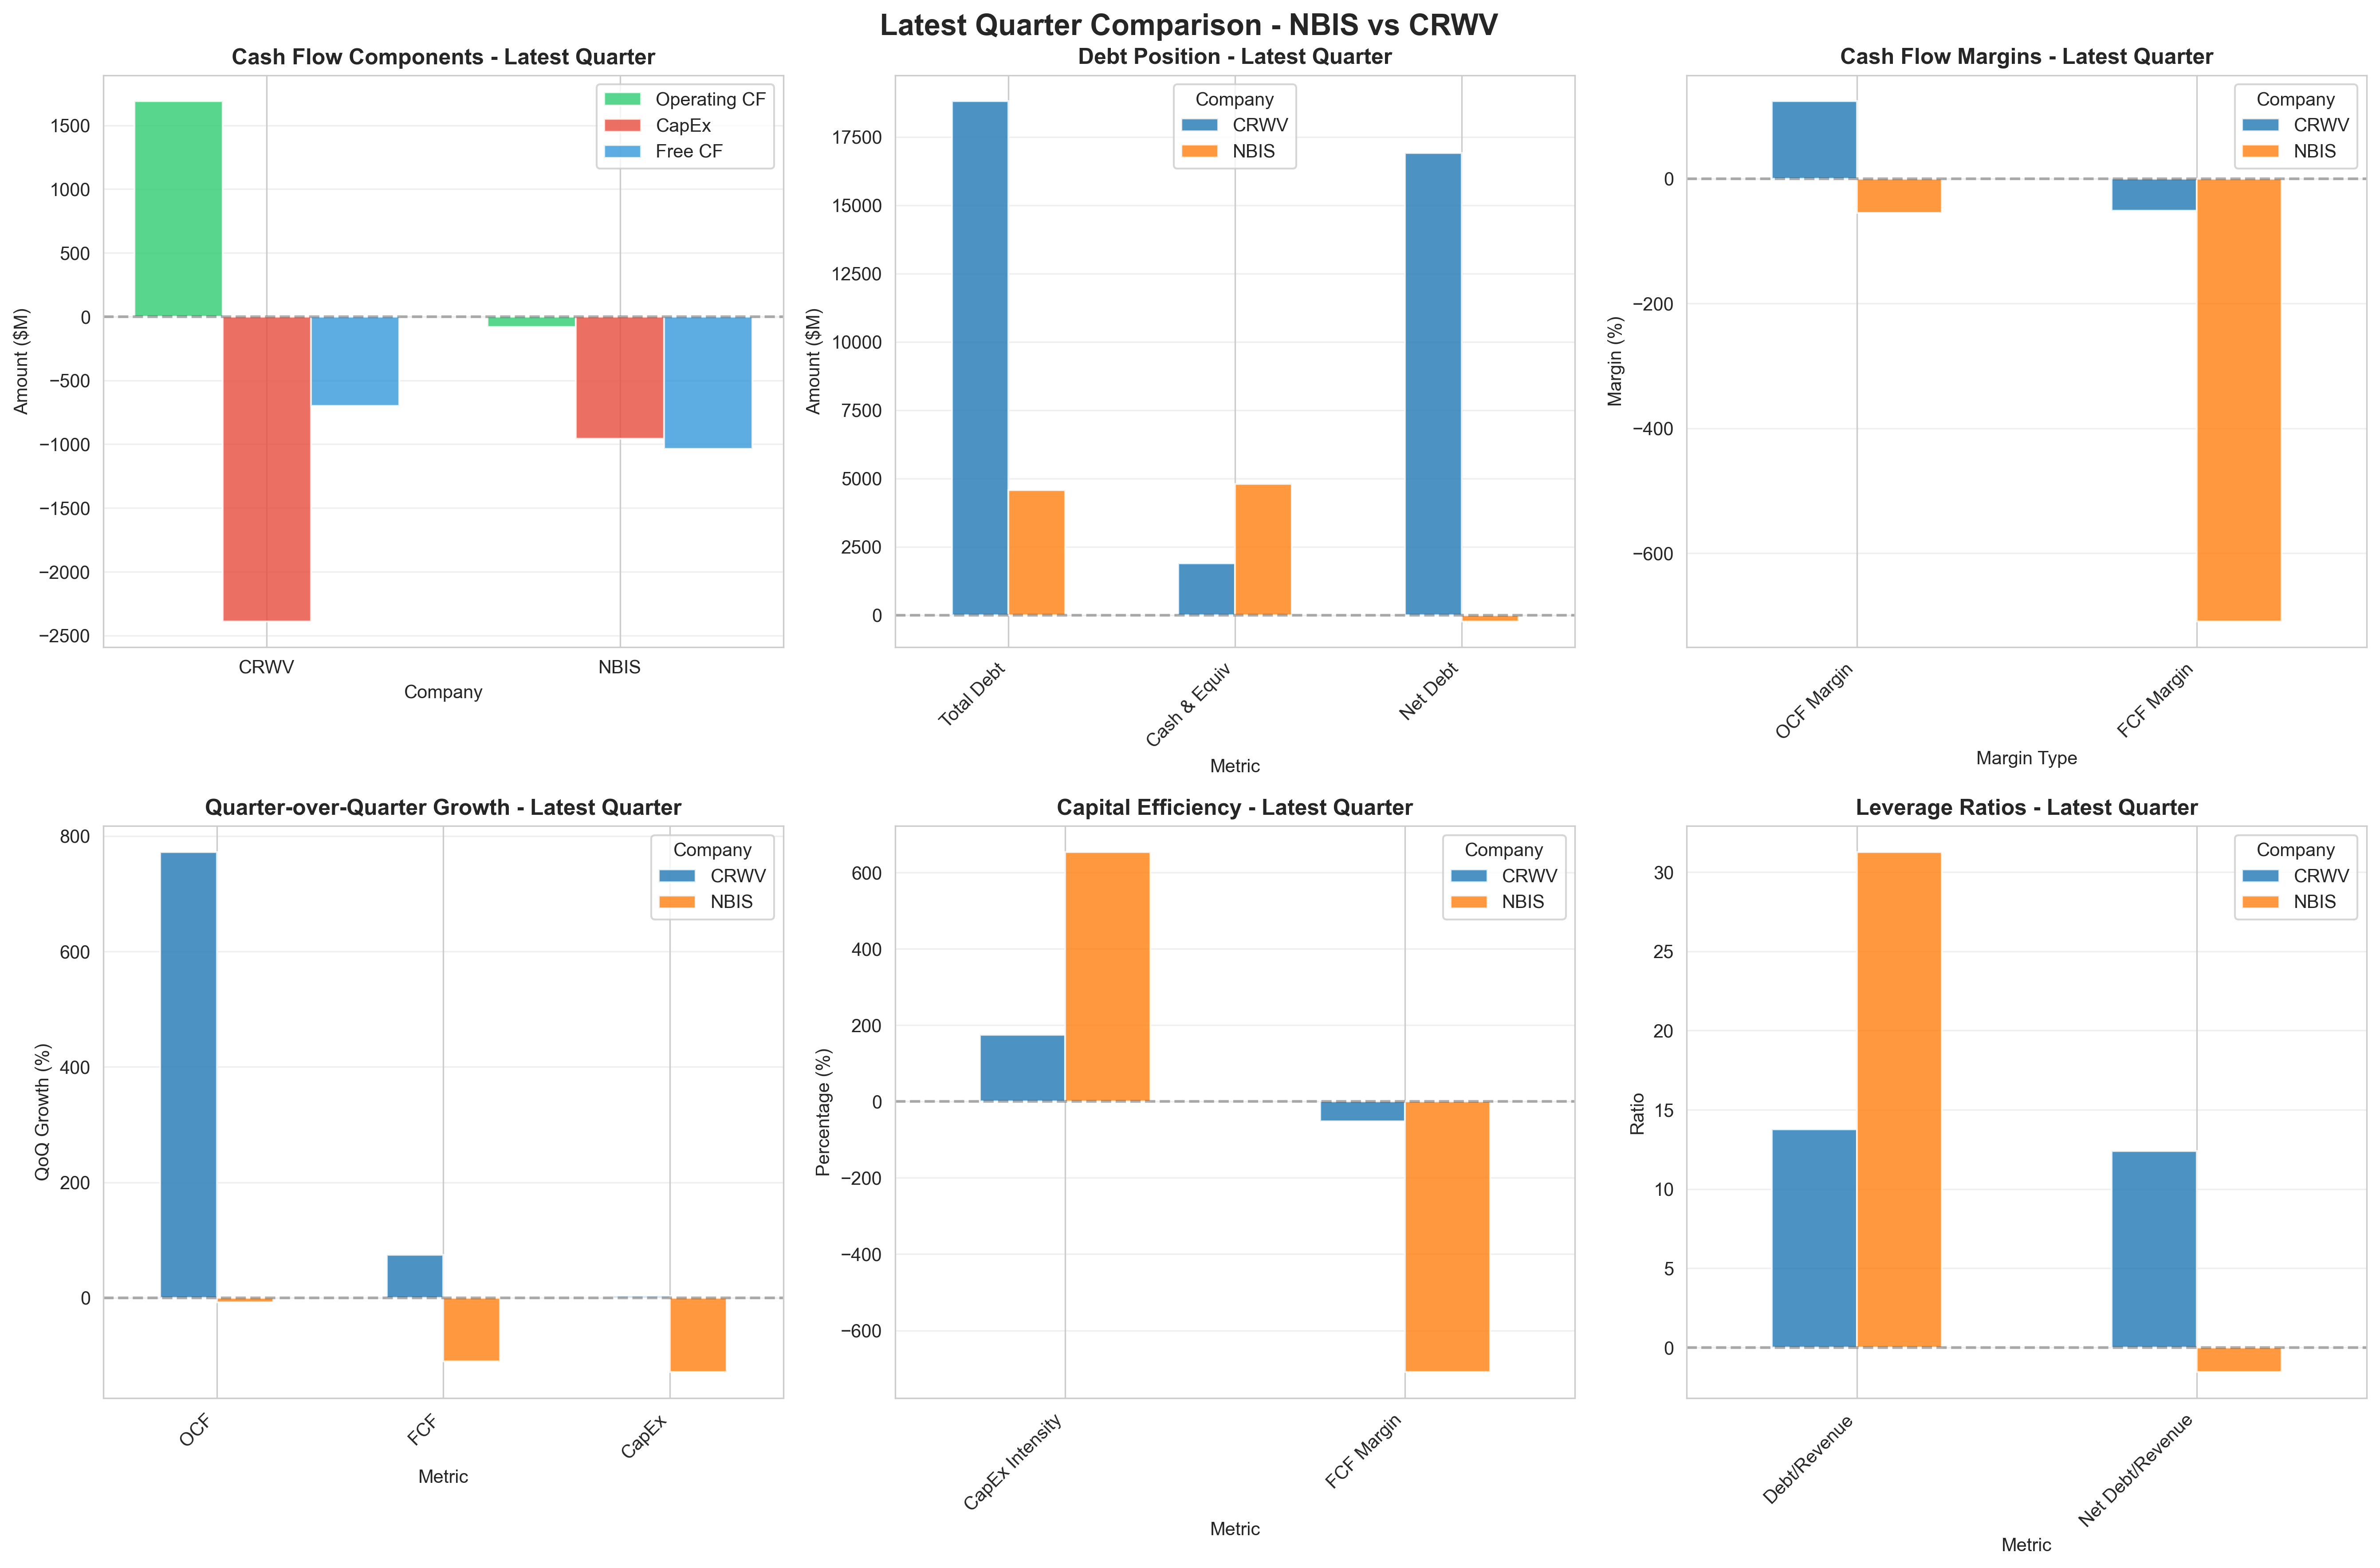
An in-depth financial analysis of Nebius and Coreweave, two AI infrastructure companies burning billions in capital expenditures while accumulating massive debt. This analysis examines their cash flows, profitability, and debt levels to assess whether this represents a sustainable growth story or a bubble ready to pop.
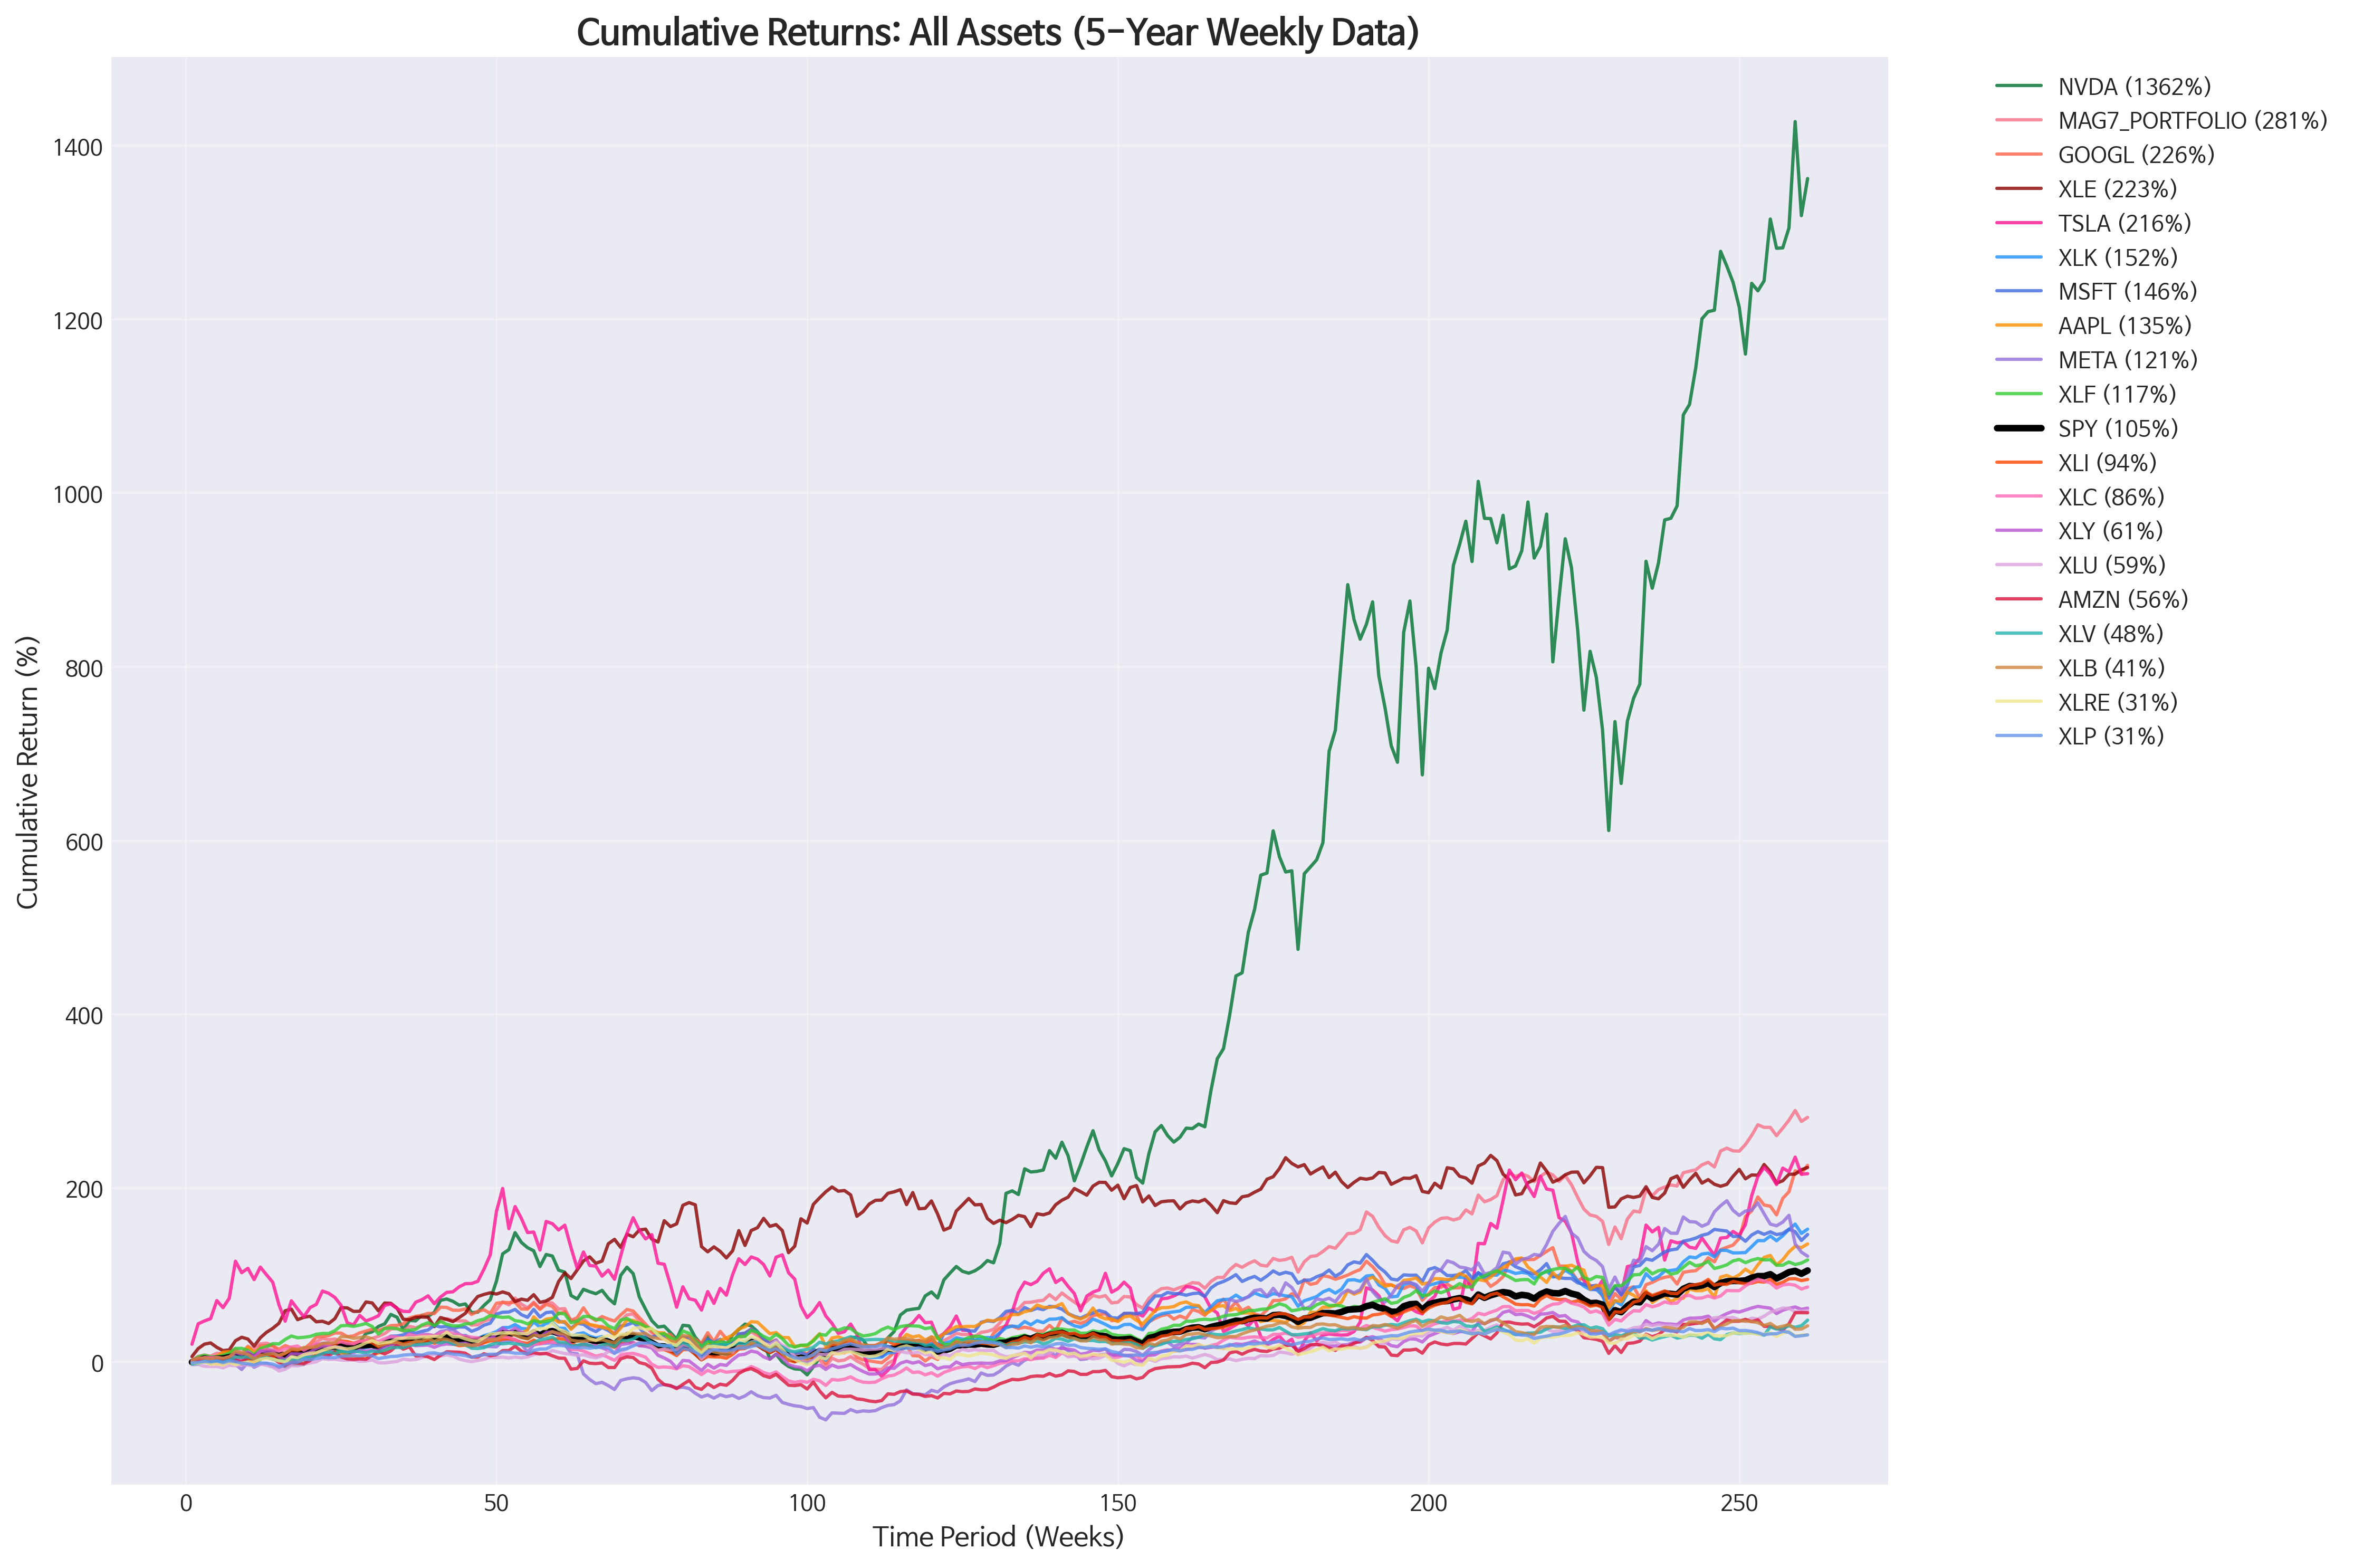
A comprehensive analysis of the Magnificent 7 tech stocks (NVIDIA, Apple, Microsoft, Google, Amazon, Tesla, Meta) over five years (2020-2025), revealing how an equal-weighted portfolio delivered 281% returns with superior risk-adjusted performance, and why true diversification with uncorrelated assets like energy remains crucial even in an era of tech dominance.
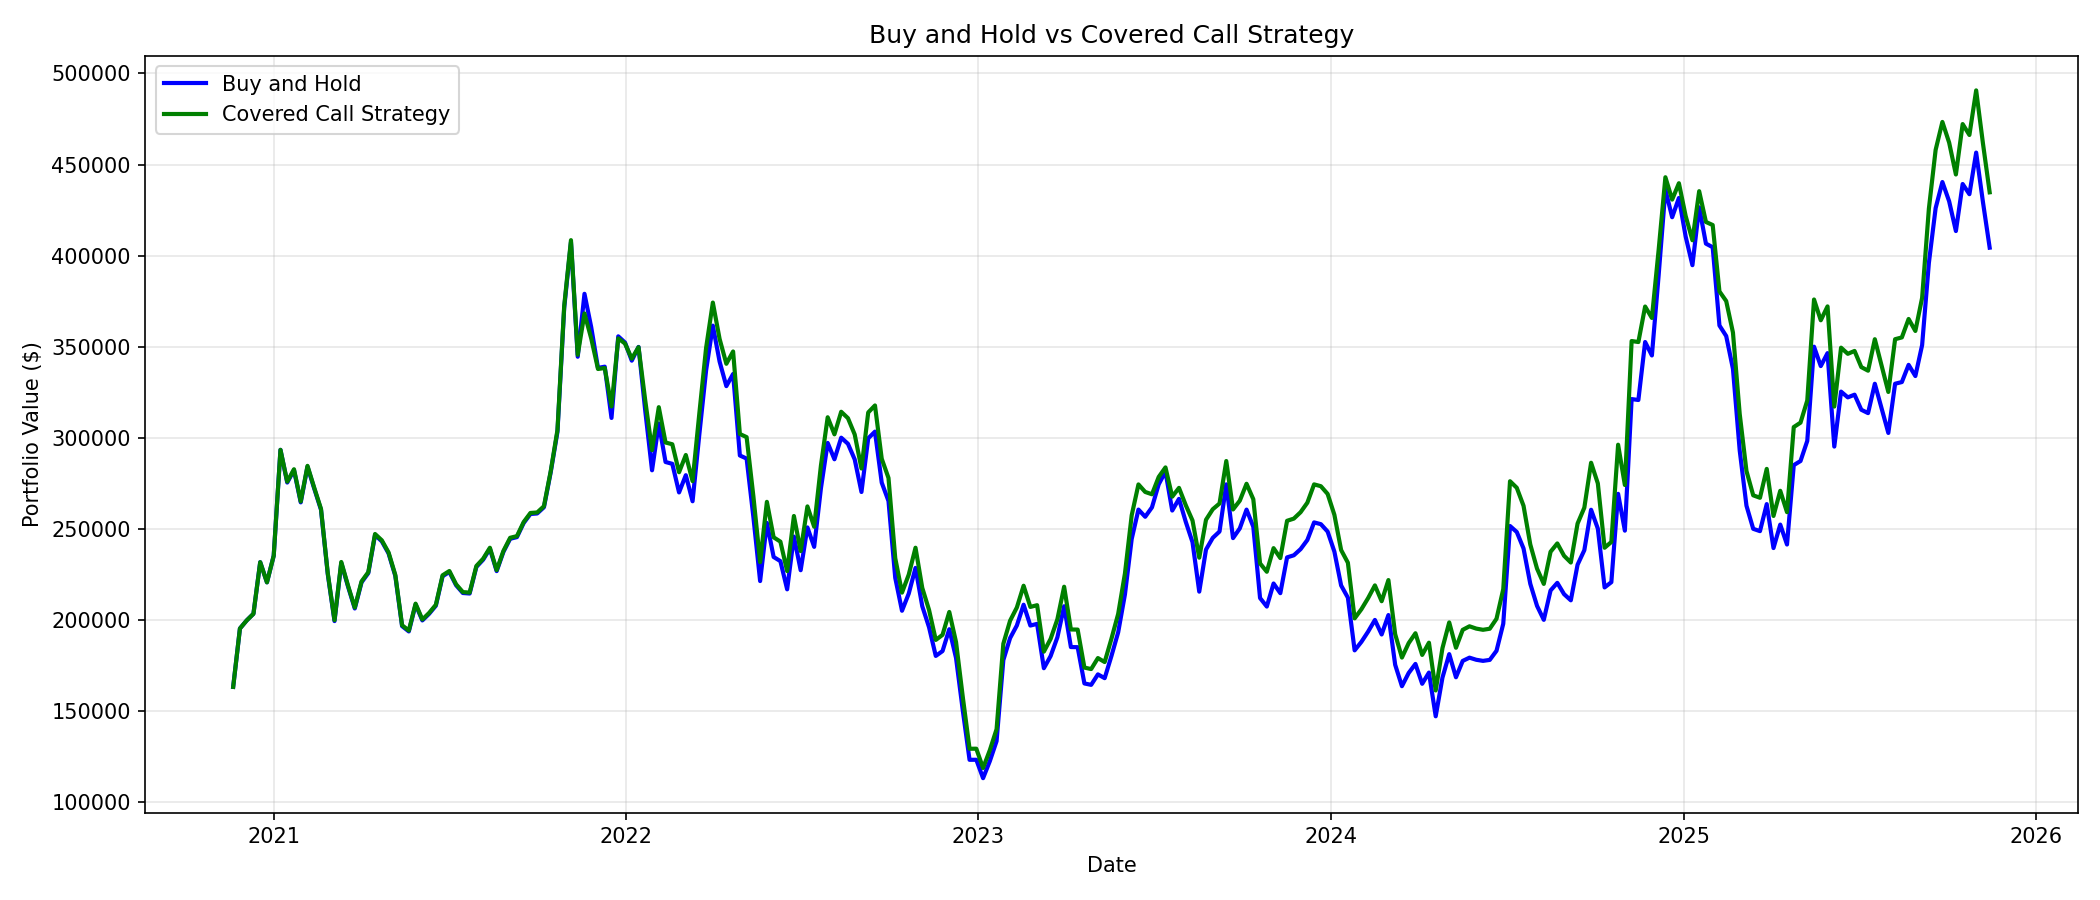
Learn how covered calls can generate extra income from stocks you already own. This guide explains the strategy with a real simulation on Tesla stock (2020-2025), showing k+ in additional returns compared to buy-and-hold.
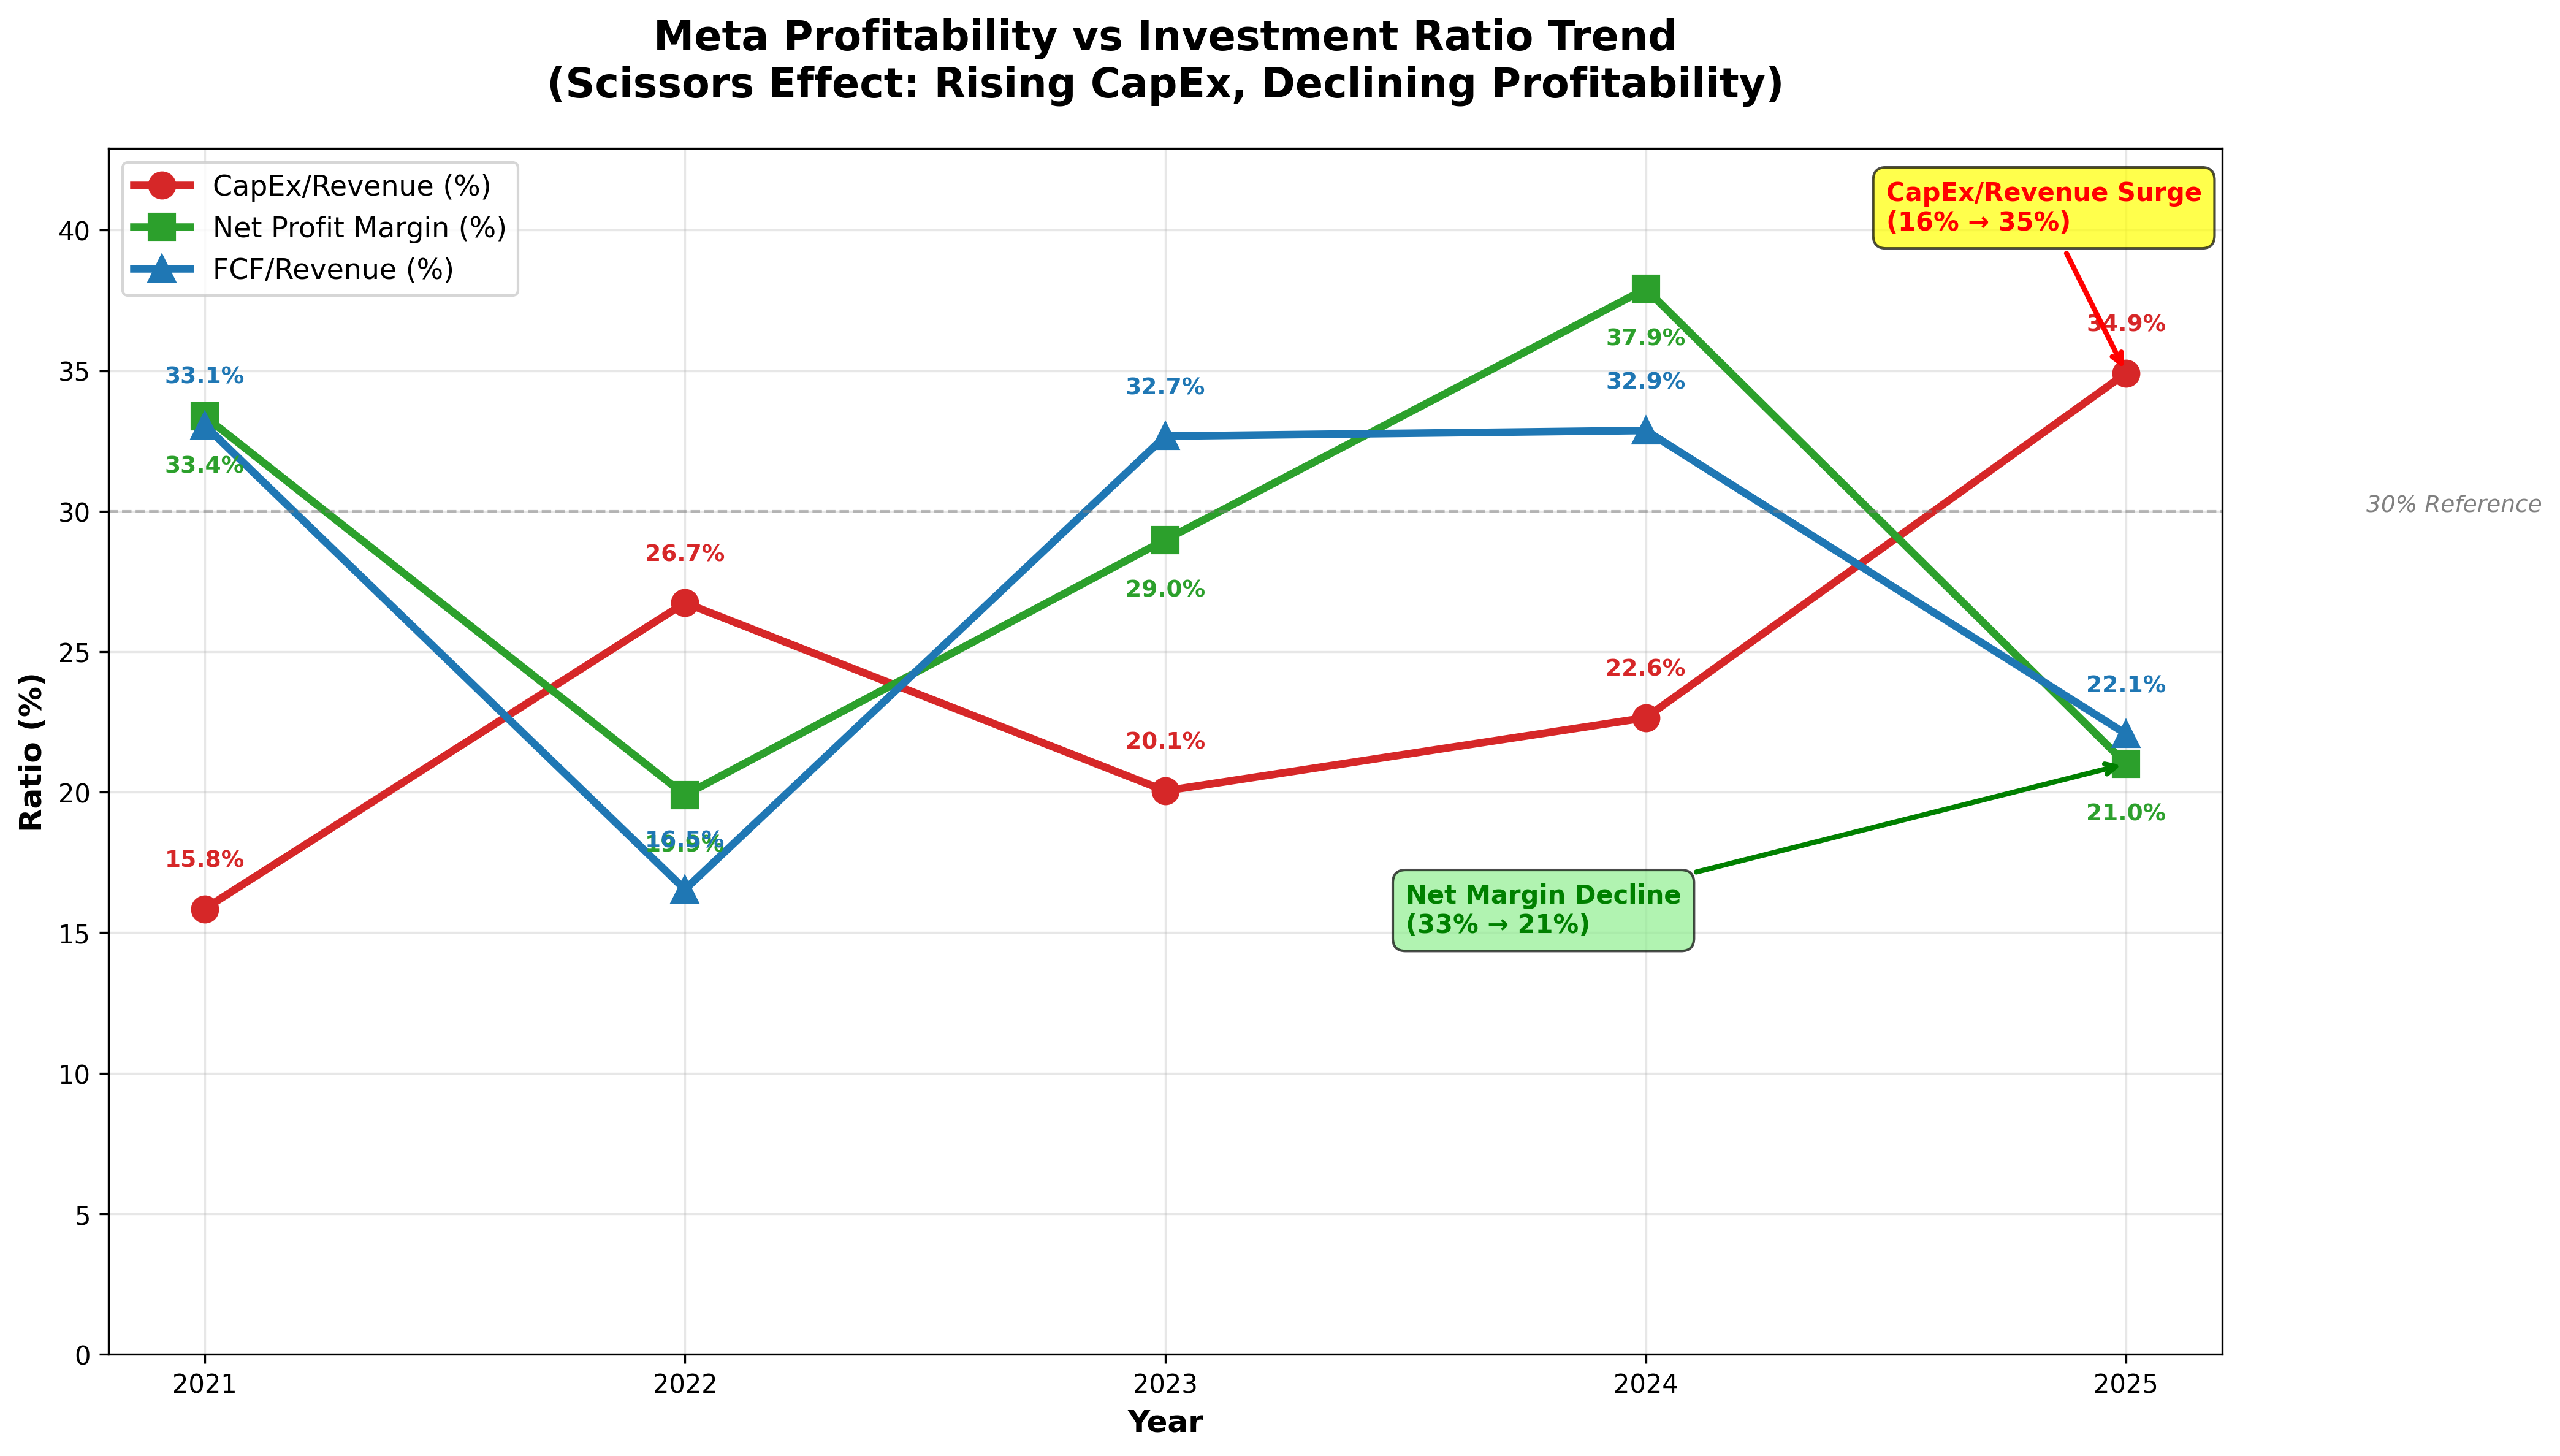
Meta's massive AI infrastructure investment analyzed: $67B in 2025 CapEx, declining free cash flow, and the sustainability questions investors are asking.
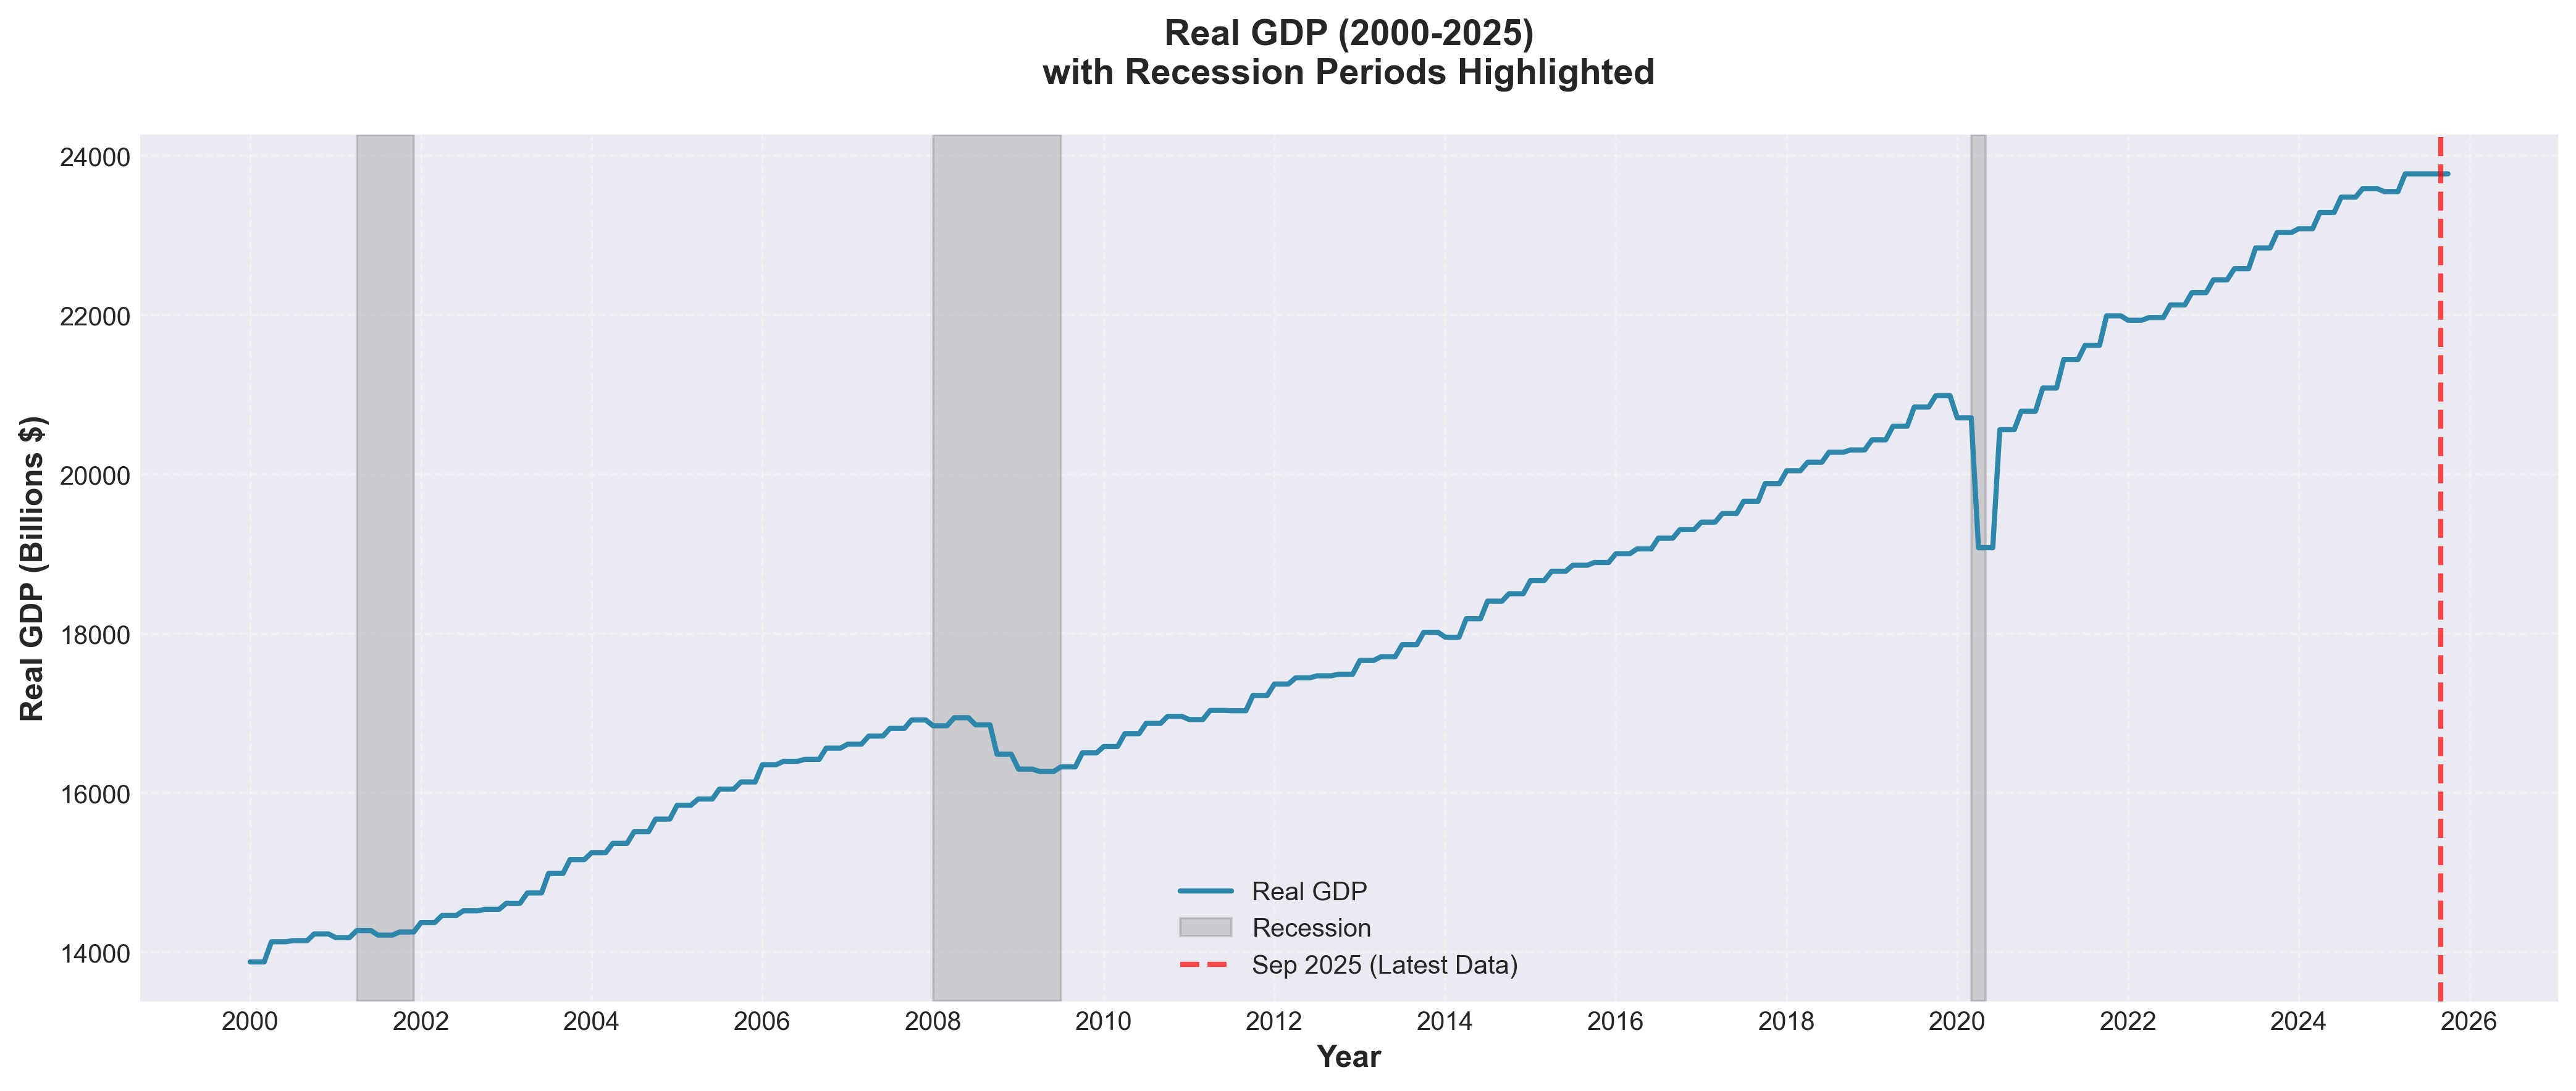
Dive into 25 years of economic data to understand three major recessions: the 2001 Dot-com Bubble, the 2007-2009 Financial Crisis, and the 2020 COVID-19 Recession. Learn how GDP, unemployment, consumer spending, business investment, and industrial production reveal what makes each recession unique and what patterns emerge across all of them.