Meta Spending $67 Billion on AI - Will It Pay Off? The Numbers Behind the AI Bubble Alarm
Published: November 16, 2025
Introduction: Good Performance, But Why the Stock Drop?
Meta's stock price has been puzzling investors lately. Revenue continues to grow steadily and profitability isn't bad, yet the stock is in a downward trend.
What's going on?
The answer lies in data center investment. The scale of Meta's investment in AI infrastructure is beyond imagination.
But exactly how large is this investment? Let's look at the numbers.
Quick Primer: Reading Financial Statements
Before diving into the analysis, let's cover the key concepts needed to understand a company's financial health.
"How Do We Calculate the Money a Company Can Actually Use?"
Step 1: From Revenue to Net Income
First, we have Revenue - the total income a company earns.
From this, the following costs are deducted:
- Cost of Revenue: Direct costs of producing products or services
- Operating Expenses: Personnel costs, marketing, R&D, etc.
- Interest and Taxes: Loan interest, corporate taxes, etc.
The final result after all these deductions is Net Income.
Real Example (Meta 2024):
- Revenue: $164.5B (~$220 trillion KRW)
- Net Income: $62.4B (~$83 trillion KRW)
- Net Margin: 37.9%
Step 2: From Net Income to Operating Cash Flow
Here's an important point: Net Income ≠ Actual Cash
Why? Because accounting records items even when no actual cash moves:
- Depreciation: Buildings or equipment losing value over time is recorded as an expense on the books, but no actual cash goes out
- Accounts Receivable/Payable: Recorded in books but cash exchanged later
- Inventory Changes: Inventory increases tie up cash but aren't expenses
After adjusting for these items, we get the actual cash from operations: Operating Cash Flow.
Real Example (Meta 2024):
- Net Income: $62.4B
- Operating Cash Flow: $91.3B
Operating cash flow exceeds net income because non-cash expenses like depreciation are added back.
Step 3: Subtract CapEx to Get Free Cash Flow
Just because a company generates cash from operations doesn't mean it can spend all of it freely.
To keep the business running, essential investments are needed:
- Server and data center construction
- Office building purchases
- Equipment replacement and upgrades
These investments are called Capital Expenditure (CapEx).
Subtracting CapEx from operating cash flow gives us Free Cash Flow (FCF):
FCF = Operating Cash Flow - CapEx
FCF is the money a company can truly spend "freely":
- Paying dividends to shareholders
- Stock buybacks
- Debt repayment
- Additional business investments
Real Example (Meta 2024):
- Operating Cash Flow: $91.3B
- CapEx: $37.3B
- Free Cash Flow: $54.1B
Key Points Summary
Revenue: $164.5B
 ↓ (deduct costs)
Net Income: $62.4B - Book profit
 ↓ (adjust non-cash items)
Operating CF: $91.3B - Actual cash received
 ↓ (deduct essential investment)
Free Cash Flow (FCF): $54.1B - Money available for discretionary use
Important Messages:
- Declining FCF = Less money available for discretionary spending
- If CapEx is too large, FCF can go negative = Need additional funding
- CapEx is investment for the future, but too much can harm current financial health
Now with these concepts in mind, let's examine Meta's investment scale.
Main Analysis 1: The Reality of Investment Scale
"How Much Is Meta Spending?"
Meta's Capital Expenditure (CapEx) by year:
- 2021: $18.7B (~$25 trillion KRW)
- 2022: $31.2B (~$42 trillion KRW)
- 2023: $27.0B (~$36 trillion KRW)
- 2024: $37.3B (~$50 trillion KRW)
- 2025 Projected: $67.1B (~$90 trillion KRW)
Can't grasp how big $67.1B is for 2025?
Let's Put It in Perspective
South Korea's 2024 Defense Budget: ~$59 trillion KRW Meta's 2025 CapEx: ~$90 trillion KRW
Meta's annual capital investment exceeds South Korea's entire defense budget.
Samsung Electronics Pyeongtaek Semiconductor Plant: Total investment ~$30 trillion KRW Meta's 2025 CapEx: ~$90 trillion KRW
They're investing enough in one year to build three Pyeongtaek plants.
Cumulative Investment Is Even More Staggering
4-year cumulative CapEx from 2022 to 2025:
- $162.6B (~$215 trillion KRW)
This is enough to establish hundreds of small-to-medium enterprises and rivals the GDP of many countries.
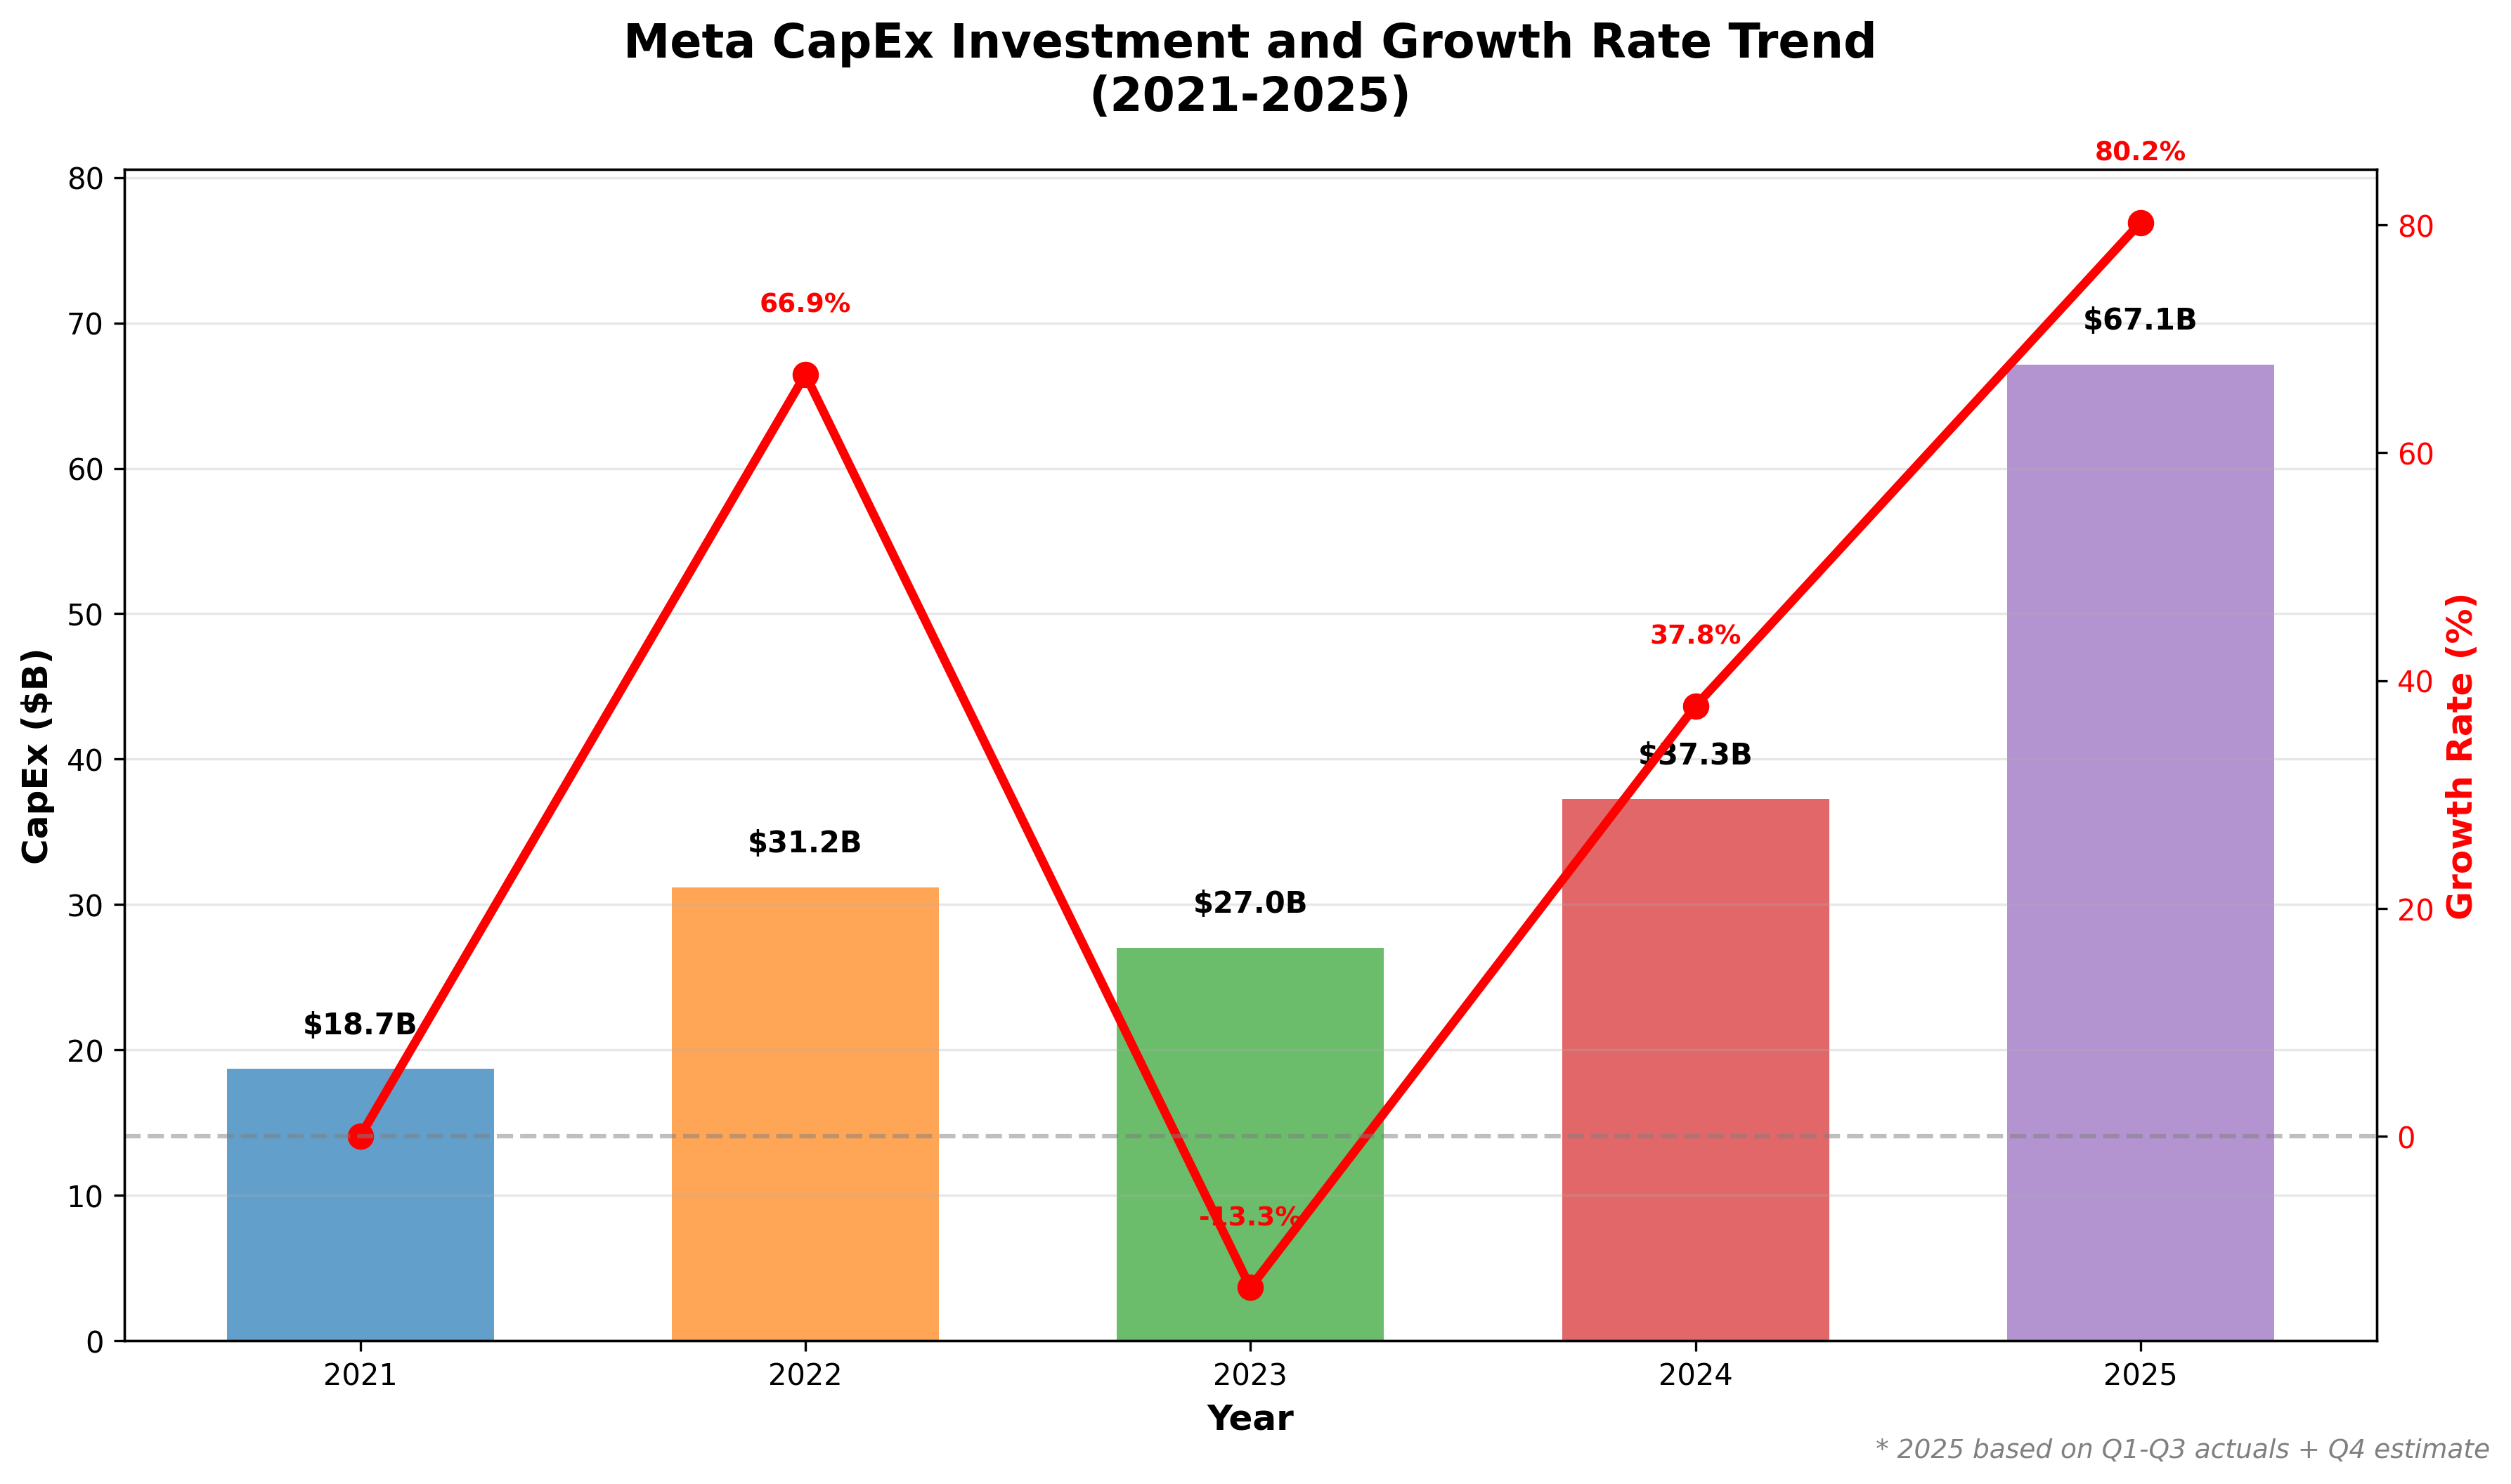 [Figure 1] Meta's CapEx investment exploded from $18.7B in 2021 to $67.1B in 2025.
Main Analysis 2: Accelerating Investment Pace
"But the Problem Is the Speed"
The investment scale is shocking, but the bigger issue is the rate of increase.
Annual CapEx Growth Rate
- 2022: +66.9% YoY
- 2023: -13.3% YoY (temporary decline)
- 2024: +37.8% YoY
- 2025: +80.2% YoY ← Nearly doubled!
2025 CapEx increased 80% year-over-year. This means nearly doubling an already massive 2024 investment.
Looking at [Figure 1], there's a surge in 2022, a brief pause in 2023, then another explosion in 2024-2025. The 80.2% growth rate in 2025 (red line) shows the steepest climb on the graph.
Revenue-to-CapEx Ratio Changes
Even more shocking is the investment-to-revenue ratio:
| Year | CapEx/Revenue Ratio |
|---|---|
| 2021 | 15.8% |
| 2022 | 26.7% |
| 2023 | 20.1% |
| 2024 | 22.6% |
| 2025 | 34.9% |
In 2025, 35% of revenue goes to capital investment.
Simply put, for every $100 Meta earns, $35 goes to data centers and AI infrastructure.
Four years ago in 2021, it was 16% of revenue - now more than doubled.
How Exceptional Is This?
Typically, mature IT companies have CapEx/Revenue ratios of 10-15%.
Meta's 35% is:
- 2-3 times that of typical IT companies
- Traditional manufacturing industry levels
- Even comparable to capital-intensive telecom companies (SKT, KT, etc.)
This is abnormally high for a company that makes money through software and advertising.
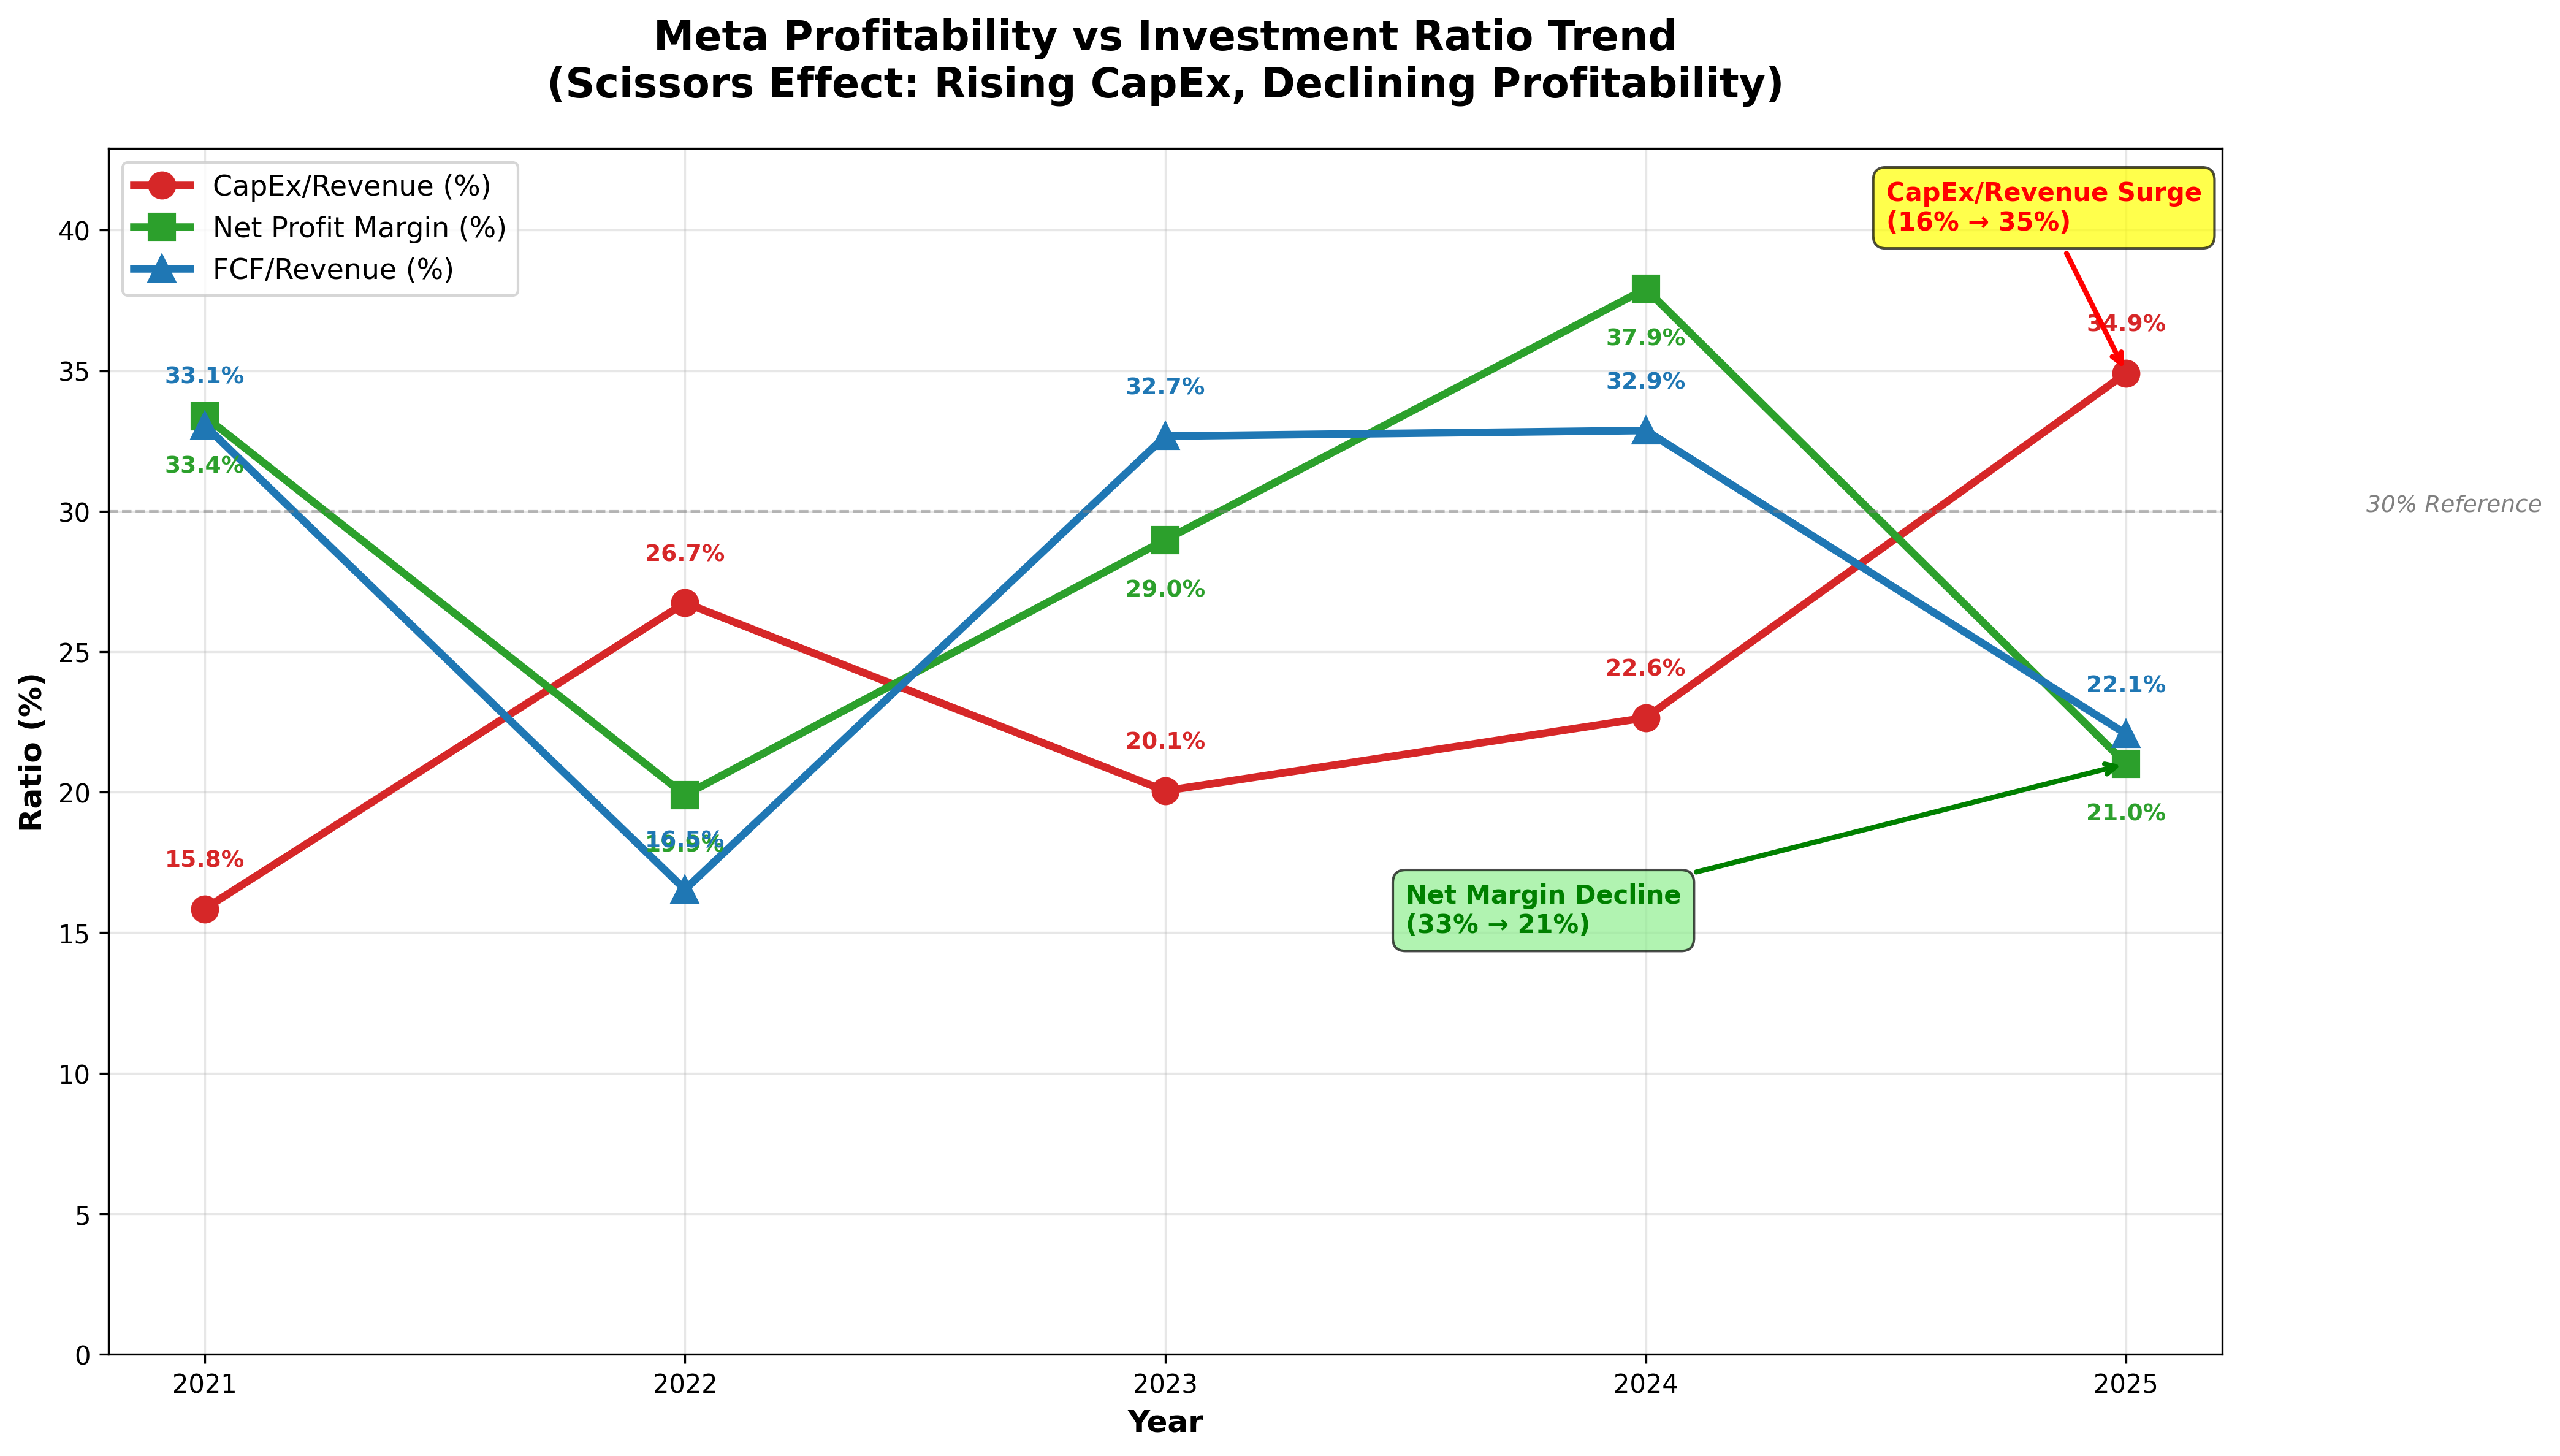 [Figure 2] The "scissors effect" is clear: CapEx/Revenue ratio (red line) surges while Net Margin (green line) and FCF/Revenue ratio (blue line) decline.
Key Insight from [Figure 2]:
The red line (CapEx/Revenue) and green line (Net Margin) nearly cross in 2025. In 2021, CapEx was 16% of revenue and net margin was 33% - a "healthy" balance. But in 2025, CapEx is 35% and net margin is 21%, nearing a reversal.
This graph visually demonstrates investor anxiety: "How long can this pace of investment continue?"
Main Analysis 3: Where Does the Money Come From?
"For Now, They Can Sustain It"
To make such massive investments, you need money. Where does Meta get it?
Operating Cash Flow Analysis
Fortunately, Meta's core business remains healthy:
- 2024: $91.3B
- 2025 Projected: $109.6B
- Growth Rate: +20.0%
Cash from operations continues to grow. Evidence that the advertising business is solid.
Free Cash Flow Changes
But the problem is free cash flow:
- 2024: $54.1B
- 2025 Projected: $42.5B
- Change: -21.5%
Operating cash flow increased 20%, but FCF actually decreased 21%!
FCF/OpCF Ratio: A Warning Signal
To see this more intuitively, let's look at "what portion of operating cash flow can be used freely":
- 2021: 67.6% (68% of cash earned available for free use)
- 2024: 59.2% (only 59% available)
- 2025: 38.7% (only 39% available)
What does this mean?
In 2021, out of $100 earned from operations, $68 could be spent freely. In 2025, only $39 out of $100 can be spent freely.
The remaining $61 is tied up in CapEx.
"Still" Sustainable with Internal Cash
The positive aspect is that FCF remains positive for now.
2025's projected FCF of $42.5B is enough for:
- Dividend payments (~$5B)
- Stock buybacks (~$30B)
However...
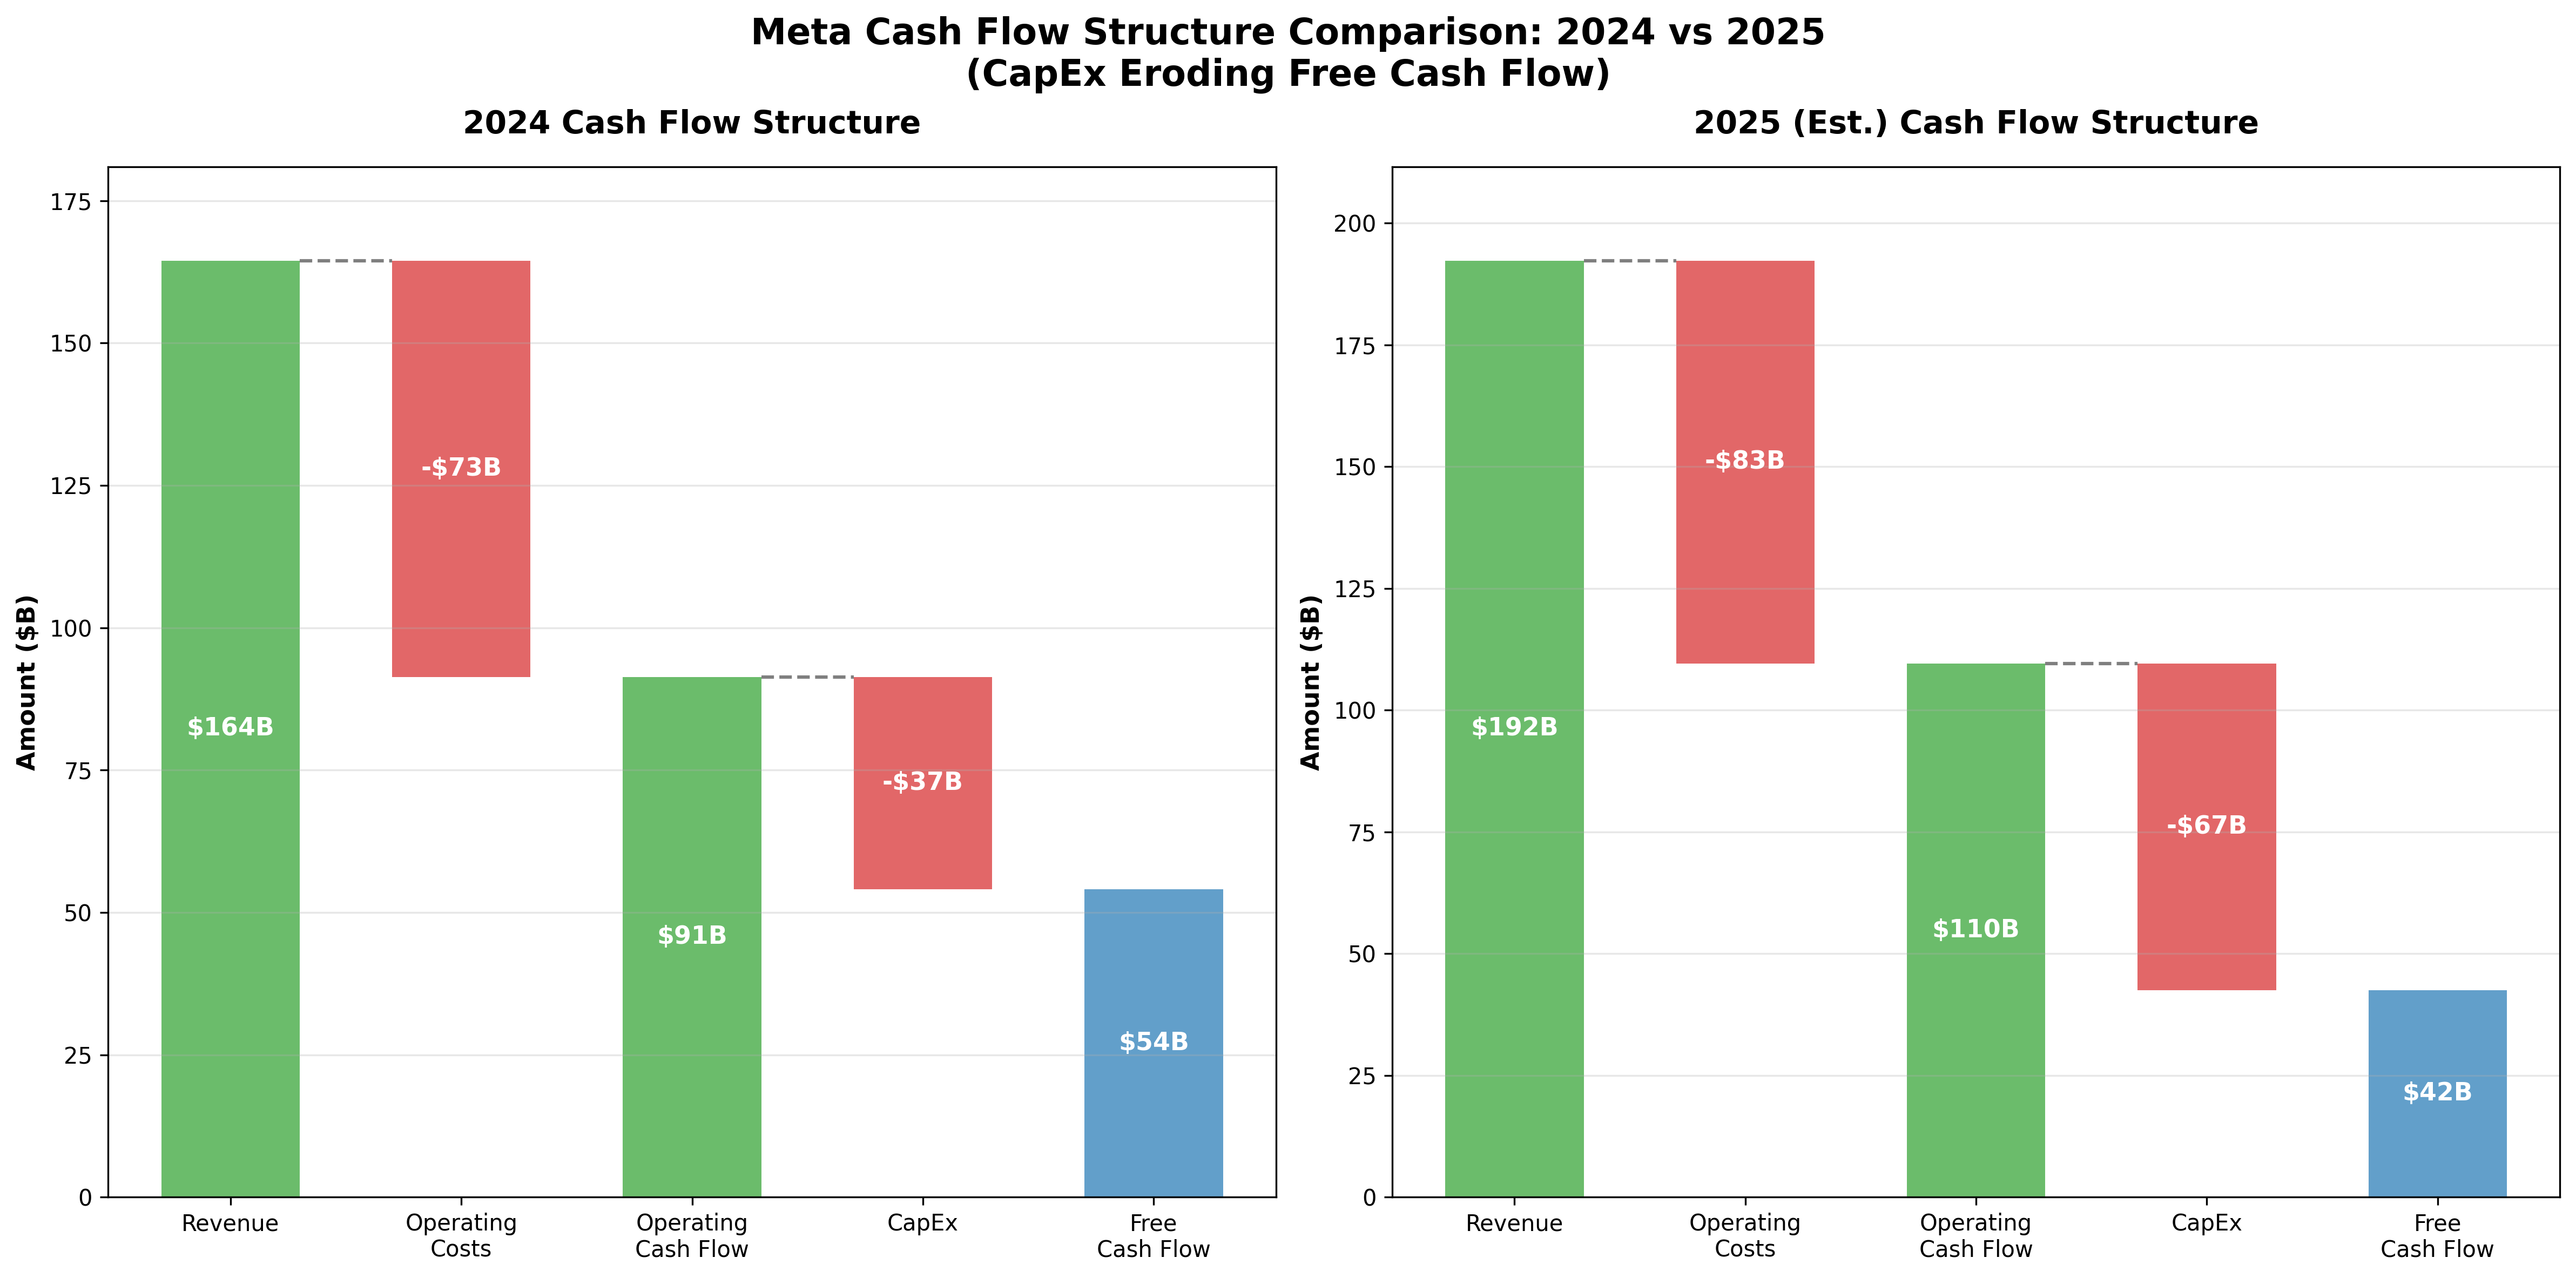 [Figure 3] Comparing 2024 and 2025 cash flow structures clearly shows CapEx "eroding" FCF.
Key Observation in [Figure 3]:
Compare left (2024) and right (2025). Operating cash flow (green bar) grew from $91B to $110B, but CapEx (red bar) nearly doubled from $37B to $67B, causing final FCF (blue bar) to actually decrease from $54B to $42B.
Visually, the red bar (CapEx) is "eating up" more and more cash.
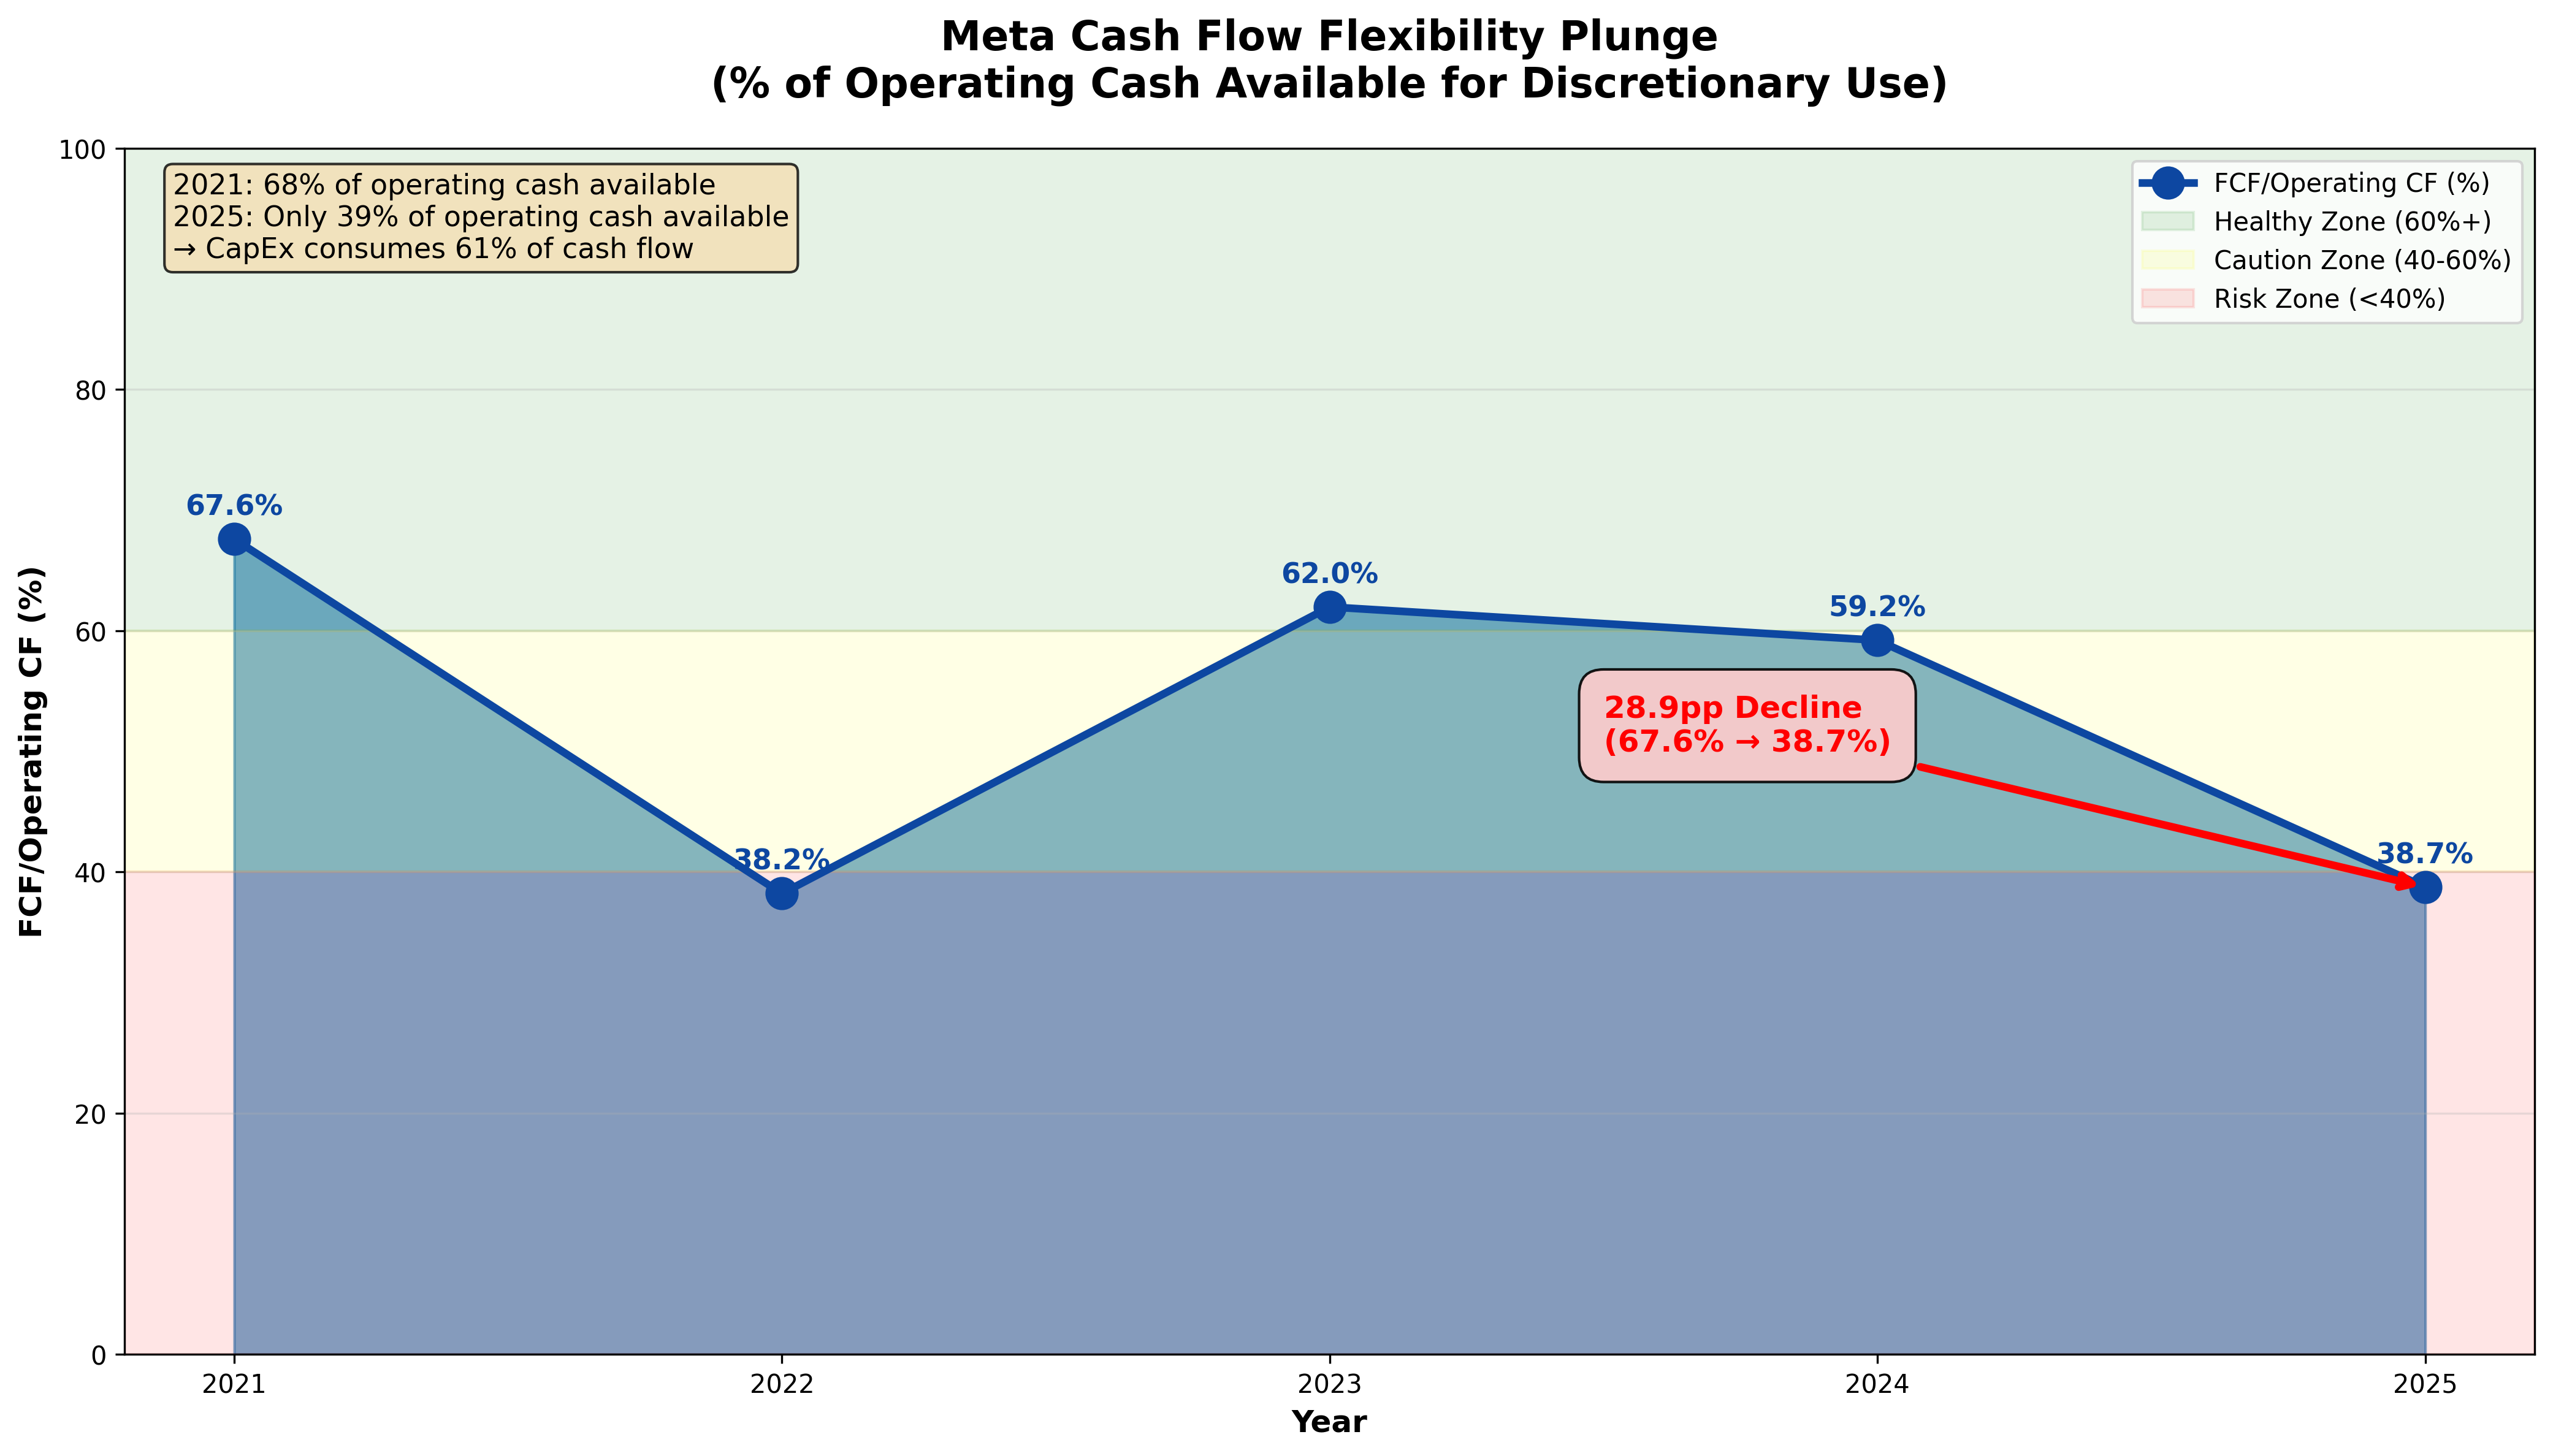 [Figure 4] The proportion of operating cash flow available for free use plummeted from 68% to 39%, now entering the danger zone (<40%).
Warning Signal from [Figure 4]:
In 2021, we were in the blue zone (healthy level), but by 2025, we've fallen into the red zone (risk zone). Out of $100 earned from operations, $61 goes to CapEx, with only $39 available for discretionary use.
The red arrow pointing to a 28.9 percentage point drop represents a dramatic change in just 4 years.
Main Analysis 4: Sustainability Concerns
"How Long Can This Last?"
The biggest concern is sustainability.
Scenario Analysis: What if CapEx grows 80% again in 2026?
Assuming 2025's growth rate (80.2%) continues into 2026:
- 2026 CapEx: ~$120B ($160 trillion KRW)
What happens to FCF in this case?
Assuming operating cash flow grows 20%:
- 2026 Operating Cash Flow: ~$131.5B
- 2026 CapEx: ~$120B
- 2026 FCF: ~$11.5B
At $11.5B FCF, stock buybacks and dividends would need to be drastically reduced.
More Extreme Scenario: If CapEx Growth Continues?
If CapEx grows 60% annually through 2027:
- 2027 CapEx: ~$190B
Even with 25% operating cash flow growth:
- 2027 Operating Cash Flow: ~$164B
- FCF: Negative $26B
If FCF goes negative:
- Additional borrowing needed
- Stock buybacks halted
- Potential dividend cuts
- Deteriorating financial health
Reverse-Engineering Required Revenue Growth
To maintain current FCF levels (~$54B):
For 2026:
- Required Operating Cash Flow: ~$124B (assuming $120B CapEx)
- Vs. current operating cash flow ($110B): +13% growth needed
- Required revenue growth rate: At least 15%
The problem:
- Current Meta revenue growth rate: ~17% (16.9%)
- Advertising market growth rate: 5-8% annually
- AI monetization timing: Uncertain
It's difficult to sustain 15%+ revenue growth, especially as scale increases.
Uncertainty of AI Investment Payback Period
The biggest problem is when they'll make money back.
Meta is investing tens of billions in AI infrastructure, but:
- AI ad optimization: Already applied but revenue contribution unclear
- AI new products/services: No clear revenue model yet
- Metaverse: Still a loss-making business
Investors' Questions:
- "Investing $67.1B - when and how much will be recovered?"
- "Competitors (Google, MS) are investing similarly - where's the differentiation?"
- "Any risk of AI infrastructure over-investment?"
The answers aren't clear. This is the core reason for the stock decline.
Conclusion: Why Investors Are Anxious
The Investment vs. Profitability Tug-of-War
Meta faces a clear dilemma:
✅ Why Investment Must Continue:
- Falling behind in AI competition means greater long-term losses
- Google and Microsoft are investing at similar levels
- Infrastructure advantage = Future competitiveness
❌ Why Investment Is Risky:
- Uncertain profit timeline
- Declining FCF reduces shareholder return capacity
- Potential over-investment
- Intense competition may lower ROI
Key Numbers Summary (Figures 1-4 Combined)
The core message from the 4 graphs above, summarized:
| Metric | 2021 | 2024 | 2025 (Est.) | Change |
|---|---|---|---|---|
| CapEx | $19B | $37B | $67B | +259% |
| CapEx/Revenue | 15.8% | 22.6% | 34.9% | +19pp |
| FCF | $39B | $54B | $42B | +9% |
| FCF/OpCF | 68% | 59% | 39% | -29pp |
Conclusion: The Critical Question
What investors really want to know is:
"When and how will this massive investment turn into profits?"
- Will AI advertising revenue explode starting in 2026?
- Will the metaverse become a new revenue source?
- Or will it end as over-investment?
Currently, we don't know the answer.
Meta's core business (advertising) is healthy, and cash generation ability remains strong. But whether this massive CapEx will translate into future growth is uncertain.
That's why the stock is falling.
Investment is for the future, but when that future isn't clear, investors get anxious. Especially when the scale and speed are exceptional.
Whether Meta succeeds in this enormous bet or falls into the trap of over-investment will only be known with time.
This article is based on Meta's public financial statements. This is for informational purposes, not investment advice.
Data Source: Meta Platforms Inc. Quarterly/Annual Financial Statements (2021-2025)
📊 Data Summary
Analysis Period: 2021-2025
Data Used: Annual financial statements + Q3 2025 actual-based estimates
Key Metrics: Revenue, Net Income, Operating Cash Flow, CapEx, Free Cash Flow
Exchange Rate: $1 = ~1,350 KRW (approximate conversion)
Comments (0)
No comments yet. Be the first to comment!