Gold Prices 2005–2025: Understanding Cycles Through Real Rates, Dollar, and Inflation
Understanding gold as a formula can feel complicated. So let me tell it like a story. Picture a simple dashboard in your mind. On this dashboard, there are two main needles and four supporting actors.
1. The Gold Dashboard—Two Main Needles
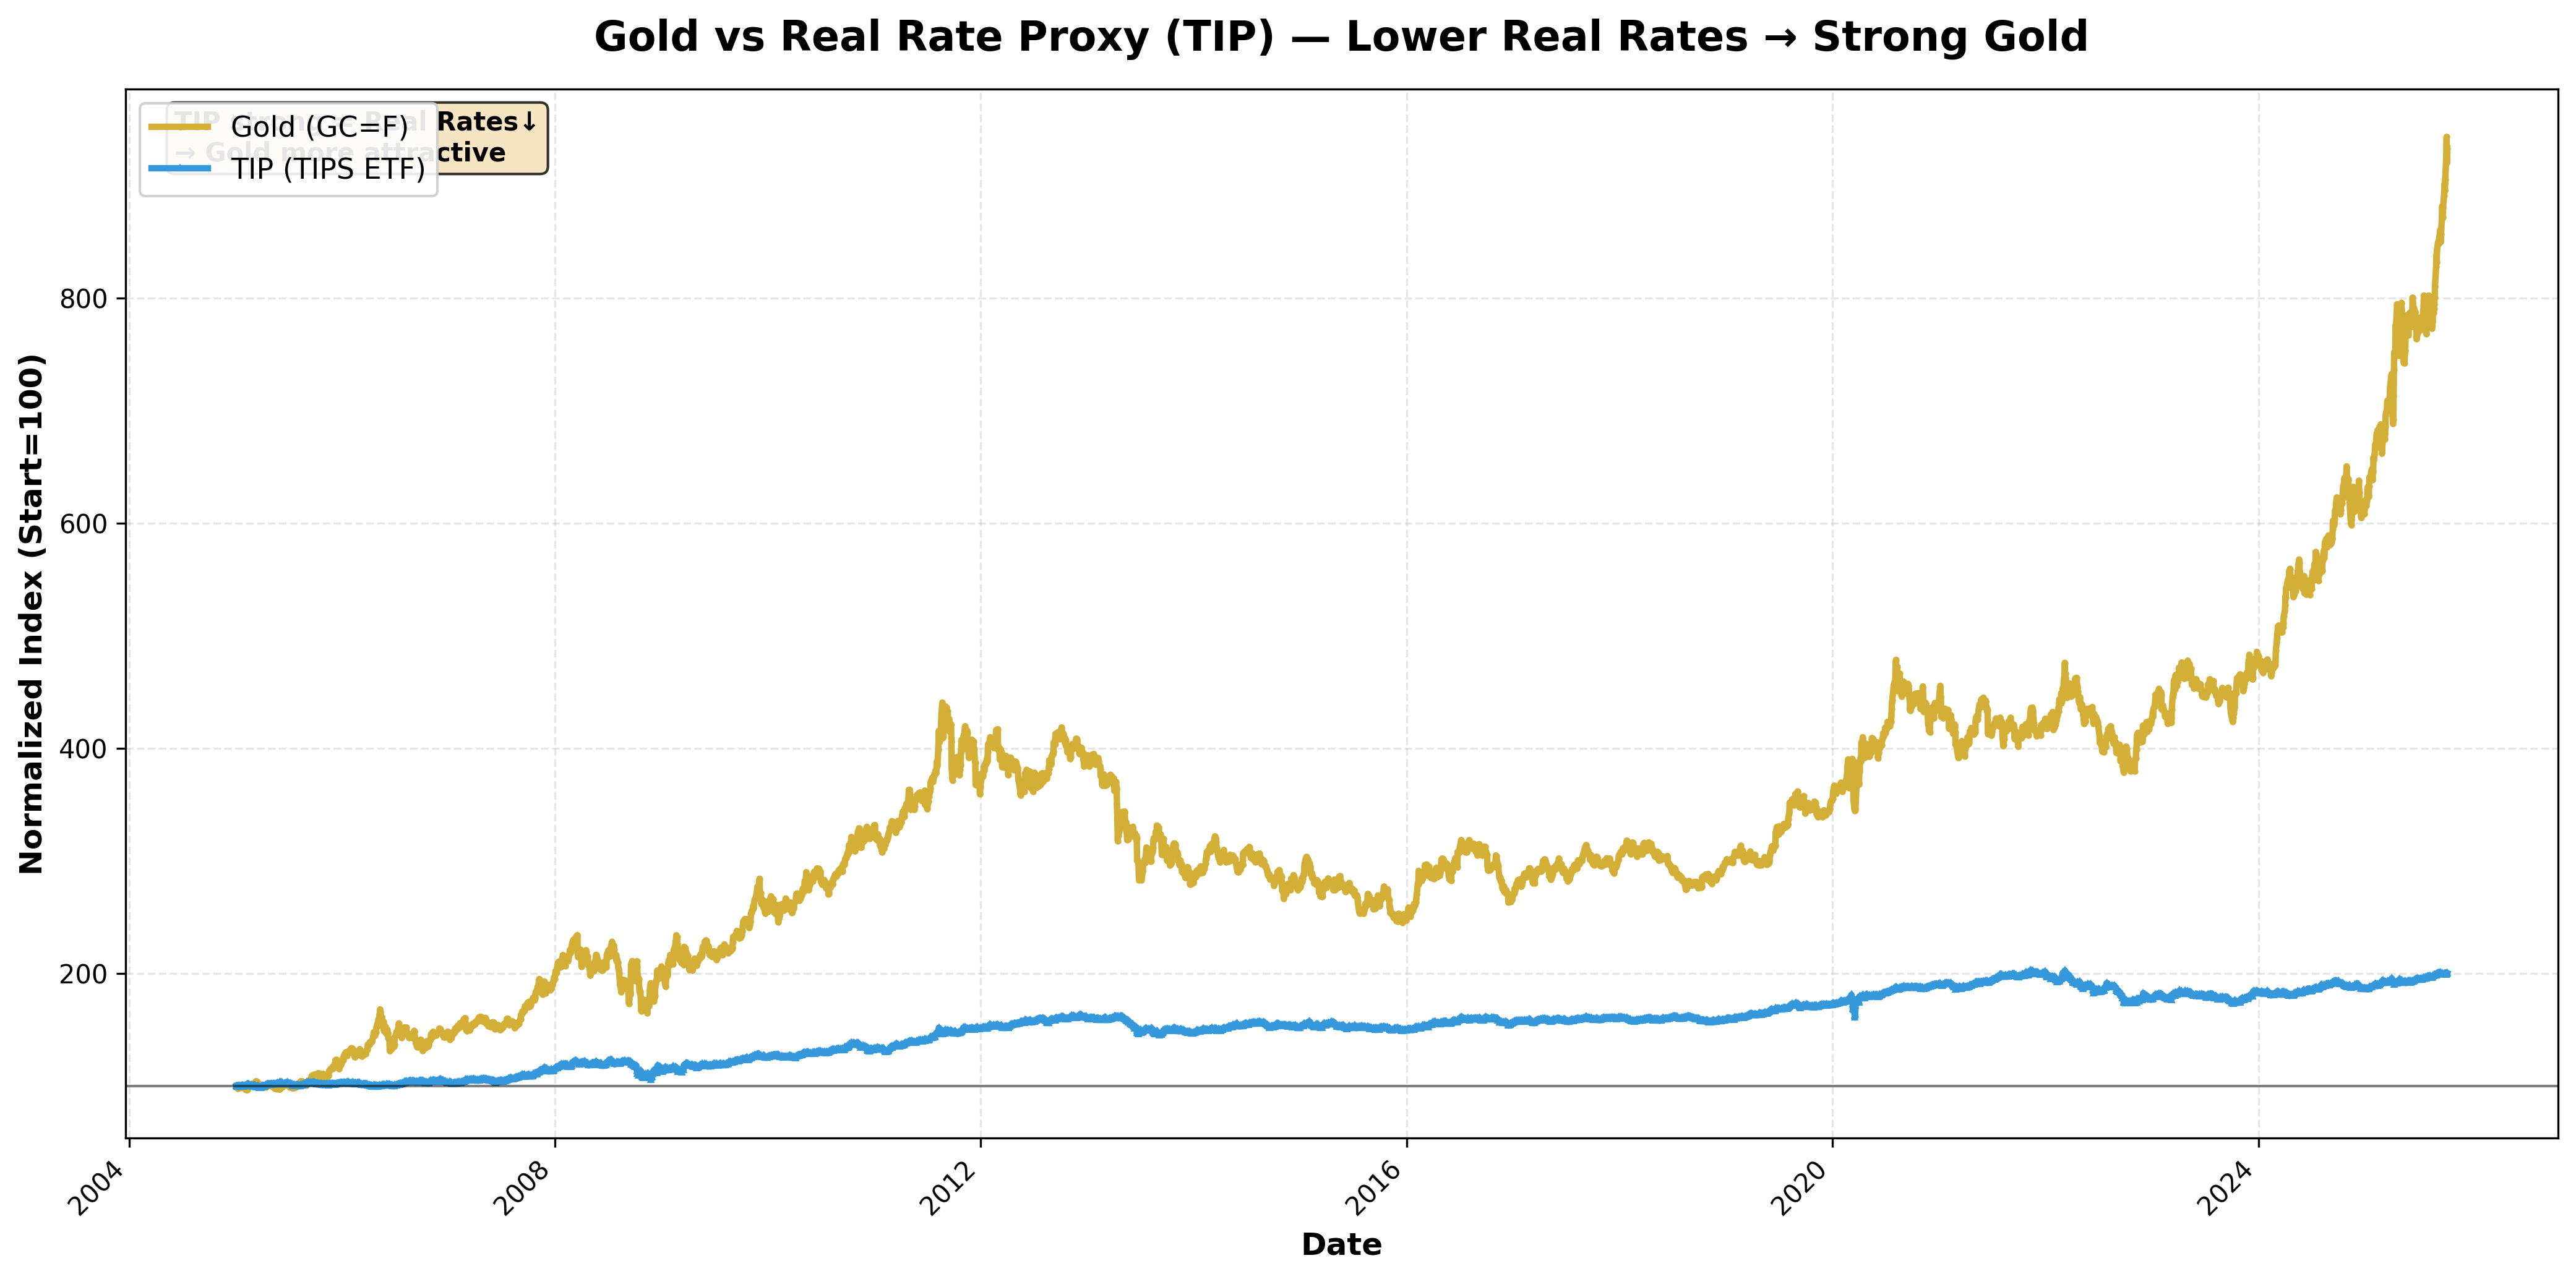
The first needle is real interest rates. In textbook terms, it's "nominal rates minus inflation expectations," but more simply, it's what you actually earn after inflation. The smaller this becomes (real rates ↓), the more attractive gold looks. Since gold pays no interest, it starts to feel like "a safer vault with similar returns." Conversely, when real rates rise (↑), gold's appeal diminishes.
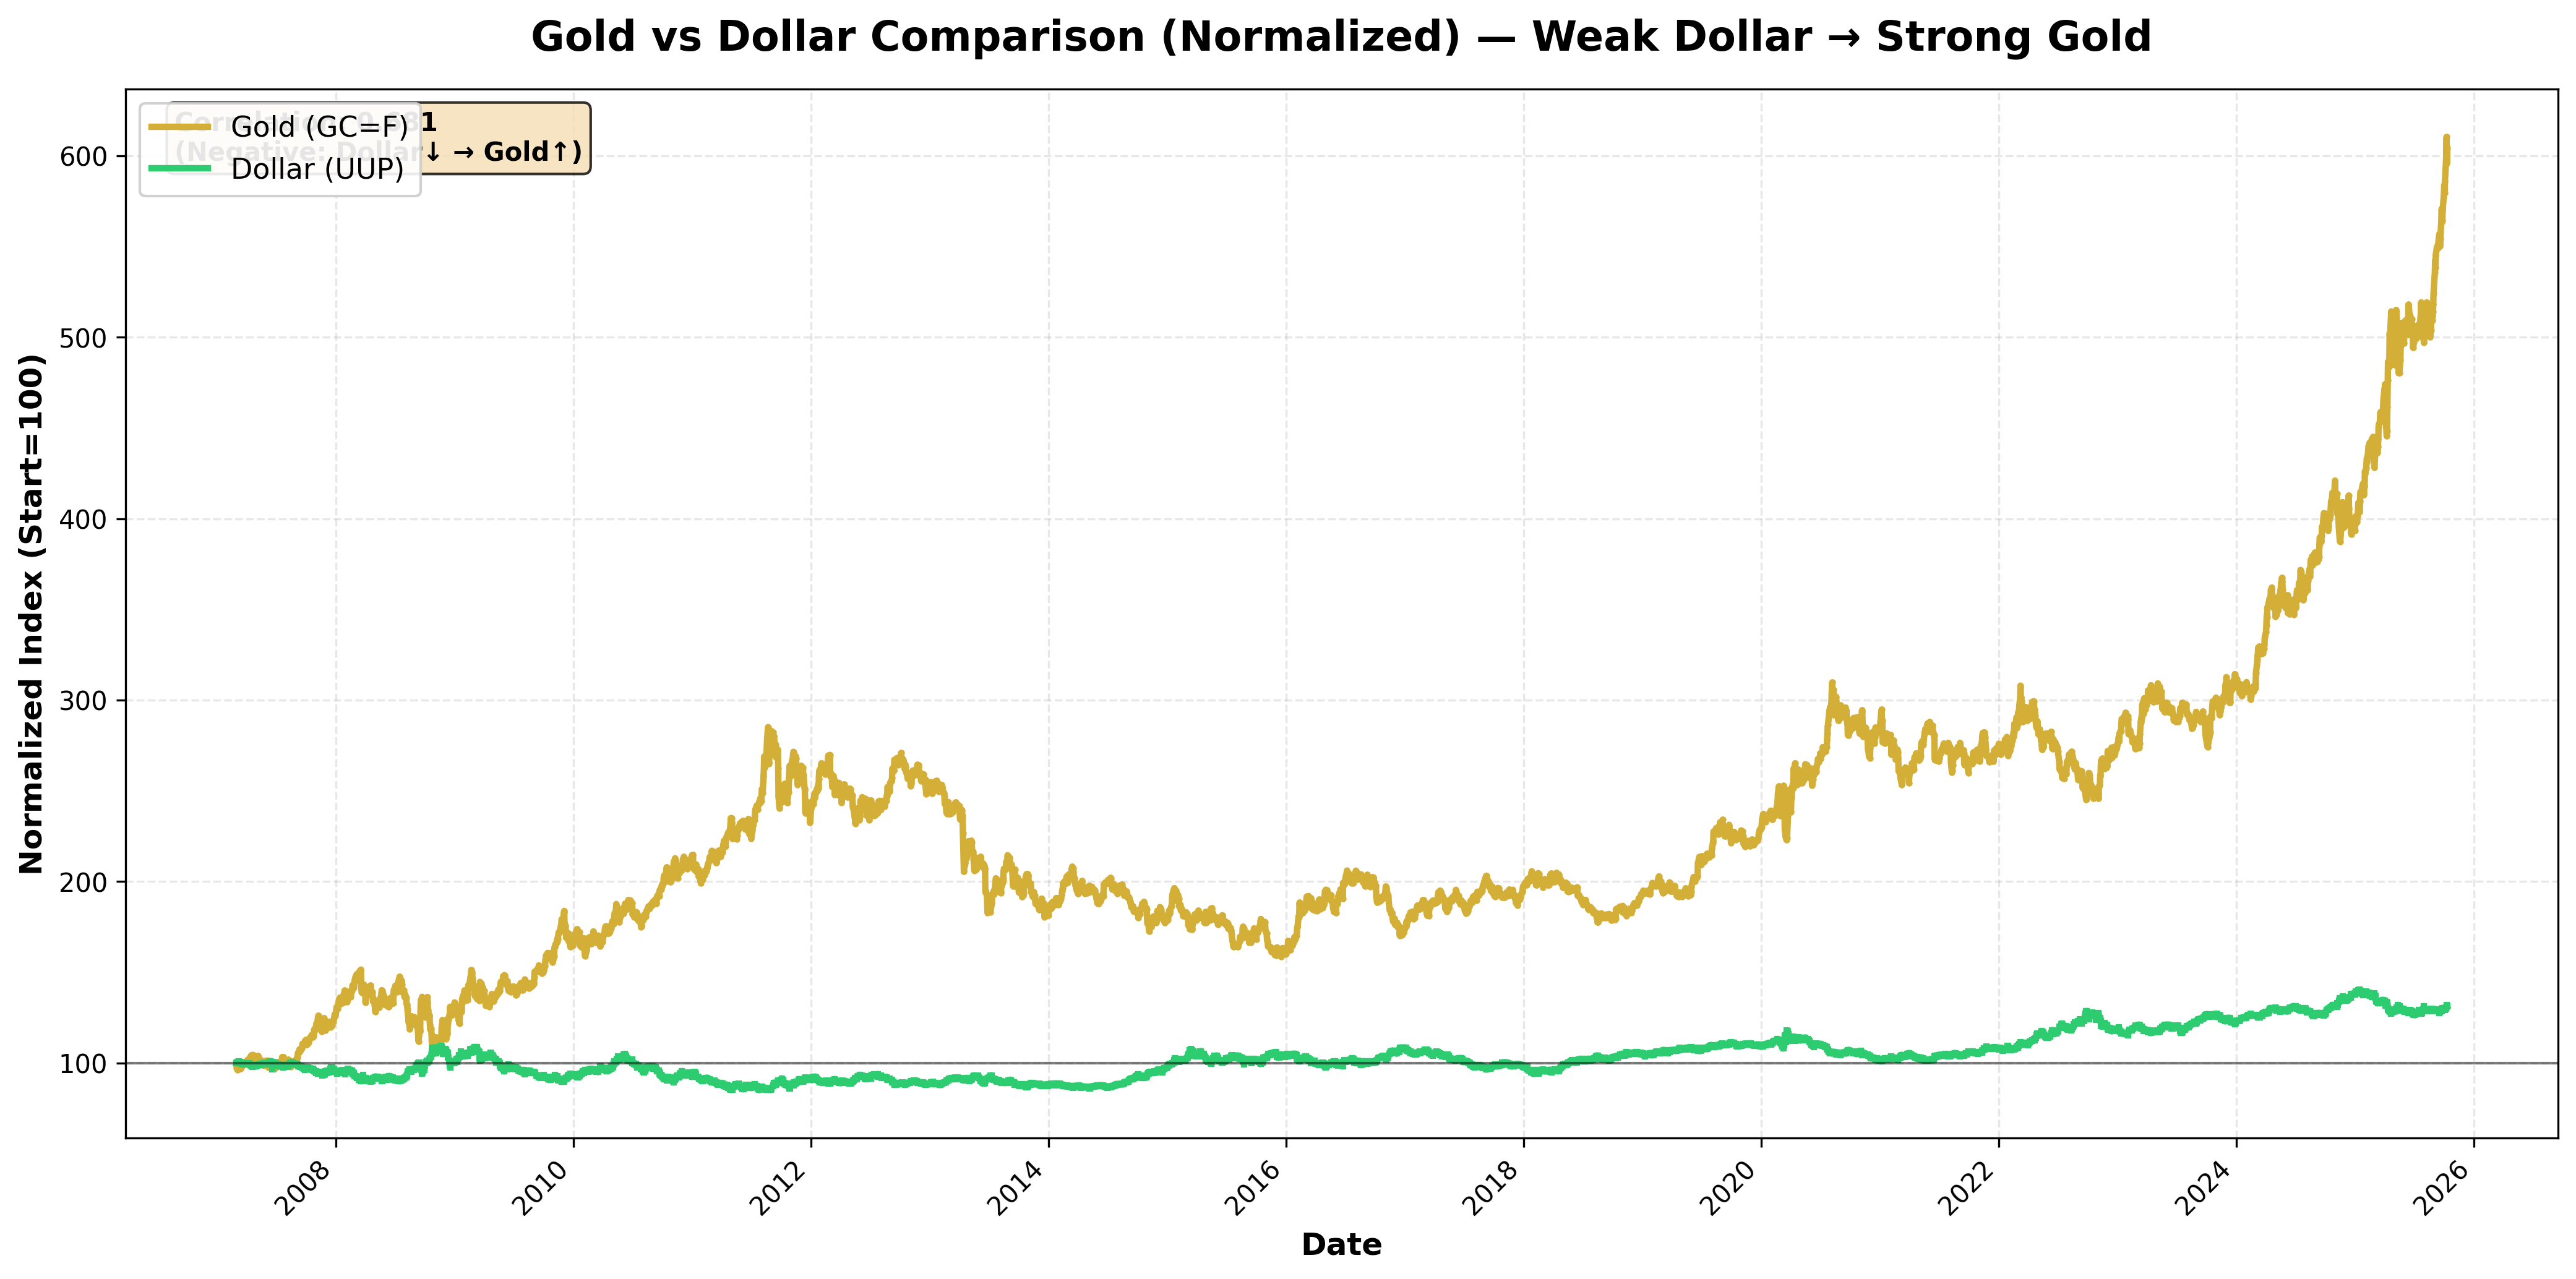
The second needle is dollar strength. Since gold is priced in dollars, when the dollar is strong, gold becomes more expensive for the rest of the world (demand ↓). When the dollar is weak, the opposite happens (demand ↑). However, during major crises, there's an exception. The desire to hold both "cash (dollars)" and "insurance (gold)" simultaneously can push both assets higher.
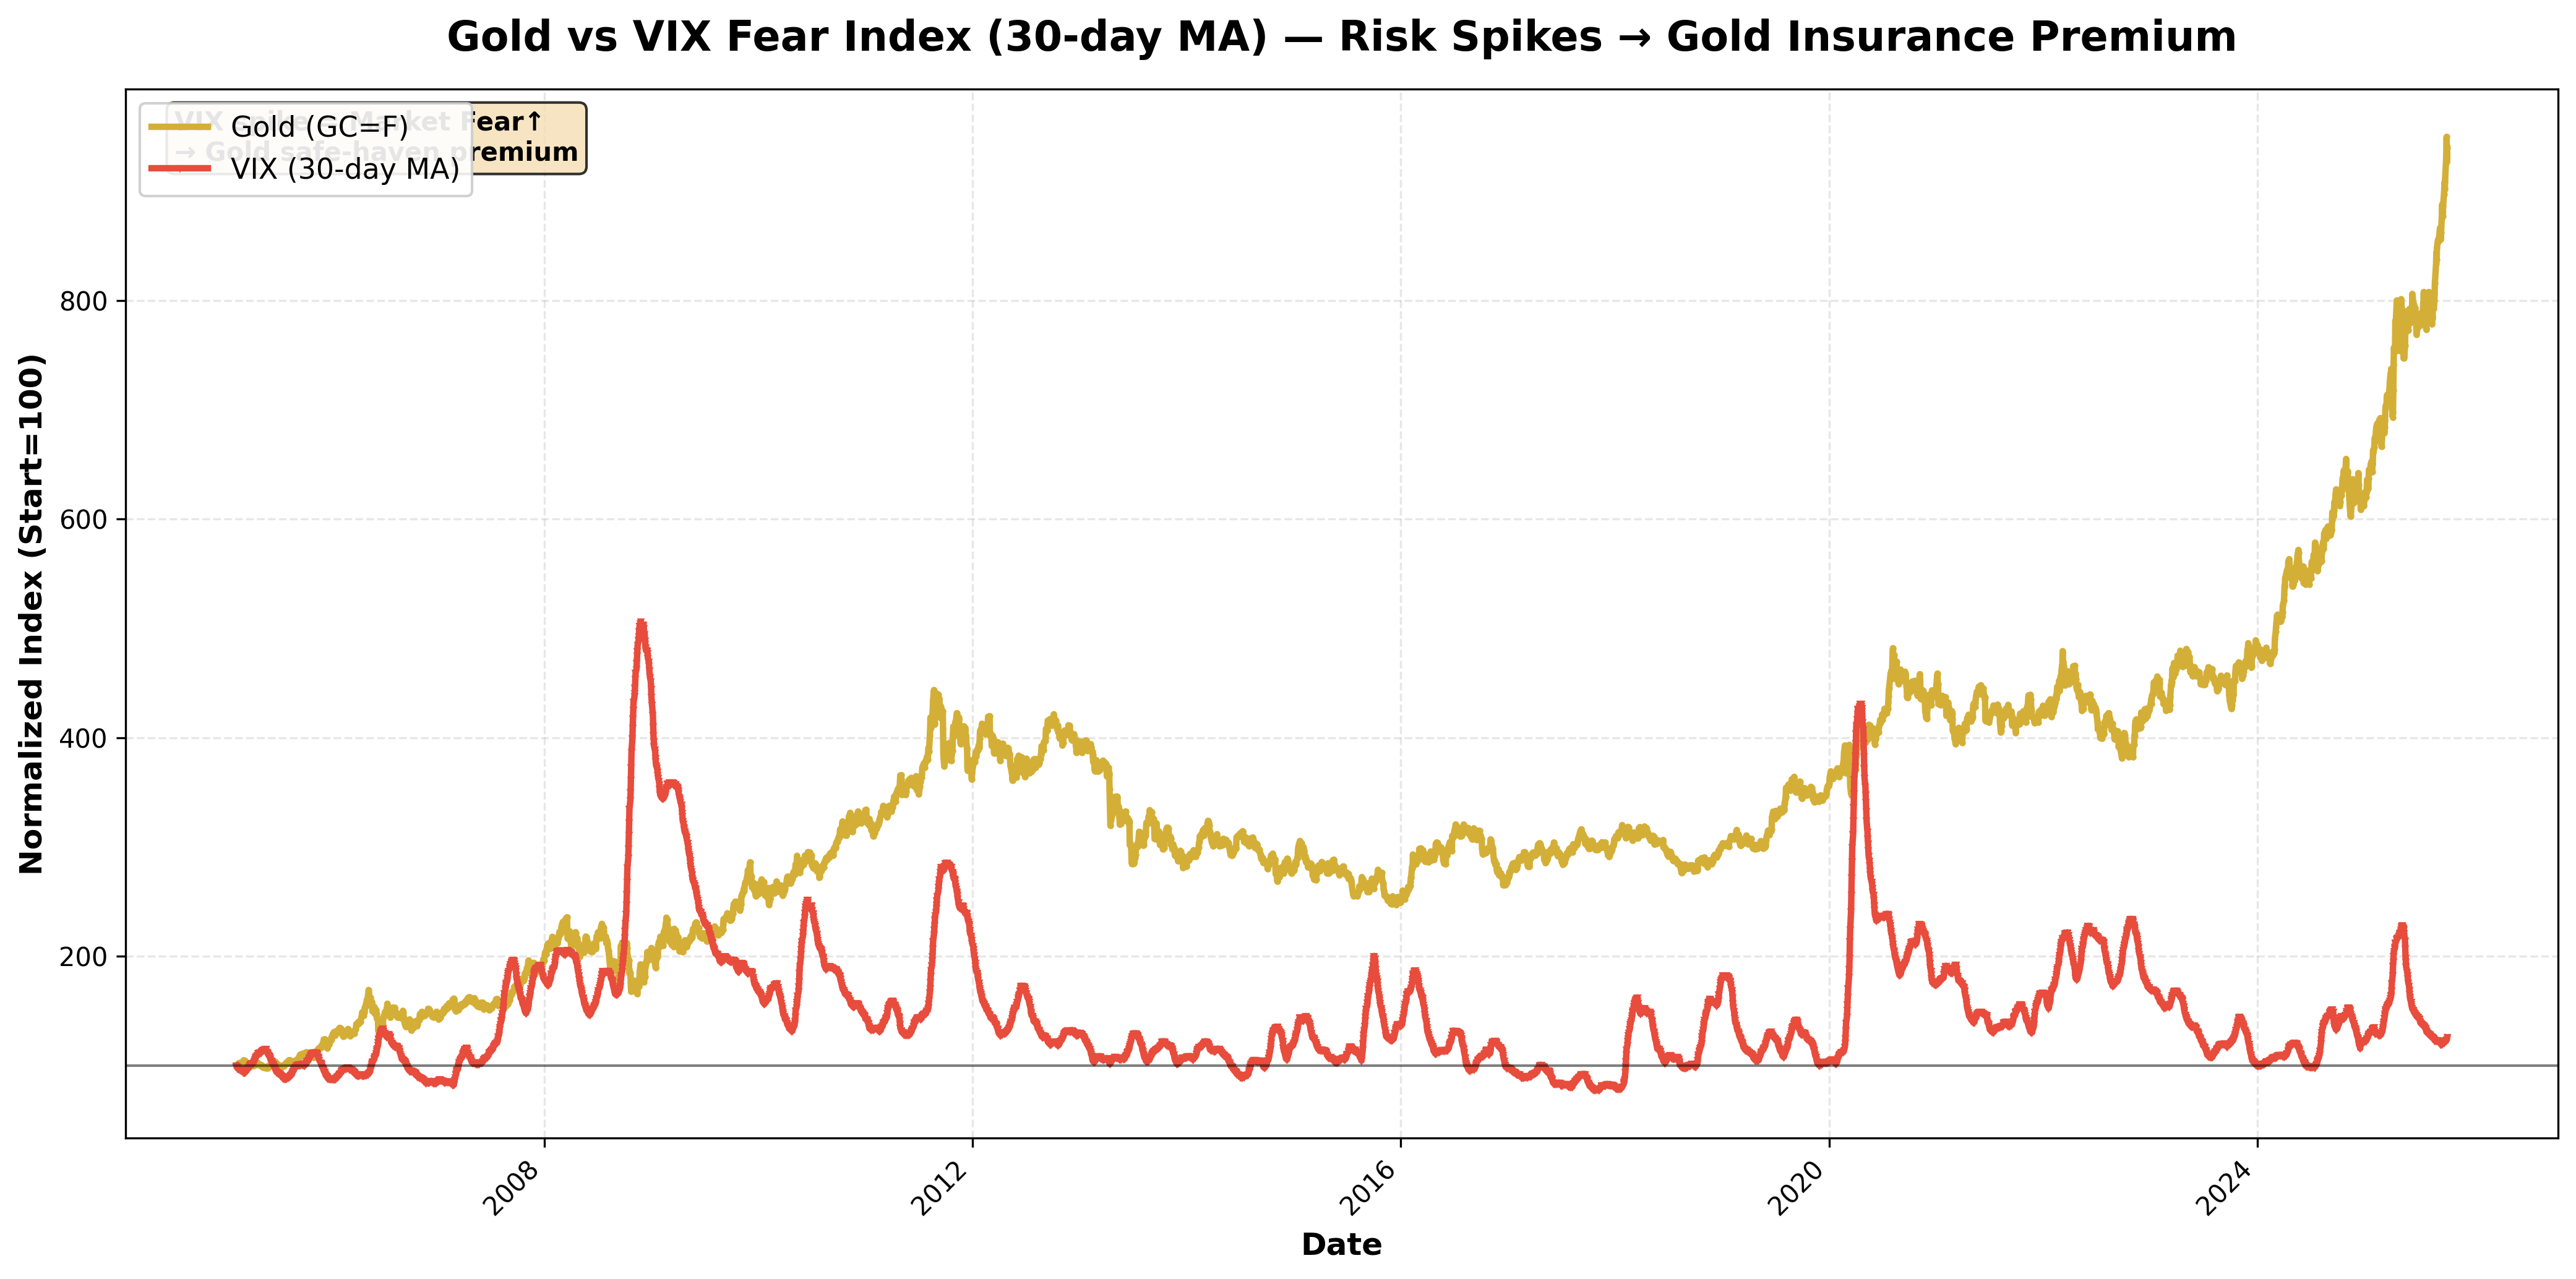
These two needles set gold's major direction, while risk (wars, financial instability), inflation surprises, central bank buying, and fast money flows (like ETF inflows/outflows) act as the accelerator and brake.
2. 20-Year Timeline—Following the Scene Changes
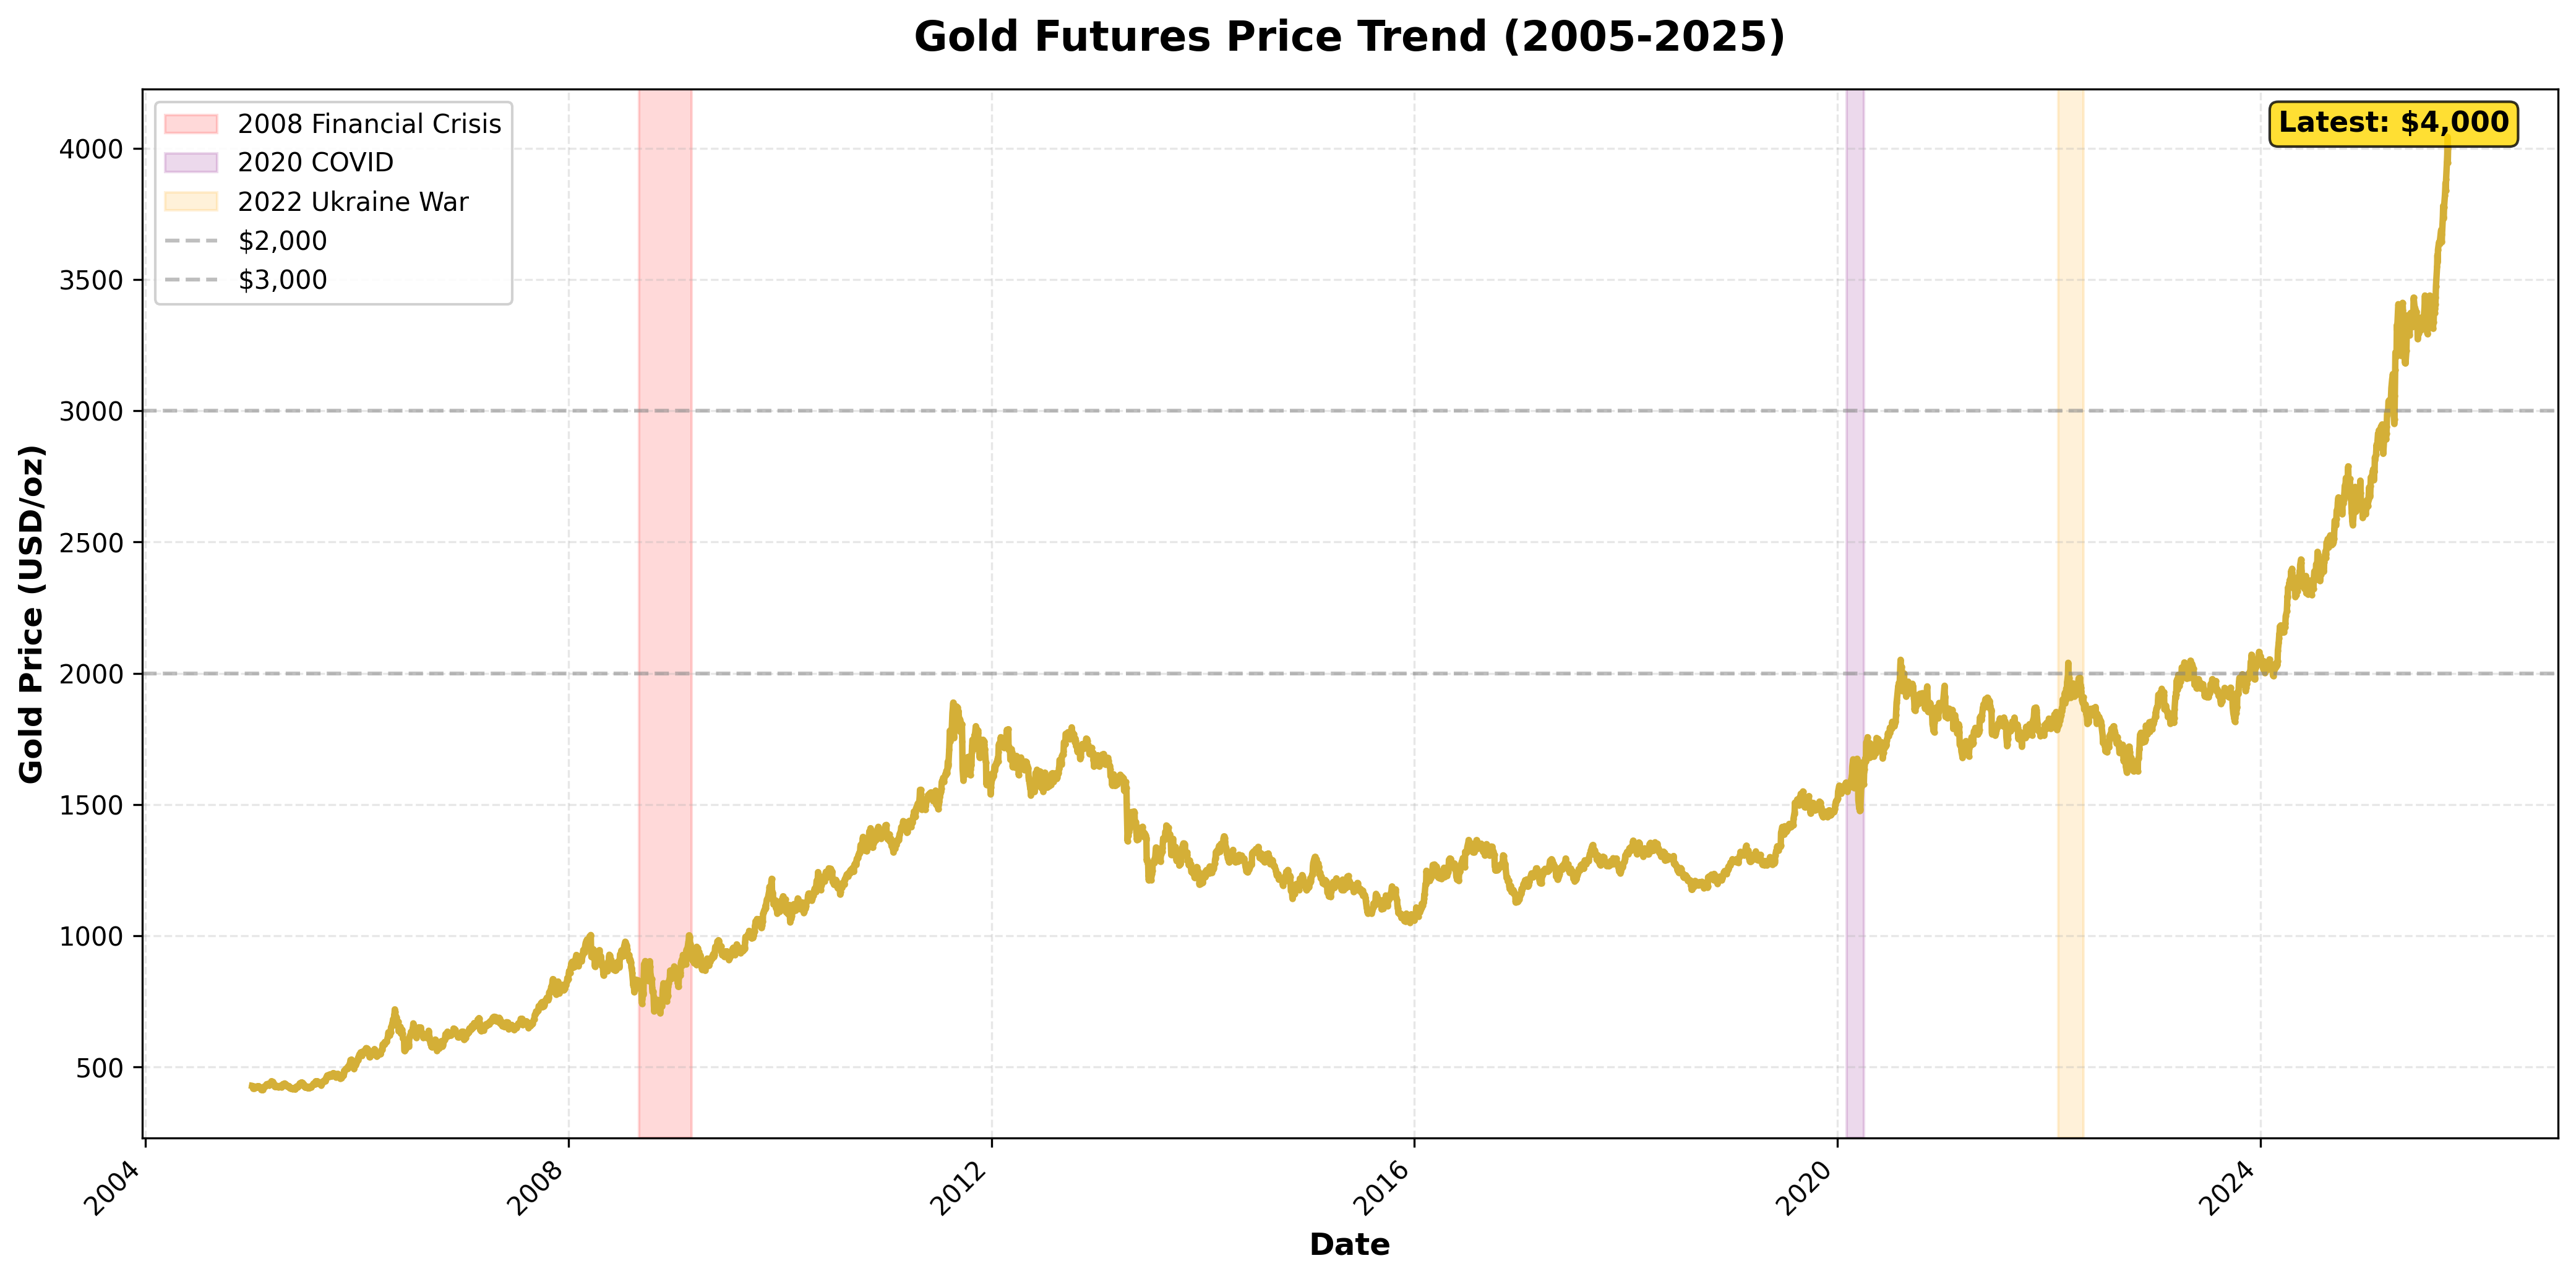
2005–2007: "The Door Opens"
This period saw a new landscape forming. Commodities were broadly strong, and the dollar was weak. As portfolio diversification into gold gained momentum, gold broke out of its long-term range. Real rates weren't high and the dollar was weak—both needles favored gold.
2008–2011: "Crisis Era, Gold as Refuge"
When the financial crisis hit, the world pivoted sharply to zero rates and quantitative easing. Real rates plunged, and systemic risk surged. People thought, "even if everything else fails, gold remains gold." Safe-haven demand exploded, pushing gold to then-record highs (around $1,920). This was the textbook combination: low real rates + weak dollar + heightened fear.
2013: "Flipped in One Word—Taper"
When the Fed signaled tapering, markets calculated instantly: "interest-bearing assets will be more attractive going forward." Gold posted a painful –28% annual return. Real rates lifted and the dollar strengthened, triggering massive redemptions from gold ETFs. Both needles moved against gold simultaneously—a classic reversal scene.
2014–2018: "Long Consolidation"
This period was less like a rollercoaster and more like a seesaw. As the U.S. economy recovered and rate hikes continued, real rates trended upward, yet intermittent geopolitical issues sparked brief safe-haven demand. Gold was pressed down when the dollar strengthened and bounced when anxiety grew—pendulum motion within a range rather than a strong trend.
2020: "Pandemic, Real Rates Near Zero"
When COVID-19 brought the world to a halt, nations pivoted back to ultra-loose policy. Real rates hit near-zero, while anxiety peaked. Additionally, the dollar weakened for a while. Gold finally breached the $2,000 barrier. This was another textbook bull case: rates ↓ + dollar ↓ + fear ↑.
2022: "War, High Inflation, and Central Banks"
Russia-Ukraine conflict combined with high inflation reignited safe-haven demand. But this cycle had a key difference: central banks became serious net buyers. Driven by reserve diversification away from dollar dominance and sanctions risk awareness, these slow but heavy hands provided firm support for gold's floor. Even if prices wobbled short-term, the floor kept rising—this was the effect.
2023–Early 2025: "Staircase to New Highs"
As inflation showed signs of cooling, markets asked the next question: "when will rate cuts begin?" As these expectations grew, the path forward for real rates tilted downward again, and central bank buying continued. Whenever ETF inflows joined in, gold climbed step by step to new all-time highs.
2025: "Touching $4,000—Gold FOMO"
With political and geopolitical uncertainty rising, easing expectations lingering, and the dollar weakening at the right moment, markets flipped the final switch: "can't miss this (FOMO)." Gold crossed $4,000 for the first time. Of course, those days are volatile, with quick profit-taking. But the big picture was clear: real rates and the dollar (two needles) + fear and official demand (two hands) all pushed in the same direction.
3. How to Navigate These Scenes—A Thinking Framework
When reading the news, ask yourself these questions:
-
Where are real rates heading? If TIPS yields (the main proxy for real rates) are falling, gold likely has wind at its back.
-
Is the dollar strengthening or weakening? A weak dollar boosts foreign demand, while a strong dollar tends to pressure gold.
-
Has risk increased or decreased? If headlines feature war, sanctions, or financial instability, gold gets a short-term "insurance premium."
-
Where is the money flowing (in or out)? ETF inflows (like GLD) tend to strengthen trends, while large redemptions can reverse them.
-
Are central banks still buying? This is the force that slowly lifts gold's floor. It may not move prices today, but it changes tomorrow's support levels.
4. Finally, A One-Page Memory Aid
- Gold's direction is set by two needles (real rates · dollar),
- Two hands (fear and official demand) provide acceleration and support,
- And investment flows (ETF inflows/outflows) create short-term waves.
Through this lens, the 2011 peak, 2013 crash, 2020 comeback, and 2025 record highs all summarize into one sentence: "Where did real rates and the dollar point, and which way were people's emotions (risk) and big hands (central banks) leaning?"
Comments (0)
No comments yet. Be the first to comment!