The Contrarian Value Creator Index: A Fresh Perspective on Financial Performance
Welcome to our exploration of the Contrarian Value Creator Index—a unique approach to identifying potential opportunities in today's market. This isn't your typical financial ranking; it deliberately looks for companies with characteristics that might make traditional investors hesitate. Think of it as searching for diamonds in the rough—businesses facing challenges but showing promising signs of adaptation and recovery.
What Makes This Index Different?
Most financial analyses focus on companies with strong growth, low debt, and rising stock prices. Our Contrarian Value Creator Index takes the opposite approach. We're looking at four specific metrics that, when combined, might identify overlooked companies with potential for future improvement:
- Low or Negative Revenue Growth: Companies experiencing business challenges
- Higher Debt-to-Equity Ratio: Companies using financial leverage
- Improving Free Cash Flow: Despite challenges, showing better operational efficiency
- Significant Price Drops (over 2 years): Currently out of favor with investors
Understanding the Scoring System
Each company receives a score from 0-250 points for each of our four metrics, creating a maximum possible score of 1000. Let's break down what each metric means and how it's scored:
1. Revenue Growth (Lower is Better)
This measures the year-over-year percentage change in a company's revenue. Unlike traditional analyses, our index gives HIGHER scores to companies with LOWER growth rates. Why? Companies with declining revenue often face significant challenges, but if they're simultaneously improving other aspects of their business (like cash flow), they might be restructuring for future success.
2. Debt-to-Equity Ratio (Higher is Better)
The debt-to-equity (D/E) ratio shows how much debt a company uses compared to its equity (shareholder value). It's calculated by dividing total debt by total shareholder equity. Our index rewards companies with higher D/E ratios, suggesting they're using financial leverage strategically. While excessive debt can be risky, reasonable leverage can amplify returns when a business turns around.
3. Free Cash Flow Growth (Higher is Better)
Free cash flow (FCF) represents the cash a company generates after accounting for capital expenditures. It shows how much money is available for debt reduction, dividends, or reinvestment. Our index gives higher scores to companies showing FCF growth, even if their revenue is declining. This suggests they're becoming more efficient with the revenue they do have—potentially cutting costs, optimizing operations, or shifting business models.
4. Two-Year Price Change (Lower is Better)
This measures how much a company's stock price has changed over the past two years. In our contrarian approach, companies with significant price drops receive higher scores. Why? When investors lose confidence in a company, its stock price often falls below its intrinsic value. If that company is simultaneously improving its operations (shown by better cash flow), it might represent an opportunity the market hasn't yet recognized.
Top Performers: A Closer Look
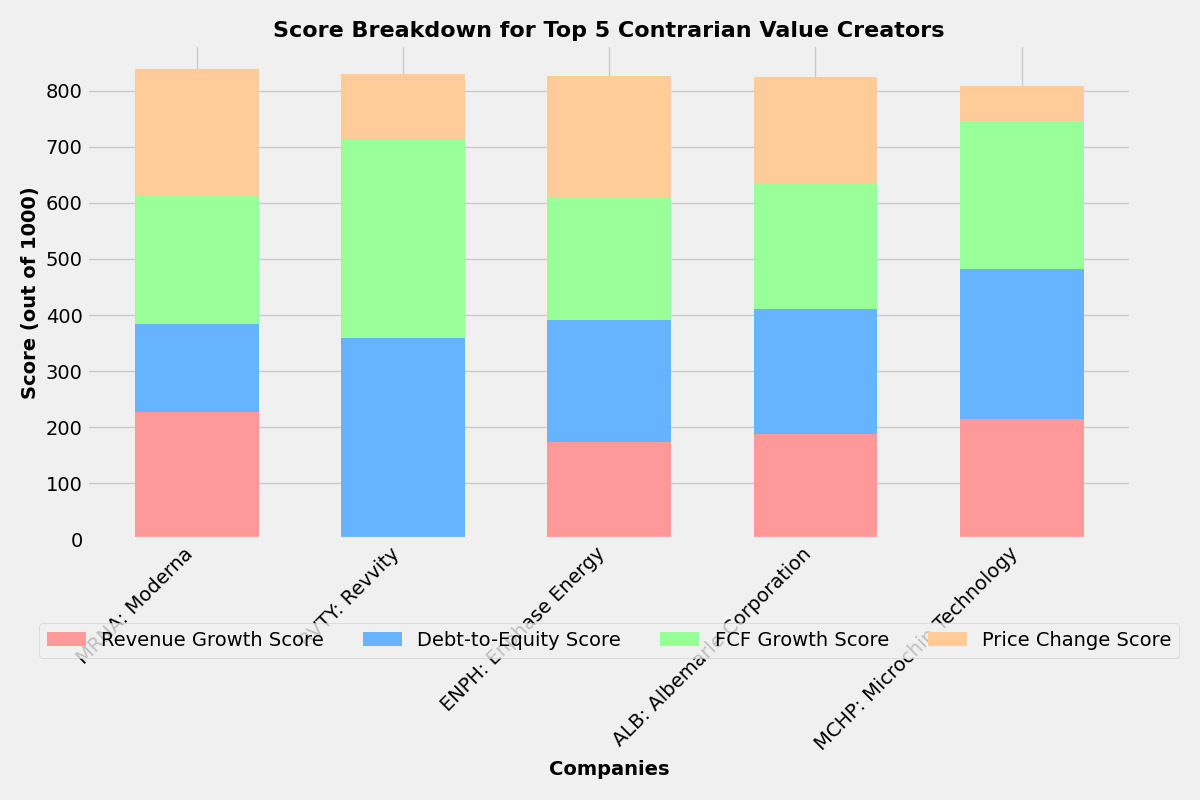
Let's examine some of the standout companies in our index, starting with Moderna (MRNA), which topped our ranking with an impressive score of 839 out of 1000.
Moderna (MRNA): The Perfect Contrarian Profile
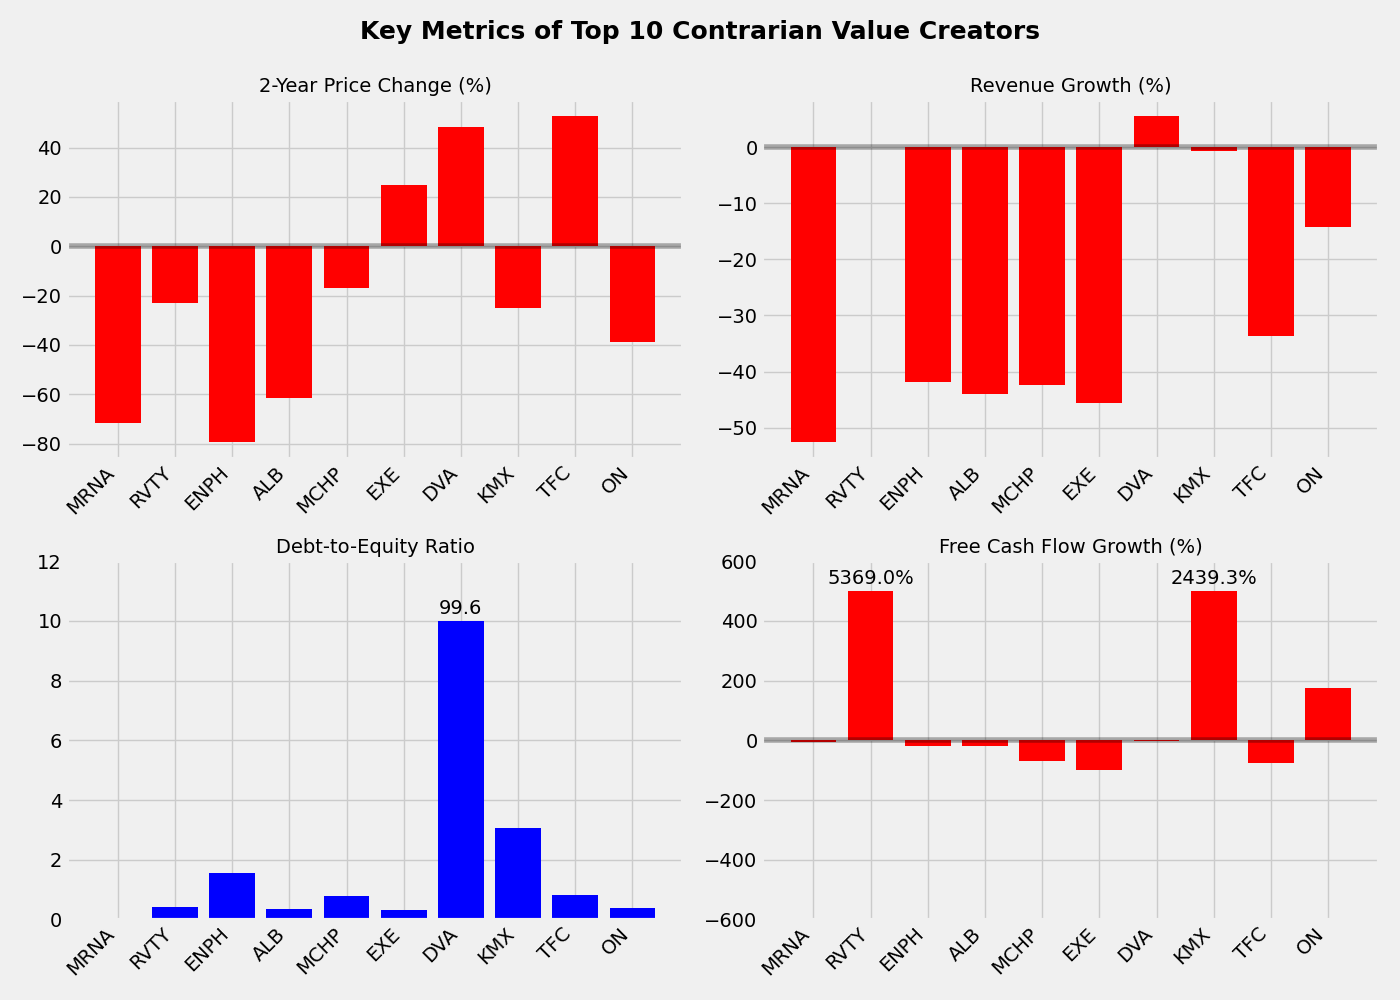
Moderna exemplifies the contrarian profile we're looking for. Its revenue declined by 52.64% year-over-year—from $6.75 billion to $3.20 billion—earning it a perfect 250/250 points in that category. This decline reflects the post-pandemic drop in COVID-19 vaccine demand. Meanwhile, the company maintains a modest debt-to-equity ratio of 0.07, suggesting it's not overleveraged despite challenges. While its free cash flow is declining (-6.01%), it's doing so at a much slower rate than revenue, indicating better operational efficiency. Finally, Moderna's stock has dropped 71.82% over the past two years, reflecting strong investor pessimism—but possibly creating an opportunity if the company's fundamentals improve.
Other Notable Contrarian Value Creators
Revvity (RVTY) earned the second-highest score of 829, primarily due to its extraordinary 5,369% growth in free cash flow despite nearly flat revenue growth (0.16%). This suggests a dramatic improvement in operational efficiency. Enphase Energy (ENPH) experienced both declining revenue (-41.92%) and a substantial stock price drop (-79.48%), but maintains strategic leverage with a debt-to-equity ratio of 1.57. Albemarle Corporation (ALB) shows a similar profile, with significant revenue decline (-44.08%) and price drop (-61.39%), yet demonstrates relatively controlled free cash flow decline (-19.39%).
Understanding the Relationships Between Metrics
The fascinating aspect of our Contrarian Value Creator Index is how these seemingly negative metrics combine to potentially identify companies in transition. The visualization below maps the relationship between price change and revenue growth, with bubble size representing debt-to-equity ratio and color intensity showing total score.
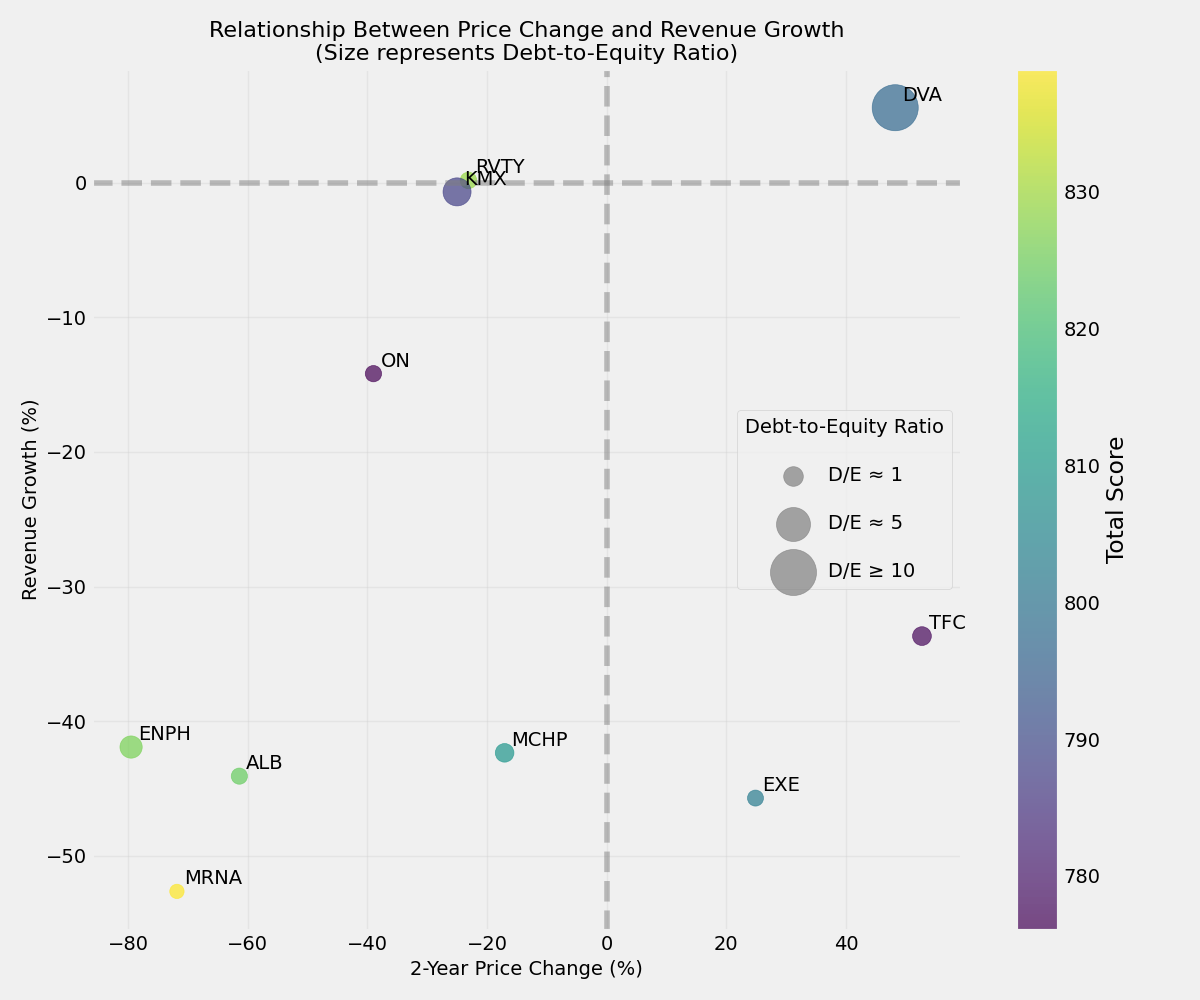
Notice how most top-performing companies cluster in the lower-left quadrant—negative price change and negative revenue growth. This visual reinforces our contrarian approach: we're identifying companies facing challenges (declining revenue and stock prices) but potentially positioning for recovery through improved operational efficiency.
What This Means for Interested Observers
The Contrarian Value Creator Index offers a fresh lens through which to view company performance. Rather than focusing solely on growth metrics, this approach considers how companies navigate challenges and potentially position themselves for future improvements. These companies might be restructuring their operations, pivoting their business models, or simply becoming more efficient with available resources.
It's important to note that this index doesn't provide investment recommendations. Instead, it highlights an interesting segment of the market that exhibits paradoxical financial characteristics. Understanding these patterns can help develop a more nuanced view of corporate performance beyond simplistic growth metrics.
Conclusion: The Value of Contrarian Thinking
In a market often fixated on growth at all costs, our Contrarian Value Creator Index reminds us that corporate performance is multifaceted. Companies facing revenue challenges aren't necessarily failing—they may be transforming. Those with strategic debt aren't always risky—they may be positioning for future opportunities. And those out of favor with investors today might be overlooked opportunities for tomorrow.
By examining these counter-intuitive combinations of metrics, we gain insights into how businesses navigate difficult transitions and potentially emerge stronger. While traditional growth metrics will always have their place, this contrarian approach offers a valuable complementary perspective on corporate performance and adaptation in a complex economic environment.
Comments (0)
No comments yet. Be the first to comment!