Introduction: The Quest for True Value in Stock Investing
In a market often driven by sentiment and momentum, finding a stock's 'true value' can feel like searching for buried treasure without a map. While price charts and technical indicators might tell you where a stock has been, they offer little insight into what it's actually worth. This is where fundamental valuation methods become essential tools in an investor's arsenal.
Among these methods, Discounted Cash Flow (DCF) analysis stands out as a powerful approach that cuts through market noise to focus on what truly matters: a company's ability to generate cash for its shareholders over time. Unlike ratio-based methods that compare a stock to its peers or historical averages, DCF attempts to calculate an absolute intrinsic value based on projected future cash flows.
In this blog, we'll dive deep into DCF analysis using real market data from nine companies across three sectors: Technology (Apple, Microsoft, Google), Consumer Goods (Procter & Gamble, Coca-Cola, Walmart), and Utilities (NextEra Energy, Duke Energy, Southern Company). We'll explore how DCF models work, their strengths and weaknesses, and what they tell us about current market valuations.
What is Discounted Cash Flow (DCF) Analysis?
At its core, DCF analysis is based on a simple principle: a dollar today is worth more than a dollar tomorrow. This concept, known as the time value of money, forms the foundation of DCF valuation.
The DCF model estimates a company's intrinsic value by projecting its future free cash flows (FCF) and then discounting them back to present value using an appropriate discount rate. The formula looks like this:
DCF = ∑ (Free Cash Flow_t / (1 + r)^t), where t = year and r = discount rate.
In practice, DCF models typically use a two-stage approach:
- Projection Period: Detailed forecasts of free cash flows for 5-10 years
- Terminal Value: A single value representing all cash flows beyond the projection period, usually calculated using the Gordon Growth Model: Terminal Value = FCF_n × (1 + g) / (r - g), where g is the perpetual growth rate
The sum of these discounted cash flows and the discounted terminal value gives us the estimated intrinsic value of the company. Dividing by the number of outstanding shares provides the intrinsic value per share, which we can compare to the current market price.
Why Use DCF? Strengths and Weaknesses
Strengths of DCF Analysis
- Focuses on cash generation, not accounting profits
- Considers the time value of money
- Provides an absolute valuation rather than a relative one
- Forces investors to think long-term
- Less influenced by market sentiment and short-term fluctuations
Weaknesses of DCF Analysis
- Highly sensitive to input assumptions
- Requires forecasting cash flows far into the future
- Terminal value often dominates the calculation
- Difficult to apply to early-stage companies with negative cash flows
- Can give a false sense of precision
Our analysis of nine companies across three sectors demonstrates these strengths and weaknesses in action. As we'll see, small changes in assumptions can lead to dramatically different valuations, highlighting the importance of sensitivity analysis in DCF modeling.
Data Collection and Model Assumptions
For our DCF analysis, we collected data for nine companies across three sectors: Technology (Apple, Microsoft, Google), Consumer Goods (Procter & Gamble, Coca-Cola, Walmart), and Utilities (NextEra Energy, Duke Energy, Southern Company). We used the following data sources and assumptions:
Data Sources
- Historical price data: Tiingo API
- Financial statements: yfinance API
- Free Cash Flow data: Calculated from cash flow statements
Model Assumptions
- Projection period: 5 years
- Discount rate: 10% for all companies
- Terminal growth rate: 2% for all companies
- Growth rates: Based on historical FCF growth, capped between 2% and 15%
These assumptions represent a balance between company-specific factors and broader economic considerations. The 10% discount rate approximates the weighted average cost of capital (WACC) for large, established companies, while the 2% terminal growth rate aligns with long-term inflation and GDP growth expectations.
Historical Free Cash Flow Analysis
Before projecting future cash flows, we analyzed historical Free Cash Flow (FCF) trends for each company. FCF represents the cash a company generates after accounting for capital expenditures and is a crucial input for DCF analysis.
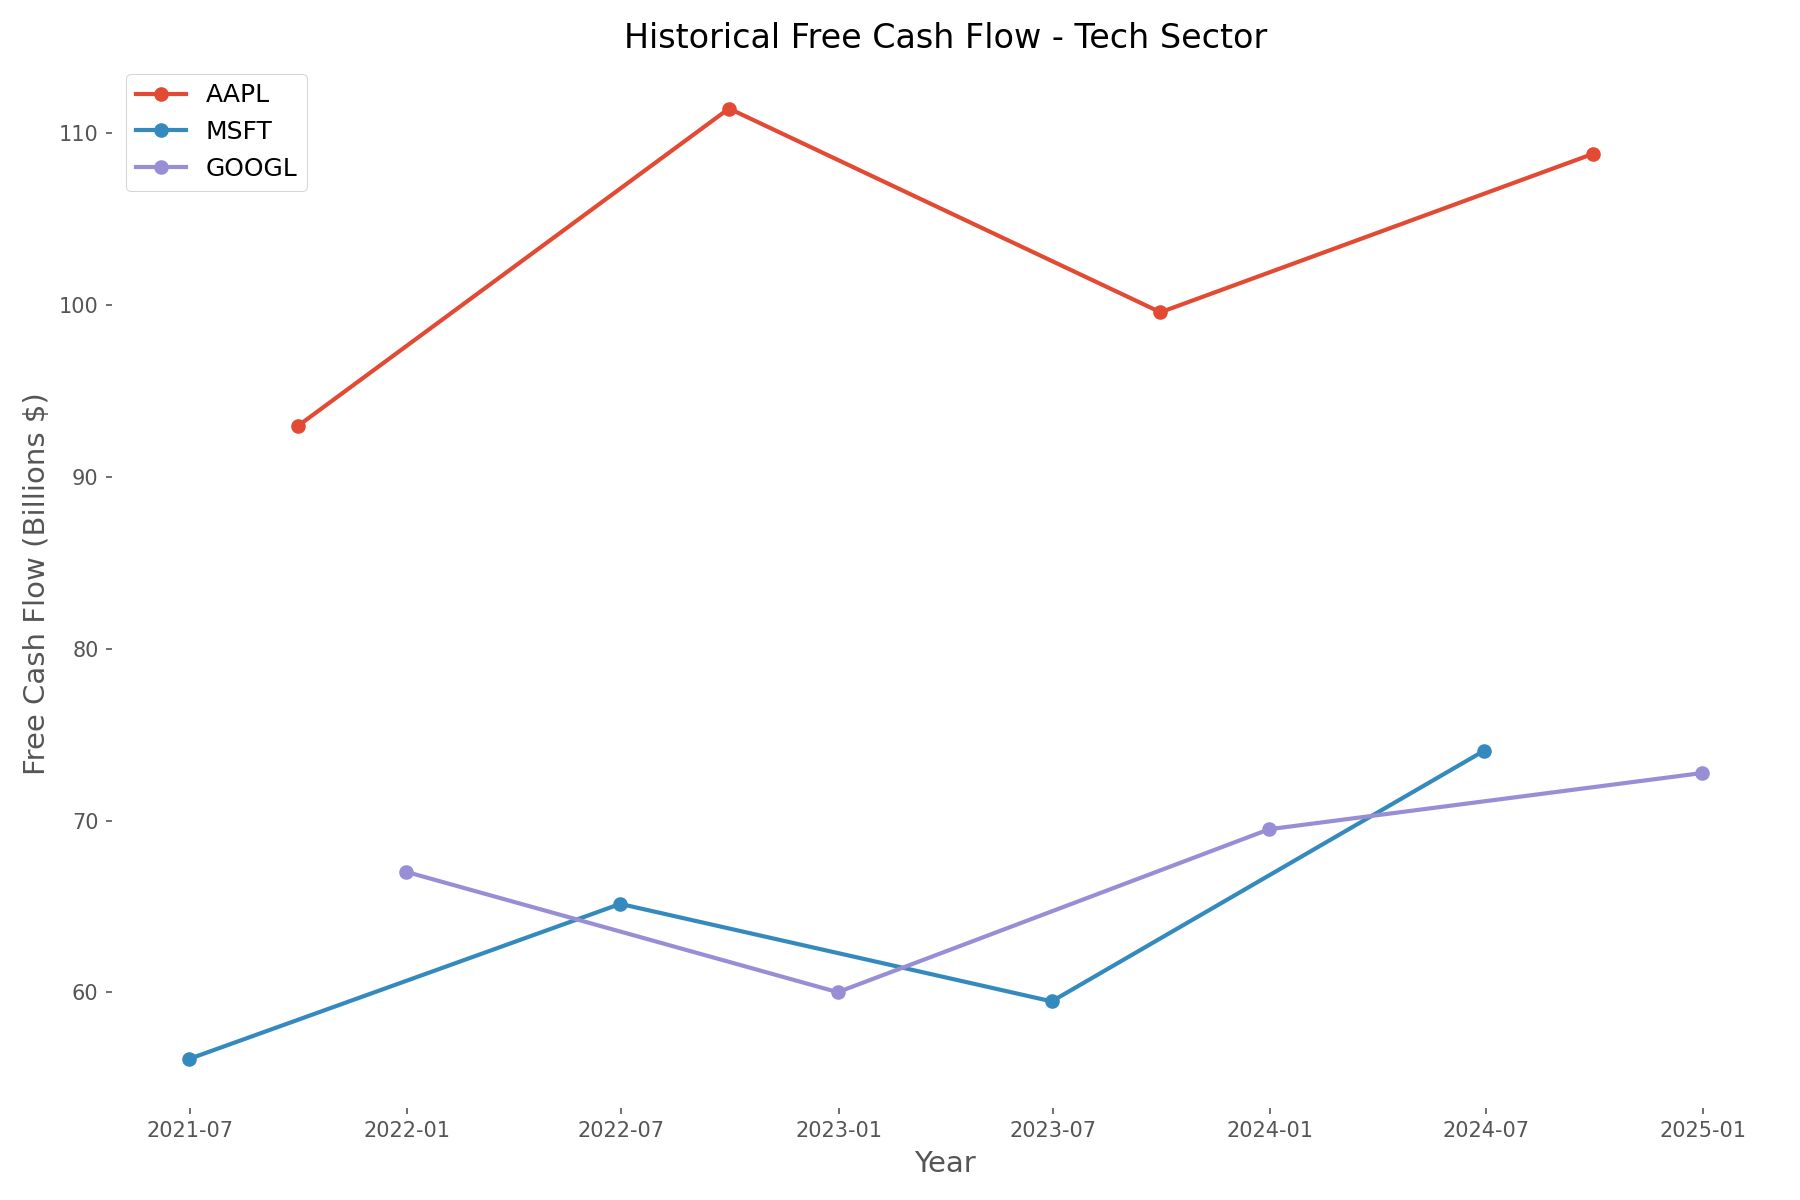
The chart above reveals several key insights about tech companies' cash flow generation:
- Apple shows the strongest FCF generation, reaching over $100 billion annually
- Microsoft demonstrates steady growth in FCF over the period
- Google (Alphabet) shows more volatility but maintains an upward trend
This strong cash flow generation explains why tech companies command premium valuations in the market. However, the question remains: Are these valuations justified by future cash flow potential?
DCF Model Results and Valuation Comparison
After implementing our DCF model with the assumptions outlined above, we compared the resulting intrinsic values with current market prices. The results were revealing:
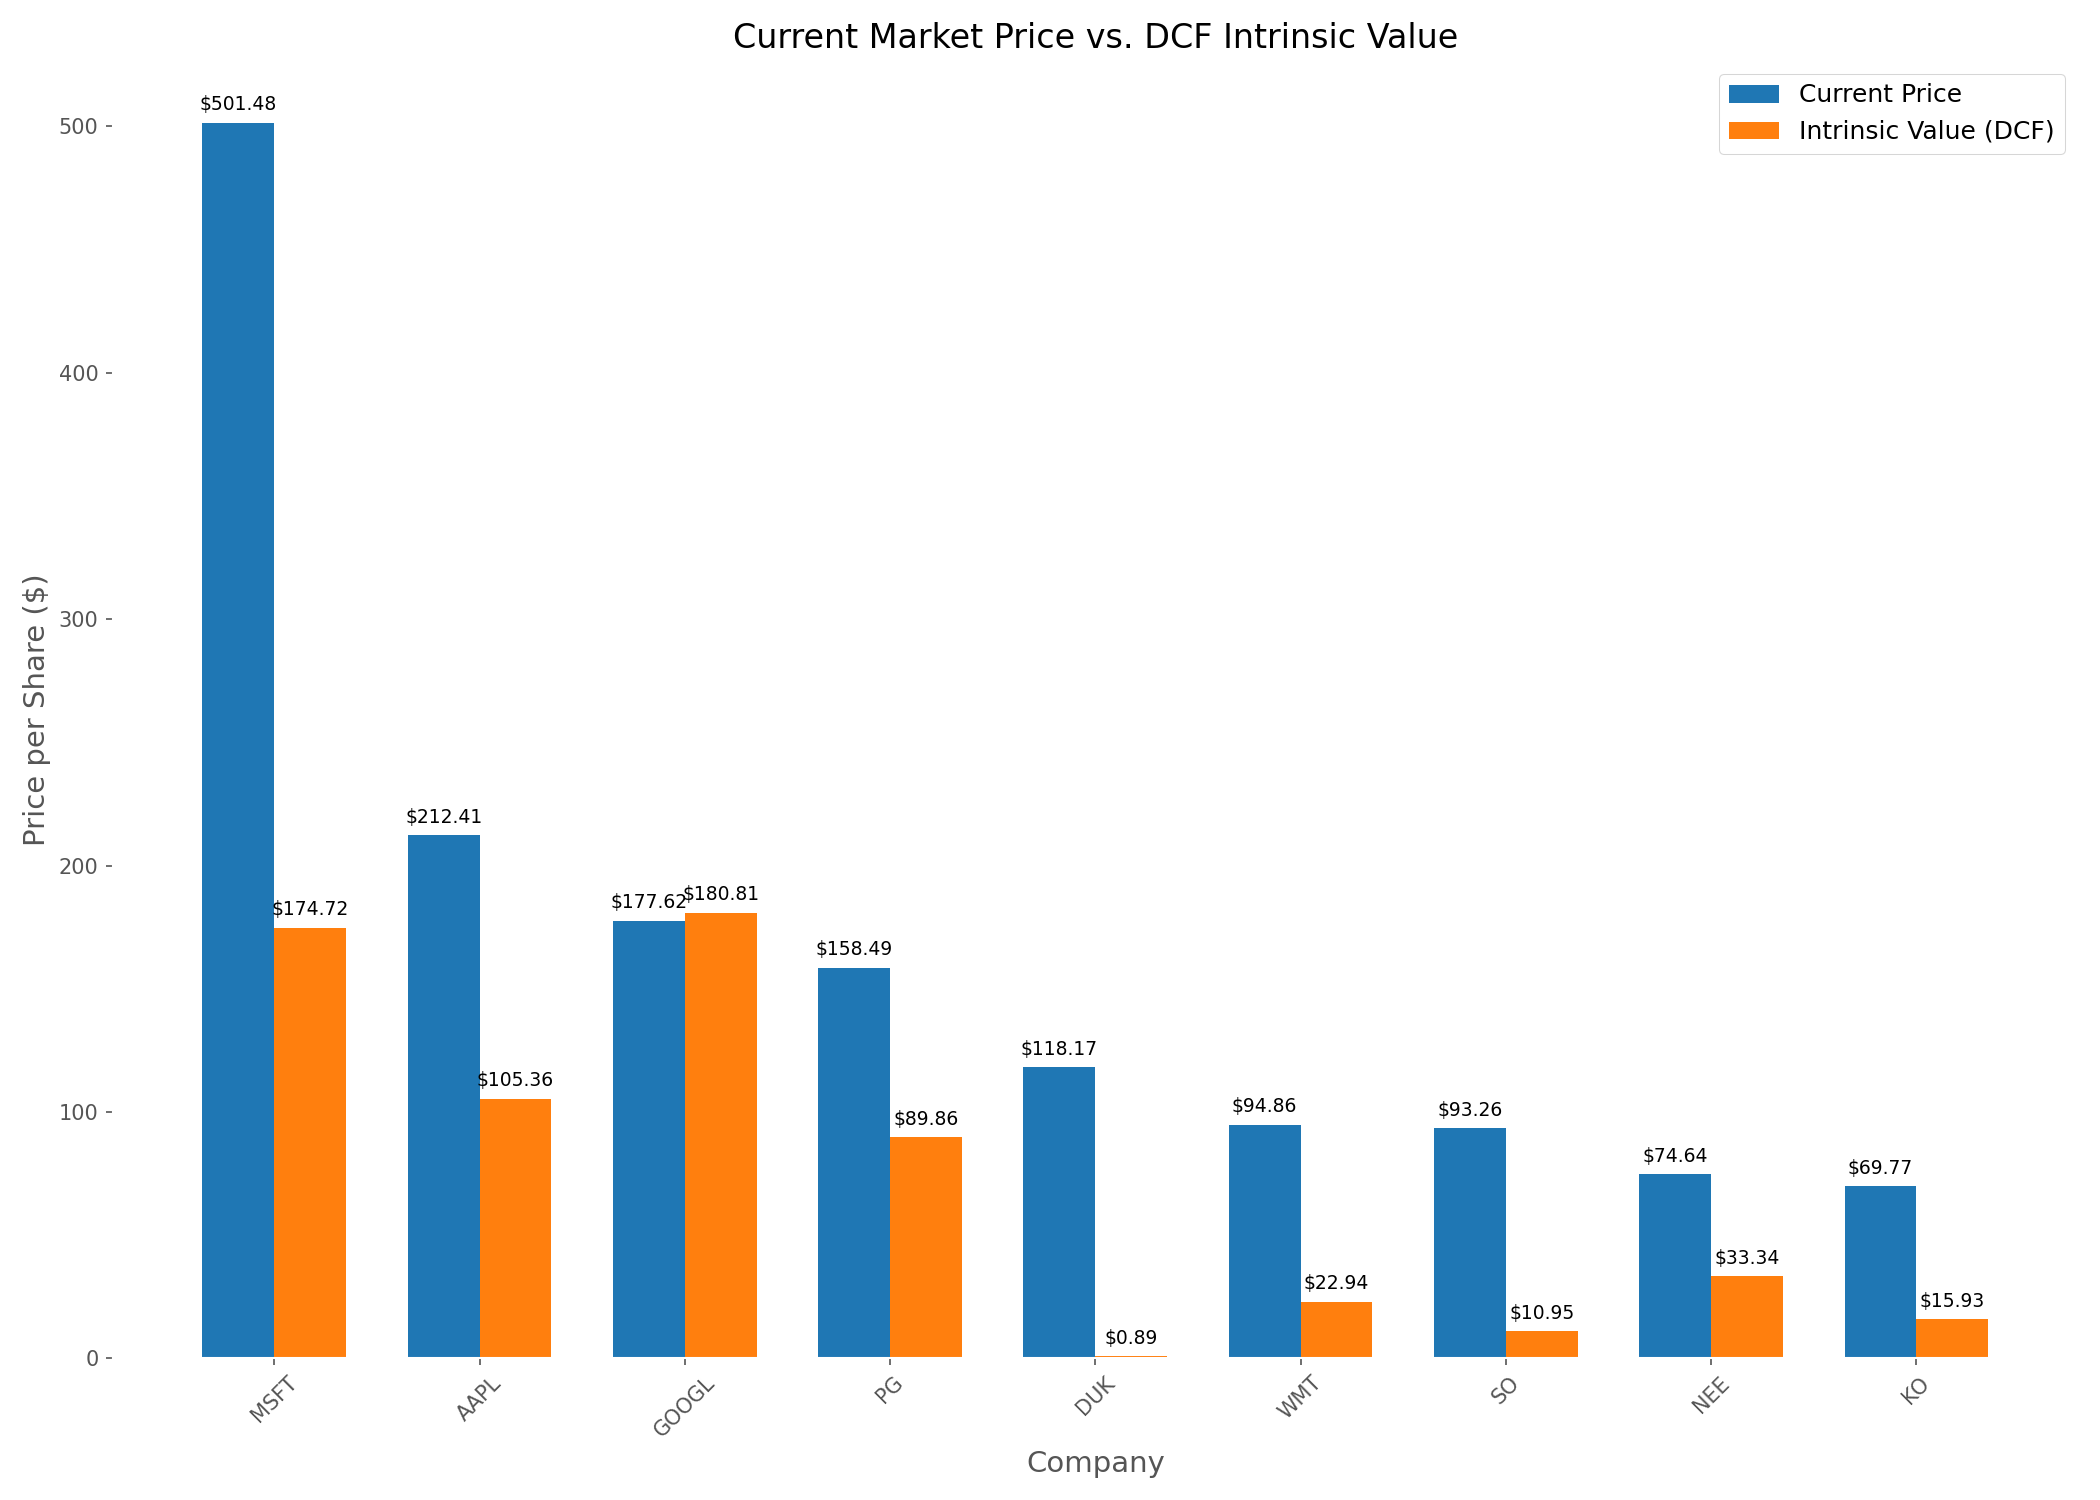
Our analysis revealed that most companies appear overvalued based on DCF analysis, with only Google (GOOGL) showing a slight undervaluation of about 1.8%. This suggests that current market prices may be incorporating more optimistic growth assumptions than our model or placing value on factors not captured by DCF analysis.
The DCF/Price ratio (intrinsic value divided by market price) provides a quick way to assess potential over or undervaluation:
- DCF/Price > 1: Potentially undervalued
- DCF/Price < 1: Potentially overvalued
In our analysis, Google was the only company with a DCF/Price ratio above 1 (1.02), while utilities showed the lowest ratios, suggesting they may be the most overvalued sector according to our DCF model.
Understanding DCF Components
To better understand what drives DCF valuations, we analyzed the components of the DCF calculation for each company:
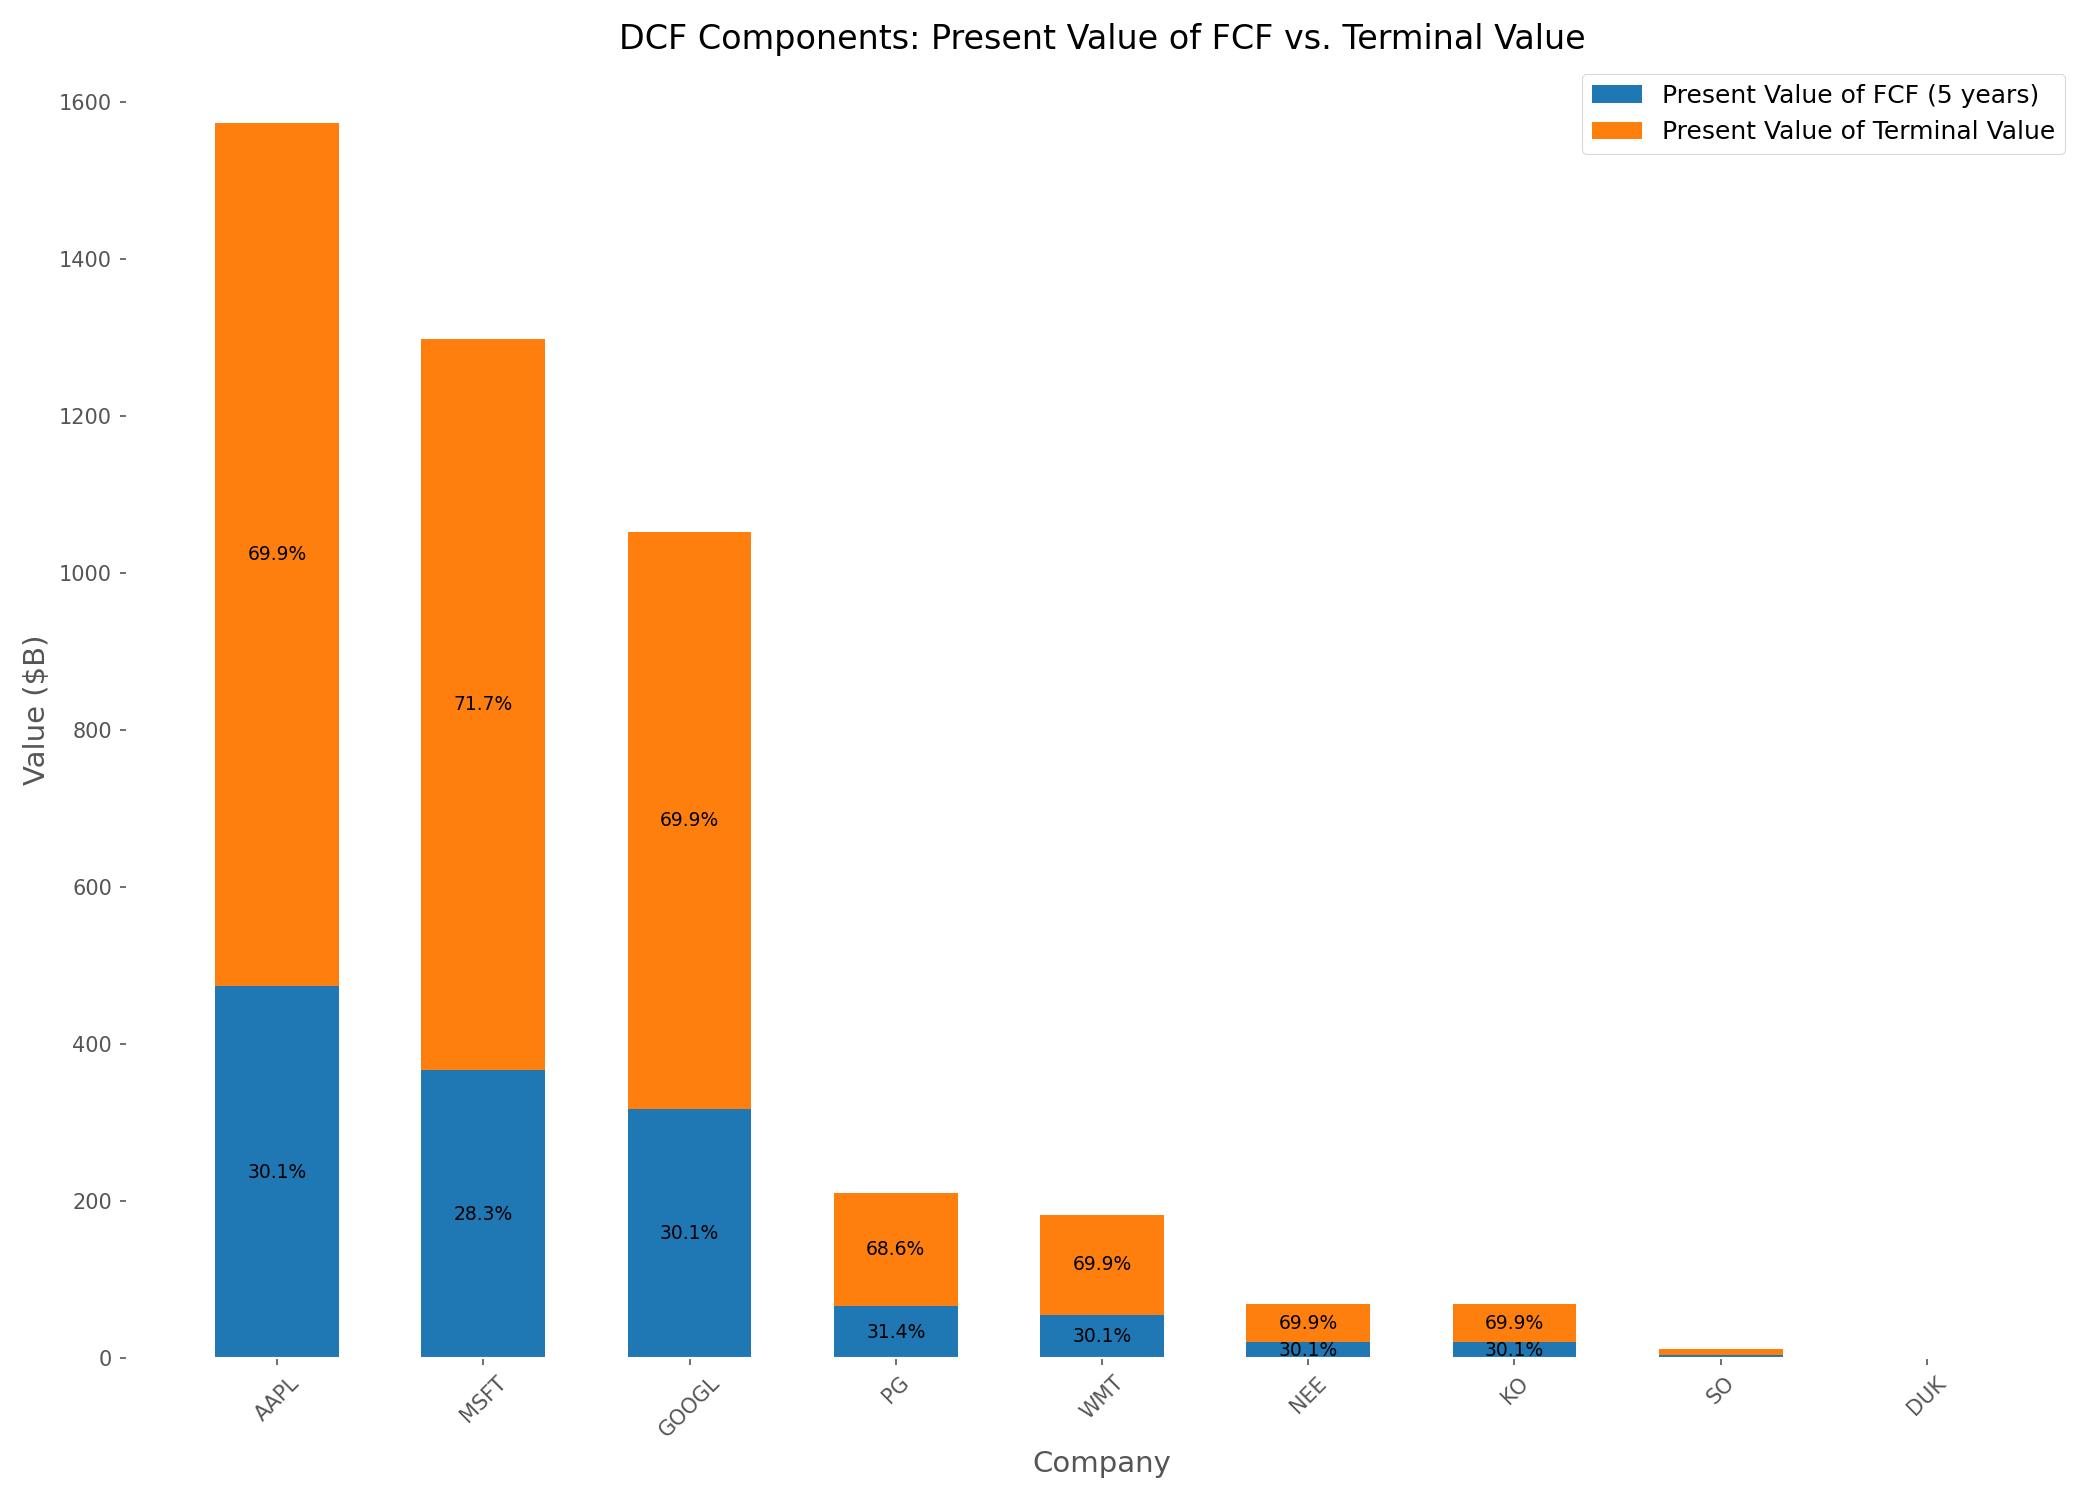
This visualization highlights a critical aspect of DCF analysis: the terminal value typically represents 70-80% of the total DCF value. This emphasizes why terminal growth rate and discount rate assumptions are so crucial to the final valuation.
The dominance of terminal value in the calculation is both a strength and weakness of DCF analysis. It forces investors to consider long-term sustainable growth rates, but it also means that small changes in terminal assumptions can dramatically impact the final valuation.
Sensitivity Analysis: The Achilles' Heel of DCF
Given the importance of discount rate and terminal growth rate assumptions, we performed a sensitivity analysis to see how changes in these parameters affect DCF valuations:
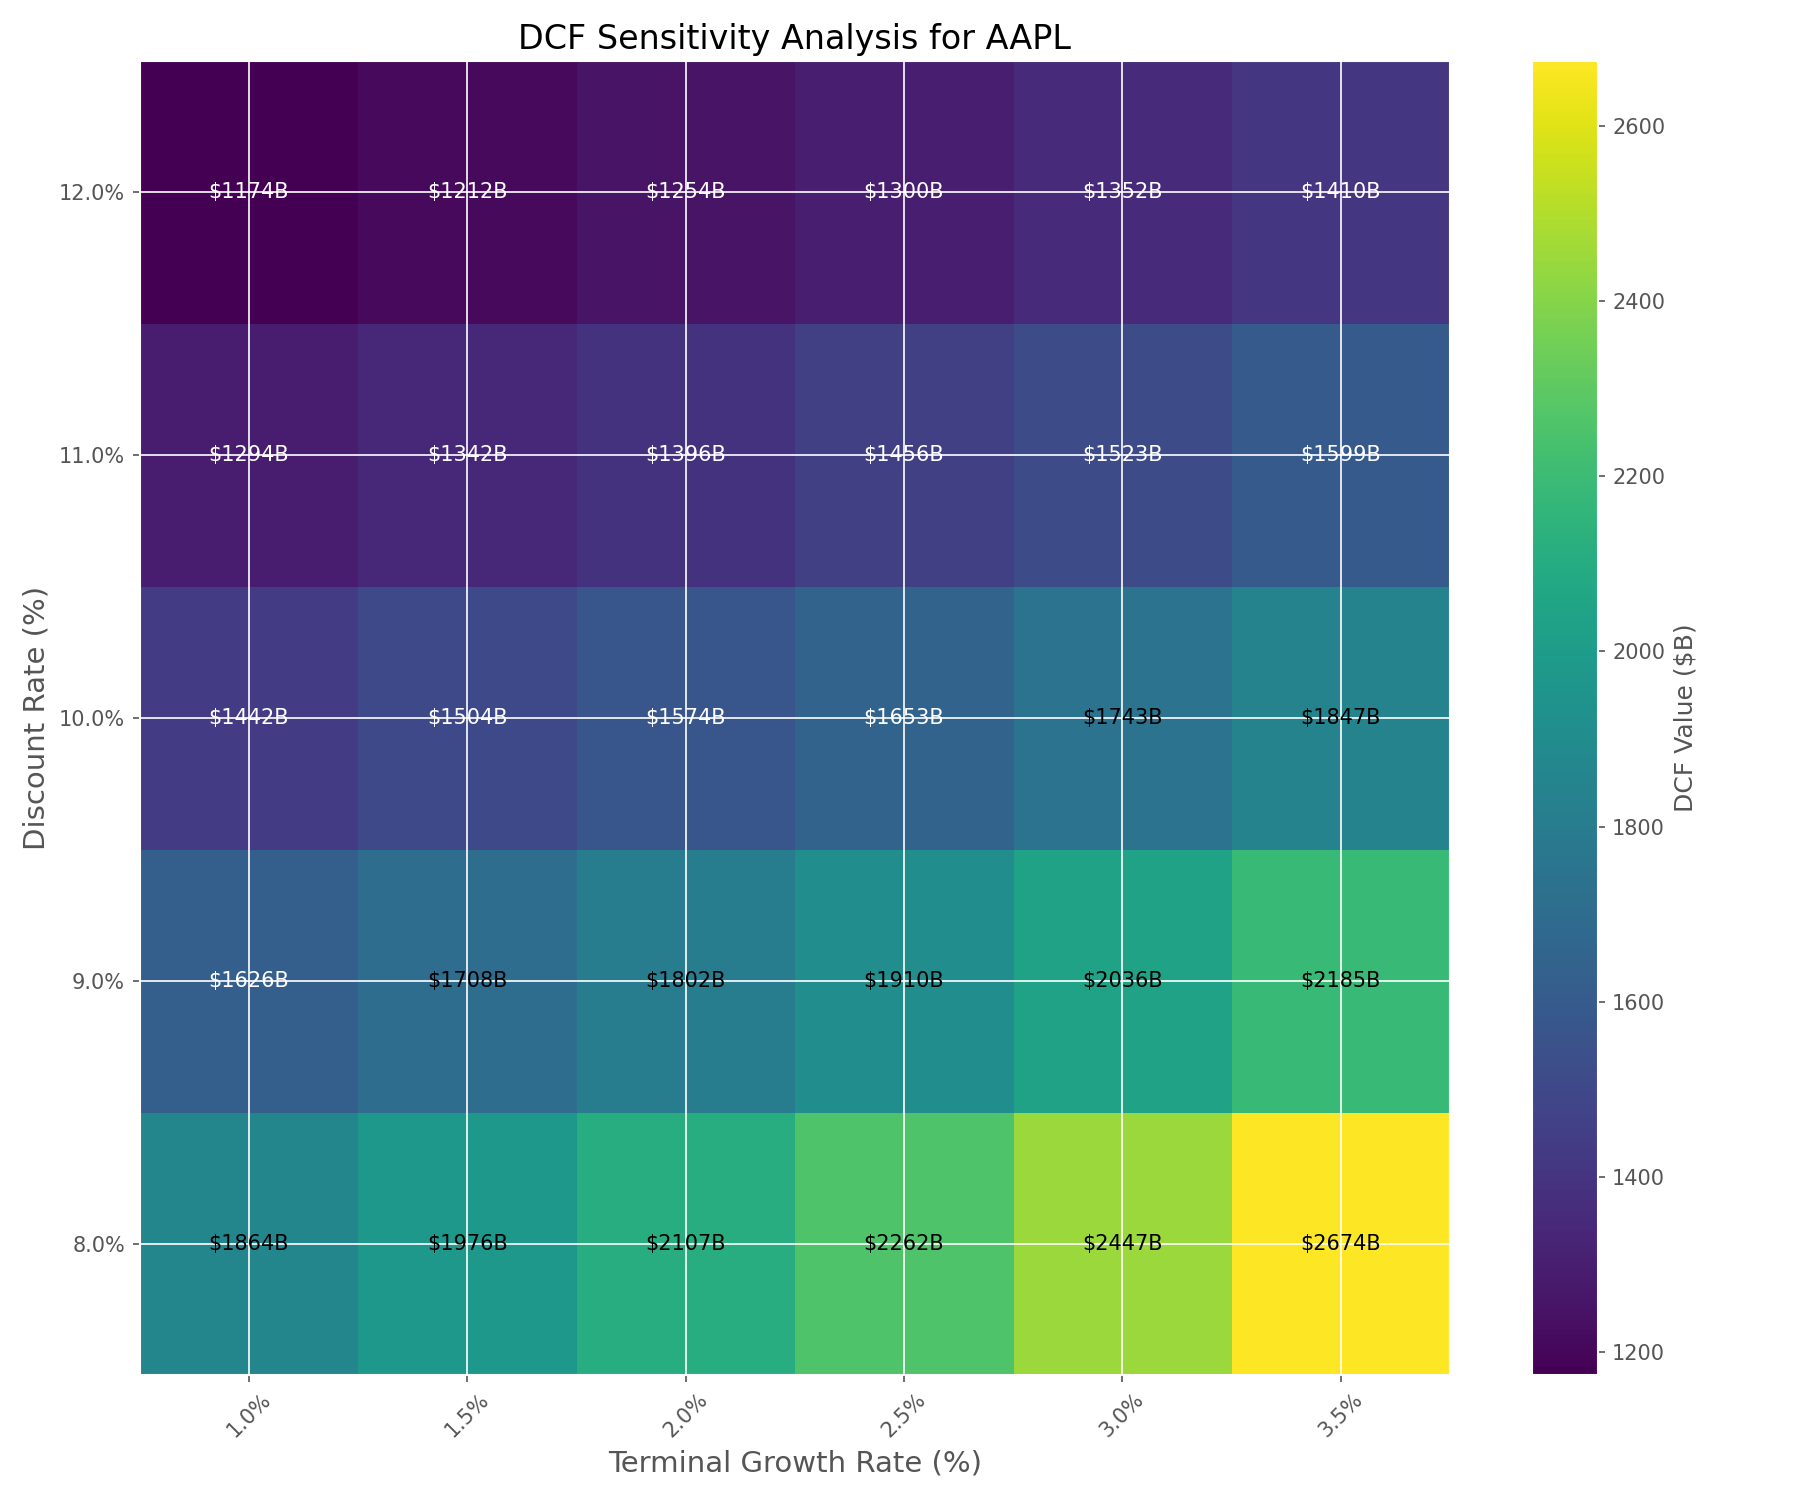
The sensitivity analysis reveals the dramatic impact that small changes in assumptions can have on DCF valuations. For example, changing the discount rate from 10% to 8% or the terminal growth rate from 2% to 3% can increase the DCF value by 50% or more.
Our analysis showed that DCF values can vary by an average of 197% across the range of reasonable assumptions. This highlights why DCF should be viewed as providing a range of possible values rather than a precise intrinsic value.
DCF vs. Traditional Valuation Metrics
To provide context for our DCF results, we compared them with traditional valuation metrics like P/E ratio and EV/EBITDA:
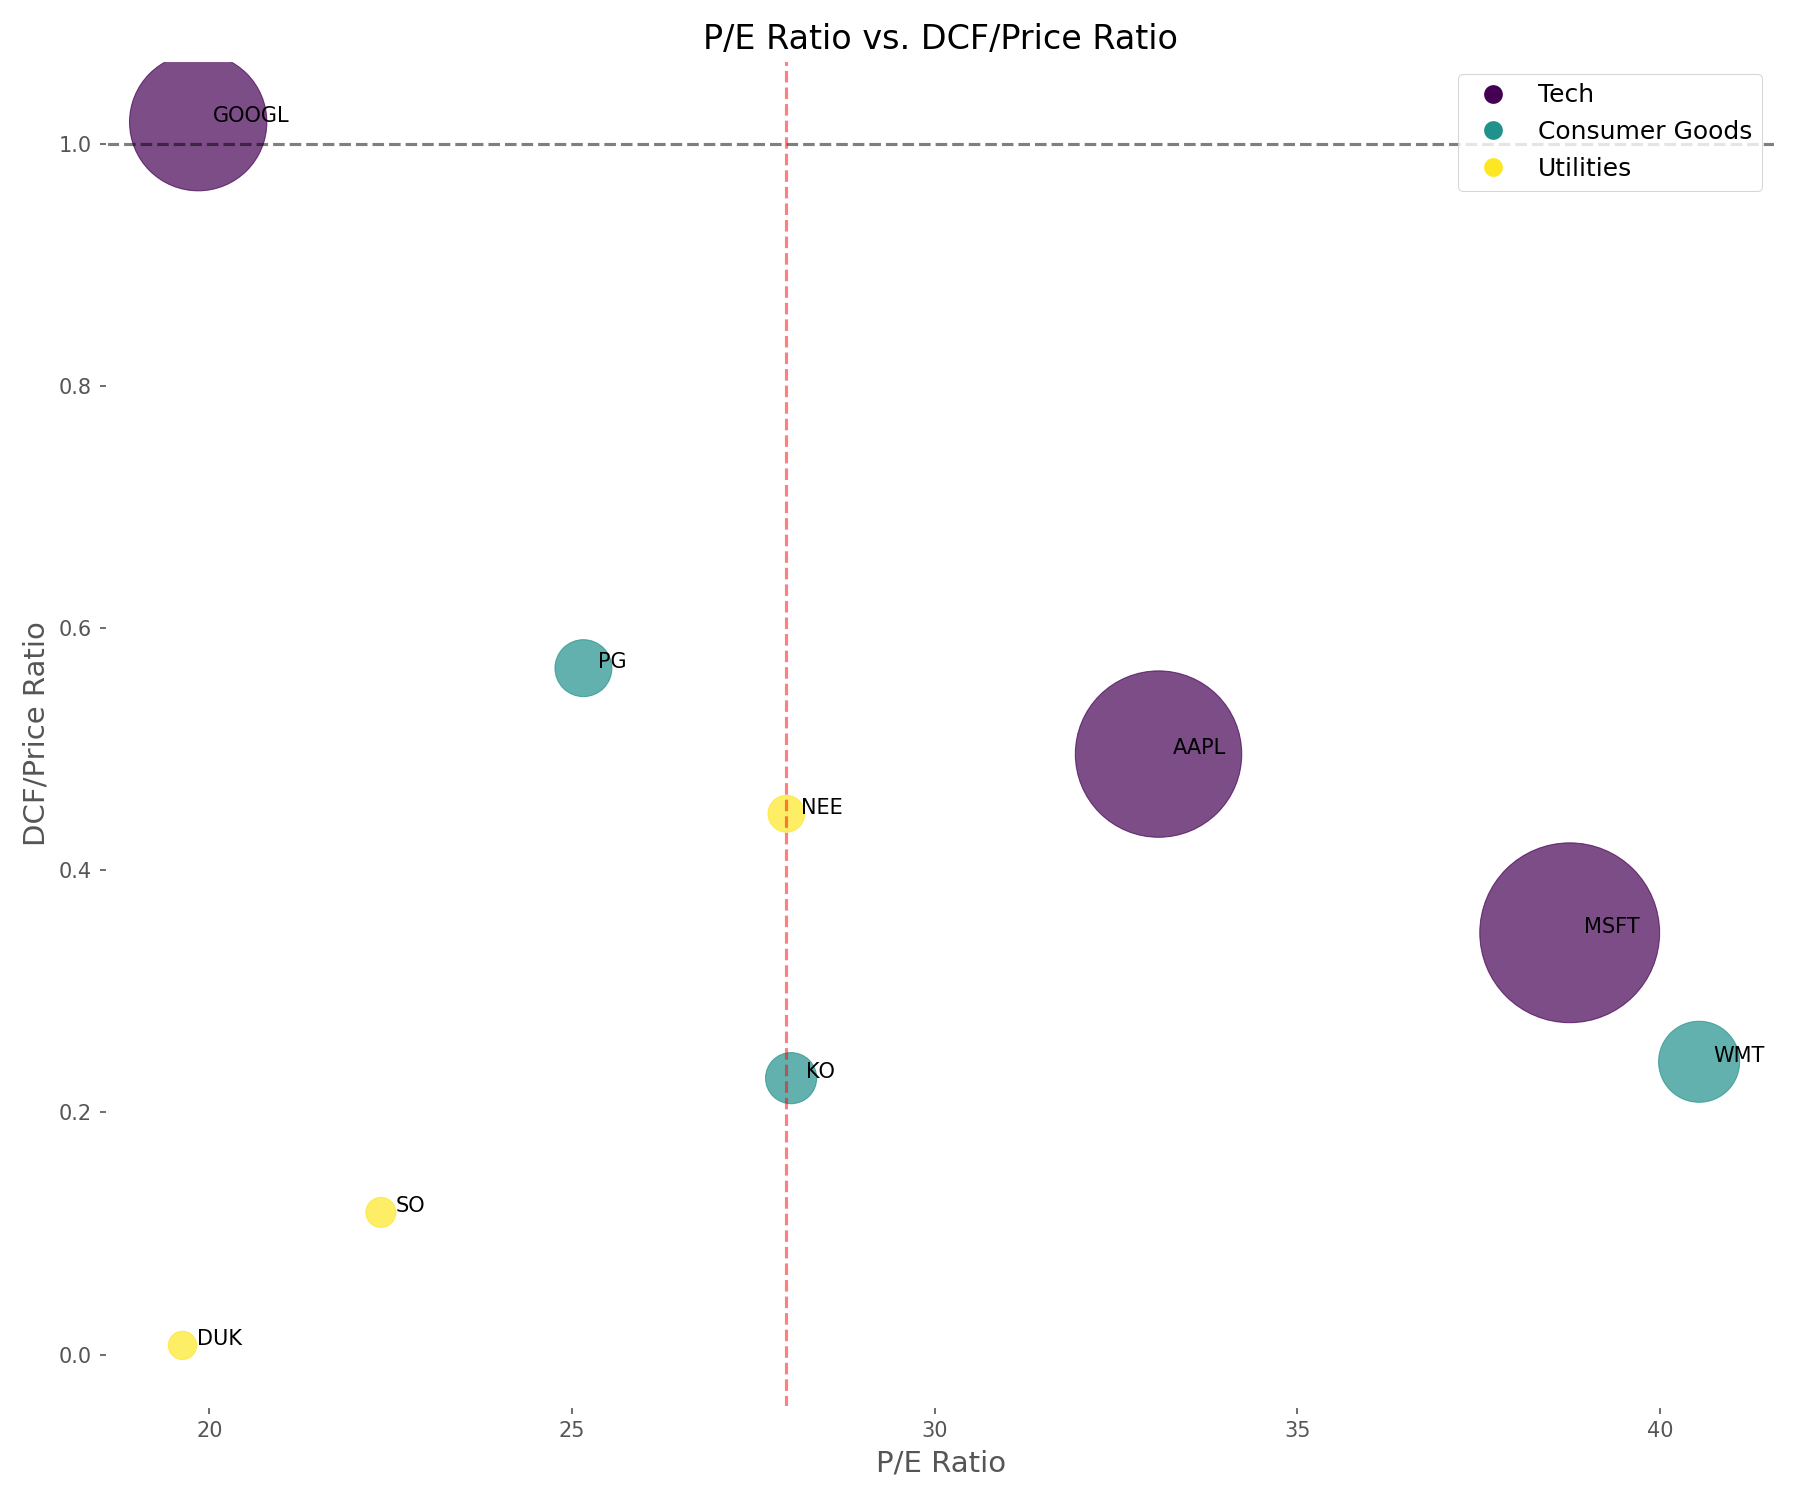
This comparison reveals an interesting pattern: companies with higher P/E ratios tend to have lower DCF/Price ratios. This suggests that the market may be placing a premium on growth potential that our DCF model doesn't fully capture, or alternatively, that high P/E stocks may be more overvalued from a cash flow perspective.
The sector-specific patterns are also revealing:
- Tech companies have higher P/E ratios but varying DCF/Price ratios
- Consumer goods companies show more moderate multiples across metrics
- Utilities have lower P/E ratios but also very low DCF/Price ratios
Valuation Quadrant Analysis
To synthesize our findings, we created a valuation quadrant analysis that plots companies based on their P/E ratios and DCF/Price ratios:
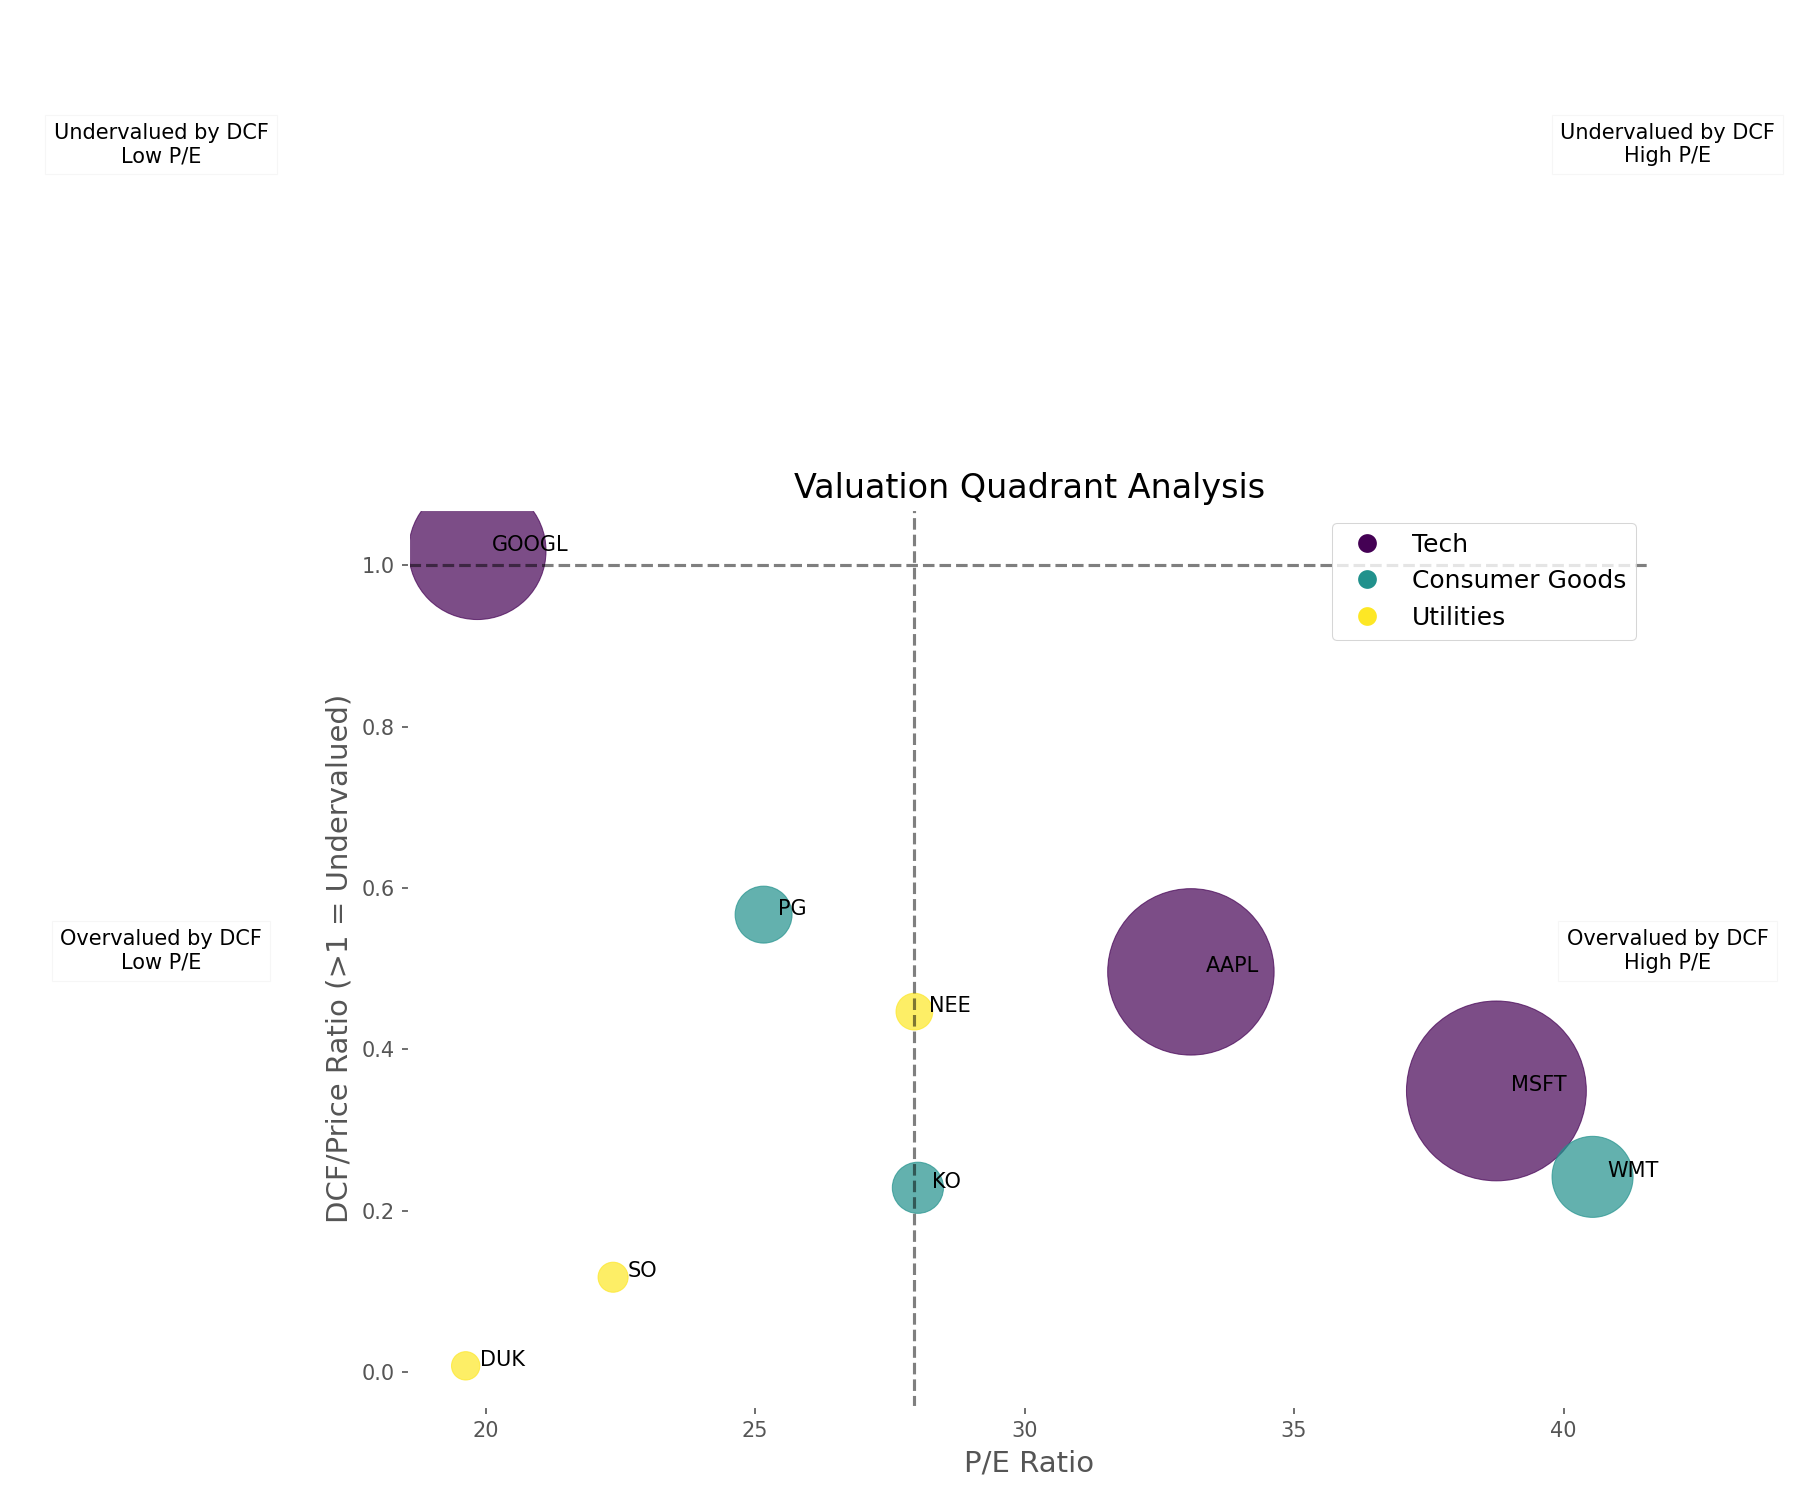
This quadrant analysis provides a comprehensive view of valuation across different methodologies:
- Upper Right (Undervalued by DCF, Low P/E): Potentially the best value opportunities
- Upper Left (Undervalued by DCF, High P/E): Growth at a reasonable price
- Lower Right (Overvalued by DCF, Low P/E): Value traps
- Lower Left (Overvalued by DCF, High P/E): Potentially the most overvalued stocks
In our analysis, most companies fall into the lower left quadrant (Overvalued by DCF, High P/E), with Google being the only exception, positioned in the upper left quadrant (Undervalued by DCF, High P/E).
Insights from the DCF Analysis
Our comprehensive DCF analysis of nine companies across three sectors reveals several key insights:
1. Market Valuation Perspective
Based on our DCF model with a 10% discount rate and 2% terminal growth rate, most stocks appear overvalued in the current market. This could indicate one of three things:
- The market is indeed overvalued and due for a correction
- Investors are using more optimistic assumptions than our model
- The market is pricing in factors not captured by traditional DCF analysis
2. Sector-Specific Insights
Our analysis revealed distinct patterns across sectors:
- Tech Sector: Despite high P/E ratios, tech companies have the strongest FCF generation, which partially justifies their premium valuations
- Consumer Goods: These companies show moderate valuations and stable cash flows, positioning them as relatively balanced investments
- Utilities: Despite having lower P/E ratios than tech companies, utilities show the lowest DCF/Price ratios, suggesting they may be more overvalued than their traditional metrics indicate
3. DCF Model Sensitivity
Perhaps the most important insight is the high sensitivity of DCF valuations to input assumptions. The average DCF value range across our companies was approximately 197% of the base case value, highlighting why DCF should be used as one tool among many rather than as the definitive measure of value.
Conclusion and Investor Takeaways
Discounted Cash Flow analysis provides a powerful framework for estimating a company's intrinsic value based on its ability to generate cash for shareholders. However, as our analysis demonstrates, it's not without limitations.
Here are the key takeaways for investors:
- Use DCF as one tool among many: Combine DCF with other valuation methods and qualitative analysis
- Focus on the range, not the point estimate: Consider a range of possible values based on different assumptions
- Pay attention to cash flow trends: Companies with strong and growing free cash flows tend to create more shareholder value over time
- Be aware of sector differences: Different sectors may require different approaches to valuation
- Question your assumptions: Small changes in discount rates or growth rates can dramatically impact DCF valuations
In the current market environment, our DCF analysis suggests caution, with most stocks appearing overvalued based on conservative assumptions. However, this doesn't necessarily mean investors should avoid these stocks entirely. Instead, it highlights the importance of understanding what you're paying for and ensuring that your investment thesis extends beyond simple valuation metrics.
Remember Warren Buffett's wisdom: "It's far better to buy a wonderful company at a fair price than a fair company at a wonderful price." DCF analysis helps you determine what constitutes a "fair price," but the "wonderful company" part requires looking beyond the numbers to competitive advantages, management quality, and long-term growth potential.
By combining rigorous DCF analysis with broader fundamental research, investors can make more informed decisions and potentially identify opportunities that others miss in both bull and bear markets.
Comments (0)
No comments yet. Be the first to comment!