Understanding Covered Calls: A Beginner's Guide to Generating Income from Stocks
Reading time: 6 minutes
If you own stocks, you might be leaving money on the table. There's a strategy called the covered call that lets you generate extra income from shares you already own. In this article, we'll explain how it works and show you real results from a simulation using Tesla (TSLA) stock from November 2020 to November 2025.
What Is a Call Option?
Before we dive into covered calls, let's understand what a call option is.
A call option is a contract that gives someone the right to buy a stock at a specific price (called the strike price) before a certain date (the expiration date). The buyer pays a fee called a premium to get this right.
Here's a simple example:
- You think Tesla stock (currently at $100) will rise to $120 next month
- You buy a call option with a strike price of $105, expiring in 4 weeks
- You pay a $3 premium for this option
- If Tesla rises to $120, you can buy it at $105 and immediately sell at $120, making $15 minus the $3 premium = $12 profit
- If Tesla stays below $105, your option expires worthless, and you lose the $3 premium
Key takeaway: Call options let you bet on a stock going up, with limited downside (you can only lose the premium you paid).
What Is a Covered Call?
Now flip this around. Instead of buying call options, what if you sell them?
A covered call is when you:
- Own shares of a stock
- Sell call options on those shares
- Collect the premium as income
It's called "covered" because you own the underlying shares—if the buyer exercises their option, you can deliver the shares you already have.
The Trade-Off
When you sell a covered call, you're making a deal:
- You get: Immediate income (the premium)
- You give up: Potential upside if the stock rises above the strike price
If the stock price stays below the strike price, the option expires worthless, and you keep both your shares and the premium. But if the stock rises above the strike price, your shares get "called away"—you have to sell them at the strike price, missing out on further gains.
Our Strategy: Selling Calls When Stocks Are Overbought
We developed a strategy that uses a moving average to decide when to sell covered calls. The idea is simple: sell calls when the stock appears overbought (price is high relative to recent history) and buy shares back when it appears oversold.
Strategy Rules
When to Sell Covered Calls:
- Calculate an 8-week moving average of the stock price
- If current price is 15% or more above the moving average, sell covered calls
- Sell calls on 20% of your shares (not all of them)
- Set strike price at 5% above current price
- Options expire in 4 weeks
When to Buy Shares:
- If current price is 10% or more below the moving average, buy shares
- Use 25% of available cash to buy
- If you have zero shares (all were called away), buy back immediately
Why This Approach?
The moving average acts as a "fair value" indicator. When price spikes well above it, the stock may be due for a pullback—a good time to sell calls and collect premium. When price drops well below it, the stock may be undervalued—a good time to buy more shares.
By only selling calls on a portion of your shares, you preserve some upside if the rally continues.
Simulation Setup and Assumptions
Let's be transparent about our simulation parameters:
Initial Conditions
- Starting shares: 1,000 shares of TSLA
- Starting cash: $0 (we assume you already own the shares)
- Initial stock price: $163.20
- Initial portfolio value: $163,200.00
Time Period
- Duration: November 2020 to November 2025 (261 weeks)
- Data frequency: Weekly prices
Key Assumptions
-
Fractional shares allowed: Unlike real trading, we allow buying/selling any number of shares (not just round lots of 100)
-
Single active option: We can only have one option position at a time. Must wait for expiration before selling new options.
-
Simplified premium calculation: We use a custom formula instead of real market prices. More details below.
-
No transaction costs: We ignore commissions and fees, which would reduce returns in practice.
-
Automatic exercise: If the stock price is at or above the strike price at expiration, the option is automatically exercised and shares are called away.
-
Weekly data only: We check prices once per week, not daily. This means we might miss intra-week opportunities.
How We Calculate Option Premiums
Since we don't have historical option price data, we use a simplified formula to estimate premiums. The premium depends on three main factors:
Base Premium: We start with 2% of the stock price. For a $300 stock, the base premium is $6 per share.
Strike Price Effect: The higher the strike price (relative to current price), the lower the premium. An option with a $315 strike is less likely to be exercised than a $305 strike, so it pays less premium.
Time Effect: Longer time until expiration means higher premium. A 4-week option is worth more than a 1-week option because there's more time for the stock to rise.
Example: For a $300 stock with a $315 strike and 4 weeks to expiration, our formula calculates approximately $1.50 per share in premium.
Important Note: Real option premiums are determined by market supply/demand and include volatility. High-volatility stocks like Tesla typically command higher premiums than our simplified formula estimates, so our results are likely conservative.
The Results
Now let's look at what actually happened when we ran this strategy on Tesla stock.
Portfolio Performance
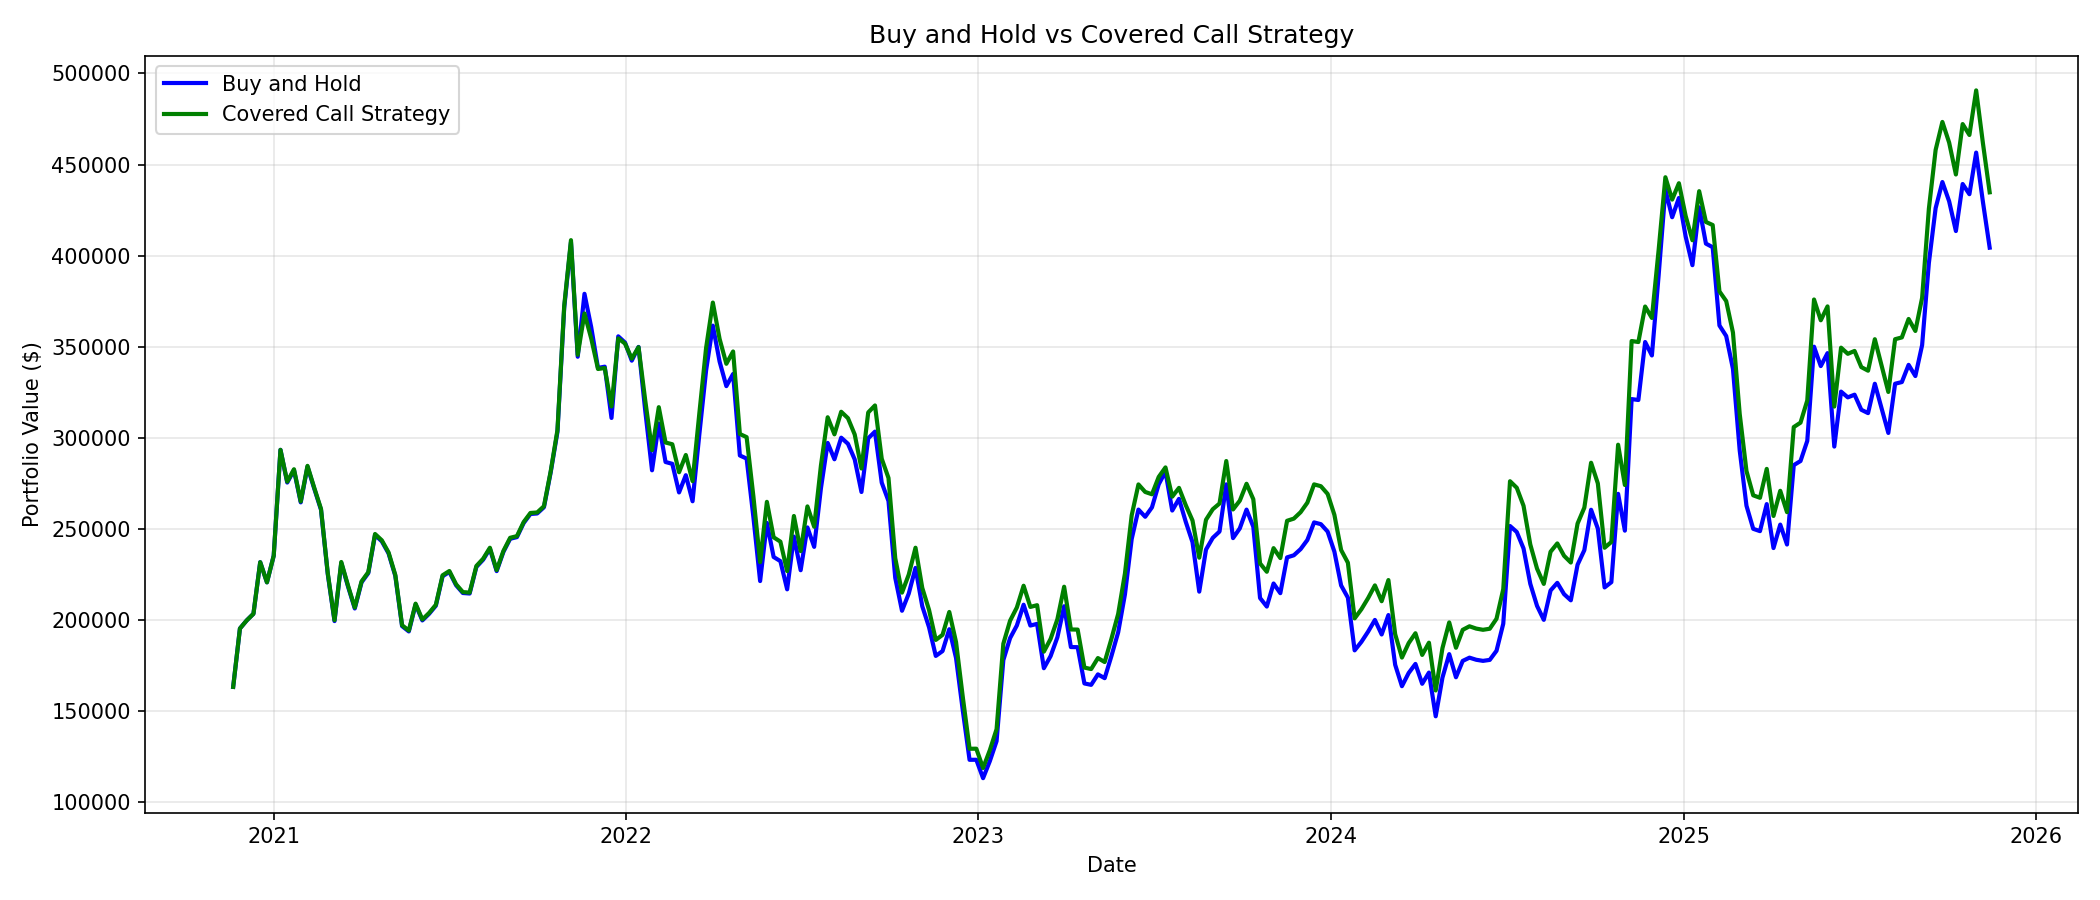
The chart above shows two lines:
- Blue: Buy and hold (simply holding 1,000 shares the entire time)
- Green: Our covered call strategy (stock value + cash collected from premiums and share sales)
Final Results:
- Buy and Hold Value: $404,350.01
- Covered Call Value: $434,745.70
- Difference: $30,395.69 (+7.52%)
Our covered call strategy outperformed buy-and-hold by $30,395.69!
How Did We Get There?
Let's break down the numbers:
| Metric | Value |
|---|---|
| Starting Shares | 1,000 |
| Final Shares | 1,071.95 |
| Total Options Sold | 16 |
| Total Premiums Collected | $6,832.77 |
| Average Premium per Trade | $427.05 |
| Total Share Purchases | 36 |
| Total Shares Bought | 867.95 |
Notice that we ended with 1,071.95 shares—more than we started with! This happened because:
- Some options expired out-of-the-money (we kept the shares and premium)
- When shares were called away, we used the cash to buy back shares when price dropped below the moving average
- We accumulated more shares by buying the dips
Price Action and Trade Points
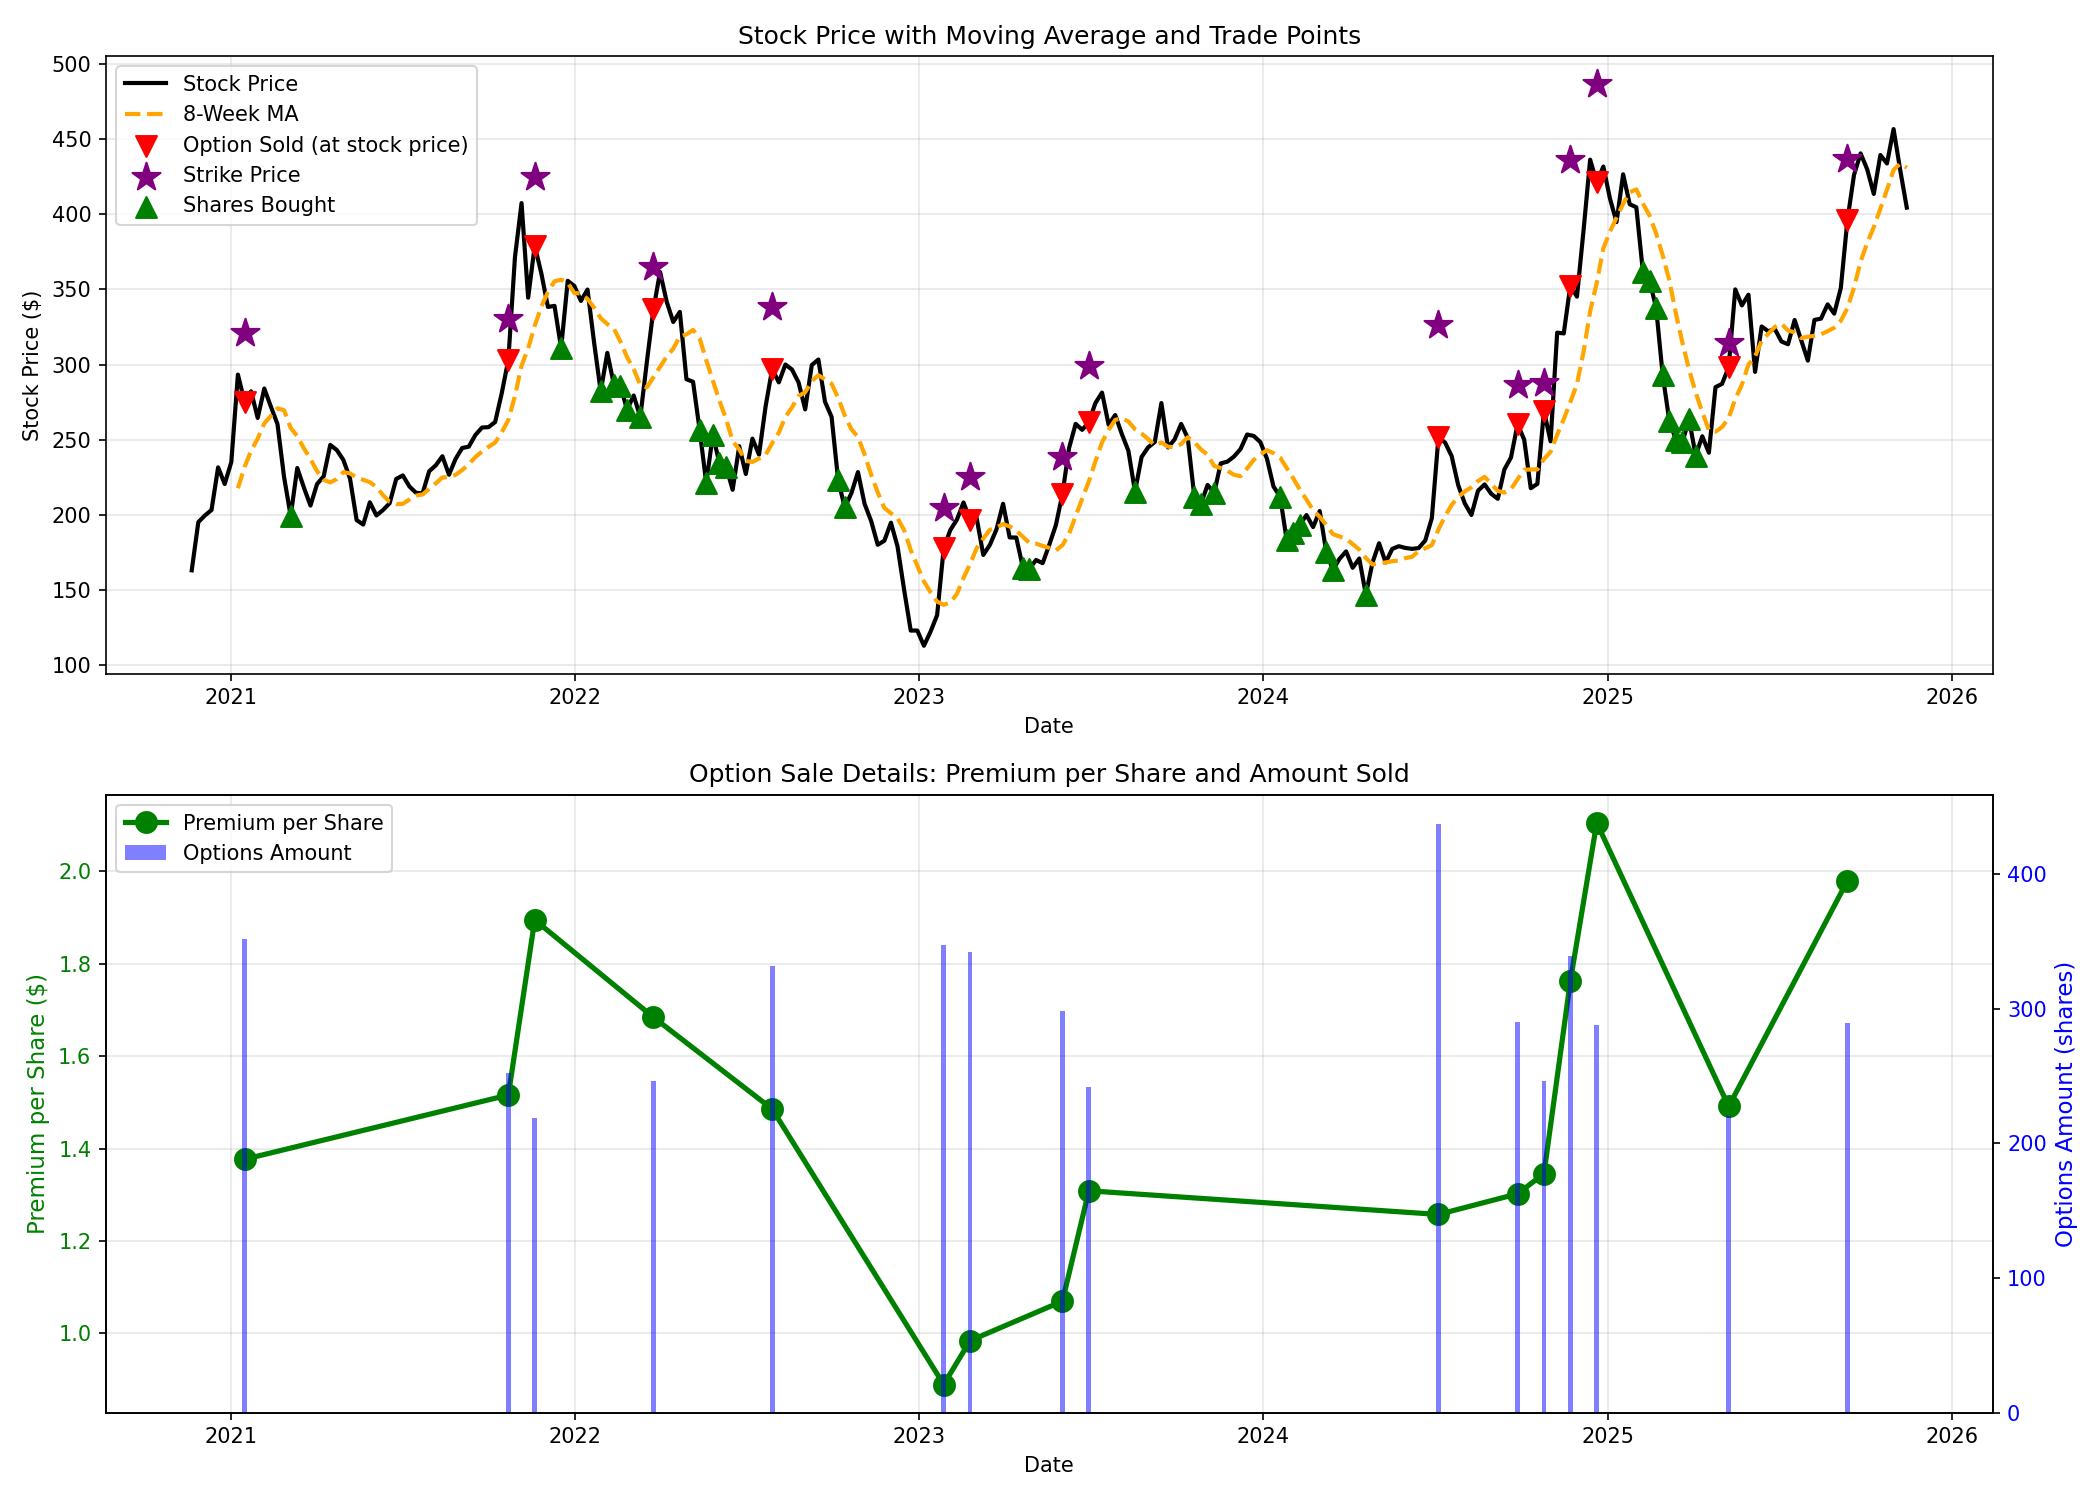
The charts above show:
Top Chart - Price and Moving Average:
- Black line: Tesla stock price
- Orange dashed line: 8-week moving average
- Red triangles (▼): Points where we sold covered calls (at stock price)
- Purple stars (★): Strike prices for each option sold
- Green triangles (▲): Points where we bought shares
Notice how the red triangles cluster at price peaks (well above the orange MA line), and green triangles appear at price troughs (below the MA line). This is our strategy in action—selling when overbought, buying when oversold. The purple stars show the strike prices, which are set above the stock price at the time of sale.
Bottom Chart - Option Details:
- Green line: Premium per share collected
- Blue bars: Number of shares covered by each option
You can see that premium per share varies based on how far the strike price is from the current price and market conditions.
Real Trade Examples
Let's examine two actual trades from our simulation to see how covered calls play out in practice.
Trade #1: The Big Win
Option Sale (December 20, 2024):
- Stock Price: $421.06
- Strike Price: $486.48
- Shares Covered: 288
- Premium Collected: $606.33
What Happened at Expiration (January 17, 2025):
- Stock Price at Expiration: $426.50
- Outcome: Option expired worthless ✓
The Result:
This was a perfect covered call trade! The stock price (426.50) stayed below our strike price ($486.48), so the option expired worthless. We kept:
- All 288 shares
- The entire $606.33 premium as pure profit
The stock actually declined from $421.06 to $426.50 during the option period, which is exactly when covered calls shine. We collected income while the stock went sideways/down.
Net Result: +$606.33
Trade #2: The Opportunity Cost
Option Sale (October 25, 2024):
- Stock Price: $269.19
- Strike Price: $287.72
- Shares Covered: 246
- Premium Collected: $331.10
What Happened at Expiration (November 22, 2024):
- Stock Price at Expiration: $352.56
- Outcome: Option exercised ✗
- Price Increase: +31.0%
The Result:
This trade illustrates the downside of covered calls. The stock surged from $269.19 to $352.56 (+31.0%), blowing past our strike price of $287.72.
Here's what happened:
- Our 246 shares were called away at $287.72
- We received: $70,780.30 (strike price × shares)
- We collected: $331.10 in premium
- But we missed: $15,950.64 in additional gains
If we had simply held those shares, we would have made $15,950.64 more. The premium we collected ($331.10) only partially offset this opportunity cost.
Net Result: $-15,619.54 (premium minus missed gains)
This is the risk of covered calls—you cap your upside. However, we still profited (shares sold at $287.72 were bought at $269.19 or less), and we used the cash to buy back shares later when prices dipped.
Key Takeaways
What Worked Well
-
Income generation: We collected $6,832.77 in premiums over 261 weeks—that's real cash in our pocket regardless of stock direction.
-
Buying the dips: By purchasing shares when price dropped below the MA, we accumulated 867.95 additional shares at favorable prices.
-
Risk management: Selling only 20% of shares per trade meant we always maintained exposure to potential upside.
Things to Consider
-
Bull market performance: This simulation covered a period where TSLA rose from $163.20 to $404.35 (+147.8%). In a sideways or declining market, covered calls would likely show even better relative performance.
-
Tax implications: Option premiums and short-term capital gains are taxed as ordinary income. Consult a tax professional.
-
Assignment risk: In real trading, options can be exercised early (American-style options), particularly before dividend dates.
-
Volatility matters: Higher volatility = higher premiums. TSLA is known for high volatility, which makes it attractive for covered calls.
Conclusion
Covered calls are a powerful tool for generating income from stocks you already own. By selling the right to buy your shares at a higher price, you collect immediate premium income while maintaining ownership—unless the stock rises significantly.
Our moving average strategy added discipline to this approach:
- Sell calls when the stock appears overbought (price well above MA)
- Buy shares when the stock appears oversold (price well below MA)
- Only commit a portion of shares/cash to each trade
The results speak for themselves: $434,745.70 final value versus $404,350.01 for buy-and-hold, a 7.52% improvement.
Of course, past performance doesn't guarantee future results, and this simulation has limitations (no transaction costs, simplified pricing, etc.). But it demonstrates the potential of covered calls as an income-generating strategy for long-term stock holders.
Disclaimer: This article is for educational purposes only and does not constitute financial advice. Options trading involves significant risk and is not suitable for all investors. Please consult with a qualified financial advisor before implementing any investment strategy.
Comments (0)
No comments yet. Be the first to comment!