Can RSI Actually Predict Stock Price Peaks? Testing the Popular Indicator
Published: November 26, 2025
Picture this: You bought Coca-Cola stock at $50, and now it's trading at $70. You're sitting on a nice 40% gain, but you're torn. Sell now and lock in profits? Or hold and risk watching those gains evaporate if the stock crashes?
You want to sell near the peak. That's the dream, right? Sell at the top, buy back lower, repeat.
This is exactly why millions of traders rely on the RSI (Relative Strength Index). It's one of the most popular technical indicators out there. Trading platforms highlight it. YouTube gurus swear by it. The conventional wisdom is simple: when RSI goes above 70, the stock is "overbought" and due for a decline. Time to sell!
But here's the question that should keep you up at night: Does it actually work?
I wasn't willing to bet my money on conventional wisdom, so I decided to test it. I analyzed 1,255 trading days of Coca-Cola stock data spanning from 2020-11-20 00:00:00-05:00 to 2025-11-19 00:00:00-05:00. I tested whether high RSI values could actually predict price peaks before they happen.
The results might change how you use this indicator.
What Is RSI? A Simple Explanation
Before we dive into the results, let's make sure we're on the same page about what RSI actually is.
RSI (Relative Strength Index) is a momentum indicator that measures how fast and how much a stock's price is changing. Think of it as a "speed gauge" for price movements.
How It Works
RSI is calculated using recent price changes over a specific period (typically 14 days):
- Compare recent gains to recent losses - Average the price increases vs. decreases over the past 14 trading days
- Convert to a 0-100 scale - The result is normalized to a number between 0 and 100
What The Numbers Mean
- RSI above 70 = "Overbought" zone - The stock has been rising rapidly and might be due for a pullback
- RSI below 30 = "Oversold" zone - The stock has been falling rapidly and might be due for a bounce
- RSI around 50 = Neutral - No strong momentum in either direction
The Trading Logic
The standard interpretation goes like this:
- When RSI crosses above 70 → Stock is overbought → Sell signal (peak is near!)
- When RSI crosses below 30 → Stock is oversold → Buy signal (bottom is near!)
Sounds logical, right? High momentum can't last forever. What goes up must come down.
But does the data actually support this? That's what we're here to find out.
The Stakes: Why This Matters
If RSI can reliably predict peaks, it's incredibly valuable:
- Sell near the top, preserving your gains
- Avoid the painful experience of watching profits disappear
- Re-enter at lower prices and compound your returns
But if RSI doesn't work—or worse, gives you false signals—you could:
- Sell too early and miss out on continued gains
- Make unnecessary trades and rack up fees
- Base your investment decisions on noise rather than signal
With real money on the line, we need real answers. Let's test this properly.
What Is a "Peak" Anyway?
Before diving into the results, we need to define what we mean by a "peak." I didn't use the traditional definition of a local maximum. Instead, I used a more practical, forward-looking approach:
A price is a peak if it's higher than ALL prices in a future window.
For example, with a 1.5-3 month window, today's price is only considered a peak if it exceeds every single price between 33 and 66 trading days from now. This is much stricter than just being higher than yesterday and tomorrow.
Why this approach? Because in real trading, you care about whether you're buying near a top that won't be exceeded for months. A price that's only 1% higher than nearby prices isn't a meaningful peak.
I tested multiple window configurations:
- Short-term: 0.5-1 month (11-22 days)
- Medium-term: 1-2 months (22-44 days)
- Longer-term: 1.5-3 months (33-66 days)
- Long-term: 2-4 months (44-88 days)
The Experiment Design
The methodology was straightforward:
- Calculate RSI using a standard 14-day window for all 1,255 trading days
- Mark predictions: Flag any day where RSI exceeds a threshold (60, 65, 70, 75, or 80) as a "predicted peak"
- Identify actual peaks using the forward-looking window definition
- Compare results: Calculate how often RSI predictions matched actual peaks
- Benchmark against random guessing to see if RSI adds real value
The critical insight: If RSI performs no better than random guessing, it has zero predictive value.
Understanding the Metrics: A Quick Guide
Before we dive into results, let's demystify the terminology you'll see throughout this analysis. Don't worry—these concepts are simpler than they sound!
The Four Outcomes
Imagine you're trying to predict which 100 days will be peaks. After checking the actual results, every prediction falls into one of four categories:
True Positive (TP) - ✅ You predicted a peak, and it WAS a peak
- Example: RSI exceeded 70 on March 15, and March 15 was indeed a peak
- This is good: You correctly identified a peak
False Positive (FP) - ❌ You predicted a peak, but it WASN'T a peak
- Example: RSI exceeded 70 on April 22, but the price kept rising
- This is bad: You got a false alarm (Type I error)
False Negative (FN) - ⚠️ You did NOT predict a peak, but it WAS a peak
- Example: RSI stayed at 55 on June 10, but June 10 was actually a peak
- This is bad: You missed an opportunity (Type II error)
True Negative (TN) - ✅ You did NOT predict a peak, and it WASN'T a peak
- Example: RSI was 45 on July 5, and July 5 was not a peak
- This is good: You correctly stayed out
The Summary Metrics
From these four outcomes, we calculate two key metrics:
Precision: "When I predict a peak, how often am I right?"
Formula: Precision = TP / (TP + FP)
- If you make 100 predictions and 30 are correct (TP=30, FP=70), your precision is 30%
- High precision means few false alarms—when you get a signal, you can trust it
- Low precision means many false alarms—lots of noise in your signals
Recall: "Of all the actual peaks, how many did I catch?"
Formula: Recall = TP / (TP + FN)
- If there were 50 actual peaks and you caught 20 of them (TP=20, FN=30), your recall is 40%
- High recall means you catch most peaks—you don't miss opportunities
- Low recall means you miss most peaks—your predictor is too conservative
The Tradeoff
Here's the catch: precision and recall usually work against each other.
- Predict everything as a peak: High recall (you'll catch all peaks!) but terrible precision (mostly false alarms)
- Predict almost nothing as a peak: High precision (rarely wrong!) but terrible recall (you miss most peaks)
The art is finding the right balance for your goals. Throughout this article, I'll show you both metrics so you can see these tradeoffs in action.
Real-world example from our data:
- Configuration: 1.5-3 month peaks with RSI > 60
- Out of 376 predictions: 100 were correct (TP) and 276 were false alarms (FP)
- Out of 249 actual peaks: caught 100 (TP) and missed 149 (FN)
- Precision: 100/376 = 26.6%
- Recall: 100/249 = 40.2%
Now let's see how RSI actually performs!
The Results: Does RSI Work?
The Best Case Scenario
The best-performing configuration was 1.5-3 month peaks with RSI > 60:
- Precision: 26.6% (when RSI > 60, the price actually peaked 26.6% of the time)
- Recall: 40.2% (caught 40.2% of all actual peaks)
- Improvement over random: 1.34x better
Out of 249 actual peaks in this window configuration:
- ✅ Correctly identified: 100 peaks
- ❌ Missed: 149 peaks
- ⚠️ False alarms: 276 times it predicted a peak that didn't happen
Let's visualize this:
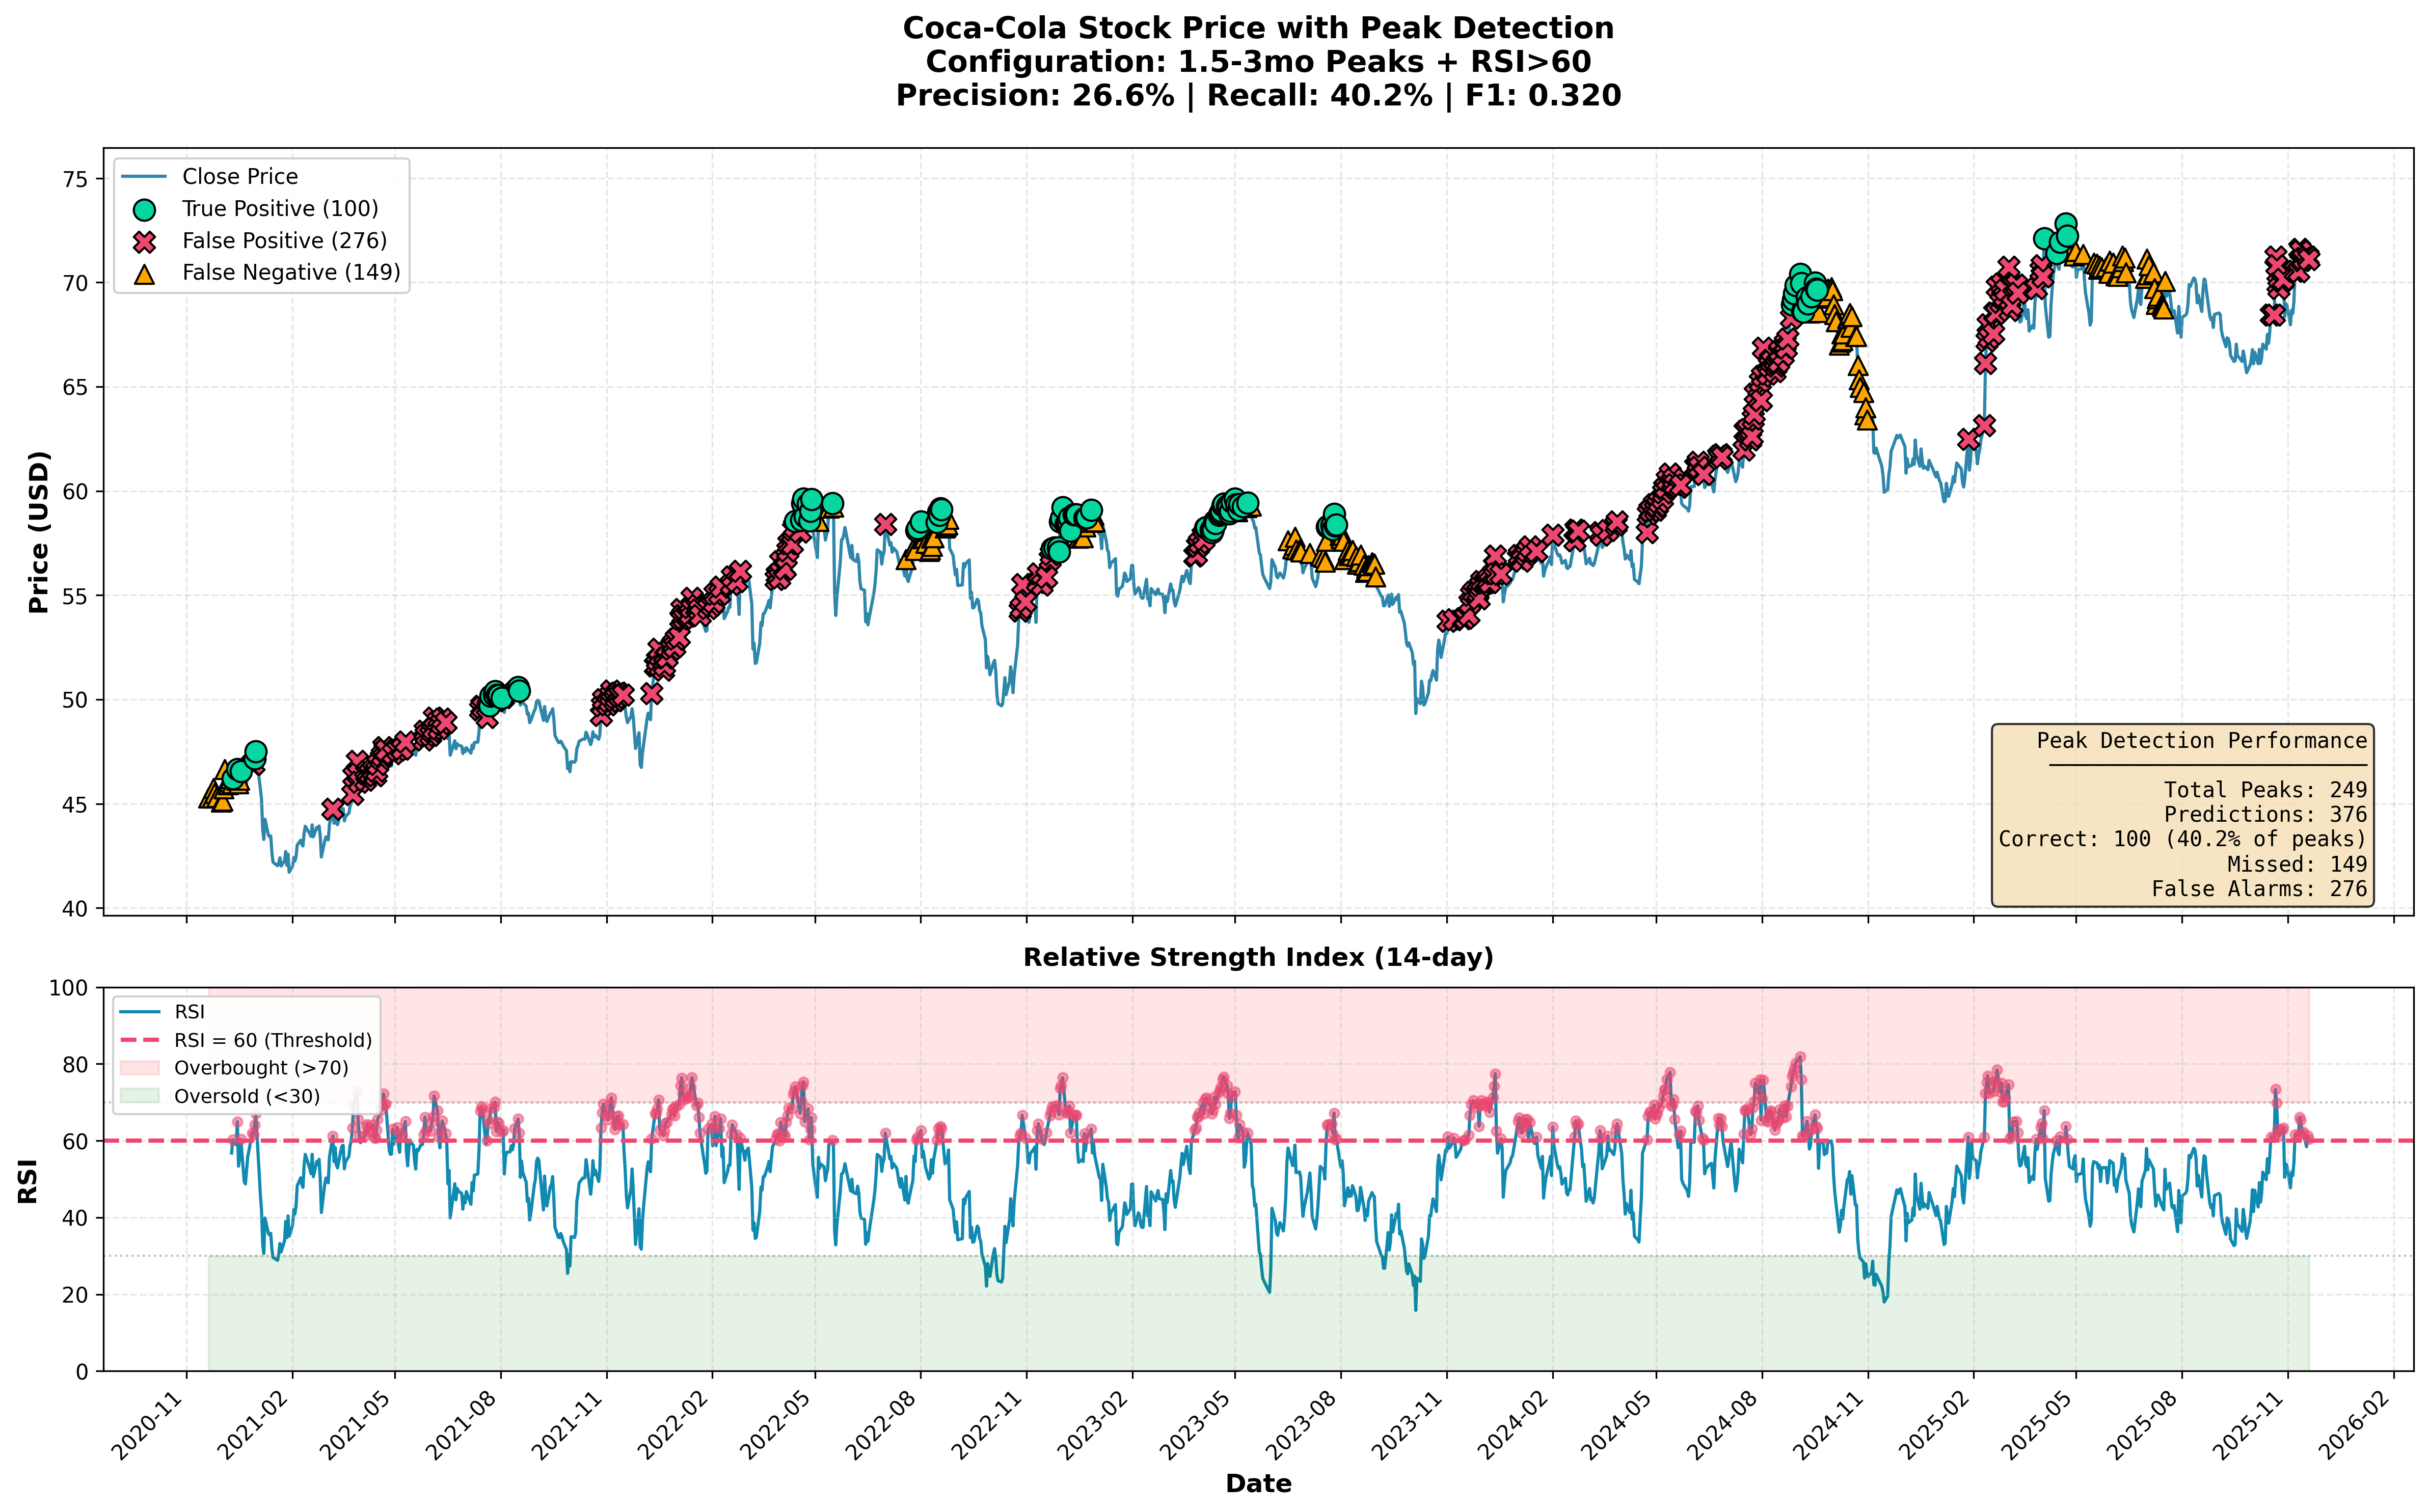
What this chart shows: The top panel displays Coca-Cola's stock price over 5 years with peak detection results overlaid. Green circles (●) mark the 100 correct predictions—times when RSI exceeded 60 AND the price was truly a peak. Red X's (✕) show the 276 false alarms where RSI exceeded 60 but no peak occurred. Orange triangles (▲) indicate the 149 missed peaks where RSI stayed below 60.
The bottom panel shows the RSI indicator itself, with the horizontal line at 60. Notice how frequently RSI crosses above and below this threshold—that's why we get so many signals (both true and false).
The verdict: RSI > 60 catches about 4 out of 10 peaks, but generates nearly 3 false alarms for every correct prediction. It's better than random guessing, but only by about 34%.
The Most Practical Strategy
What if we're more conservative? The 2-4 month peaks with RSI > 70 configuration shows different tradeoffs:
- Precision: 26.0%
- Recall: 13.8%
- Improvement over random: 2.25x better
Here, we're using a higher RSI threshold (70 instead of 60) and looking for longer-term peaks:
- ✅ Correctly identified: 20 peaks
- ❌ Missed: 125 peaks
- ⚠️ False alarms: 57 times
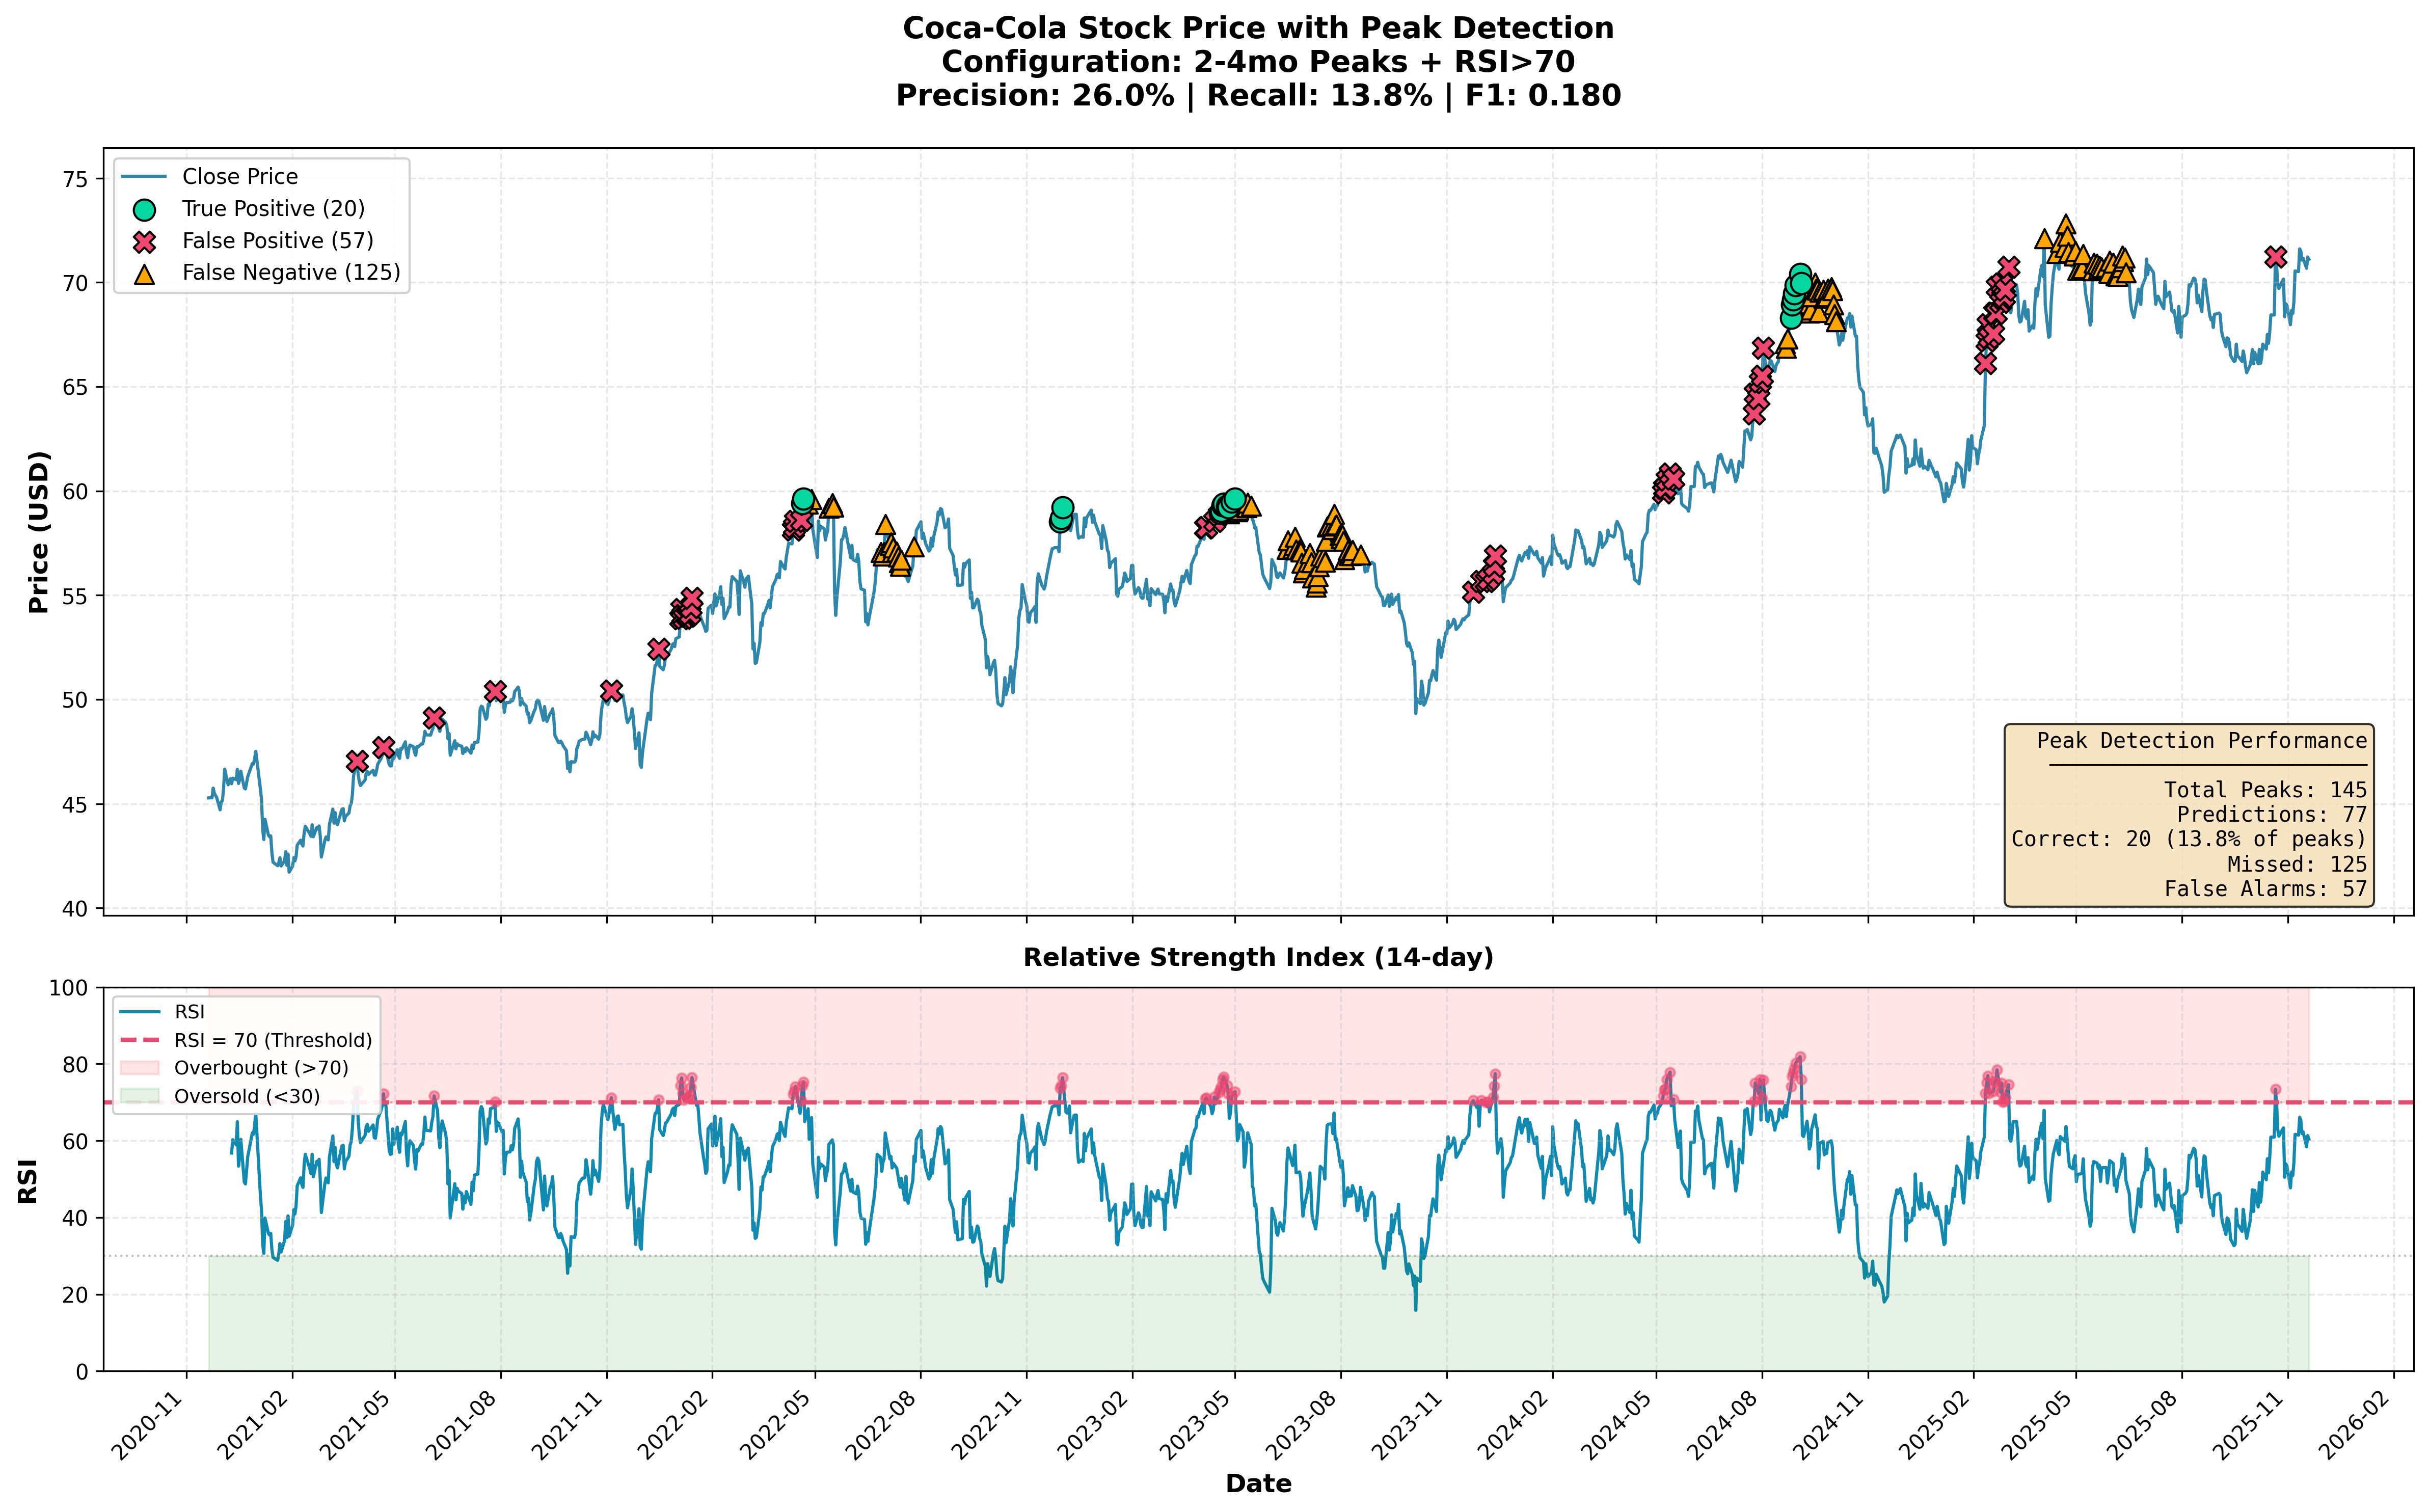
What this chart shows: Notice the dramatic difference from the first chart. With RSI > 70 as our threshold (shown in the bottom panel), we get far fewer signals overall. The top panel shows only 20 green circles (correct predictions) and 57 red X's (false alarms)—much cleaner than before. However, we now miss 125 peaks (orange triangles), which is -24 more than the aggressive strategy.
The verdict: This strategy is 2.25 times better than random guessing—a stronger relative improvement. The precision is similar (26.0% vs 26.6%), but we're more selective. The downside? We miss 86.2% of all peaks.
A Closer Look: What Happens in Real Time
Let's zoom into a specific period to see how this plays out day-to-day:
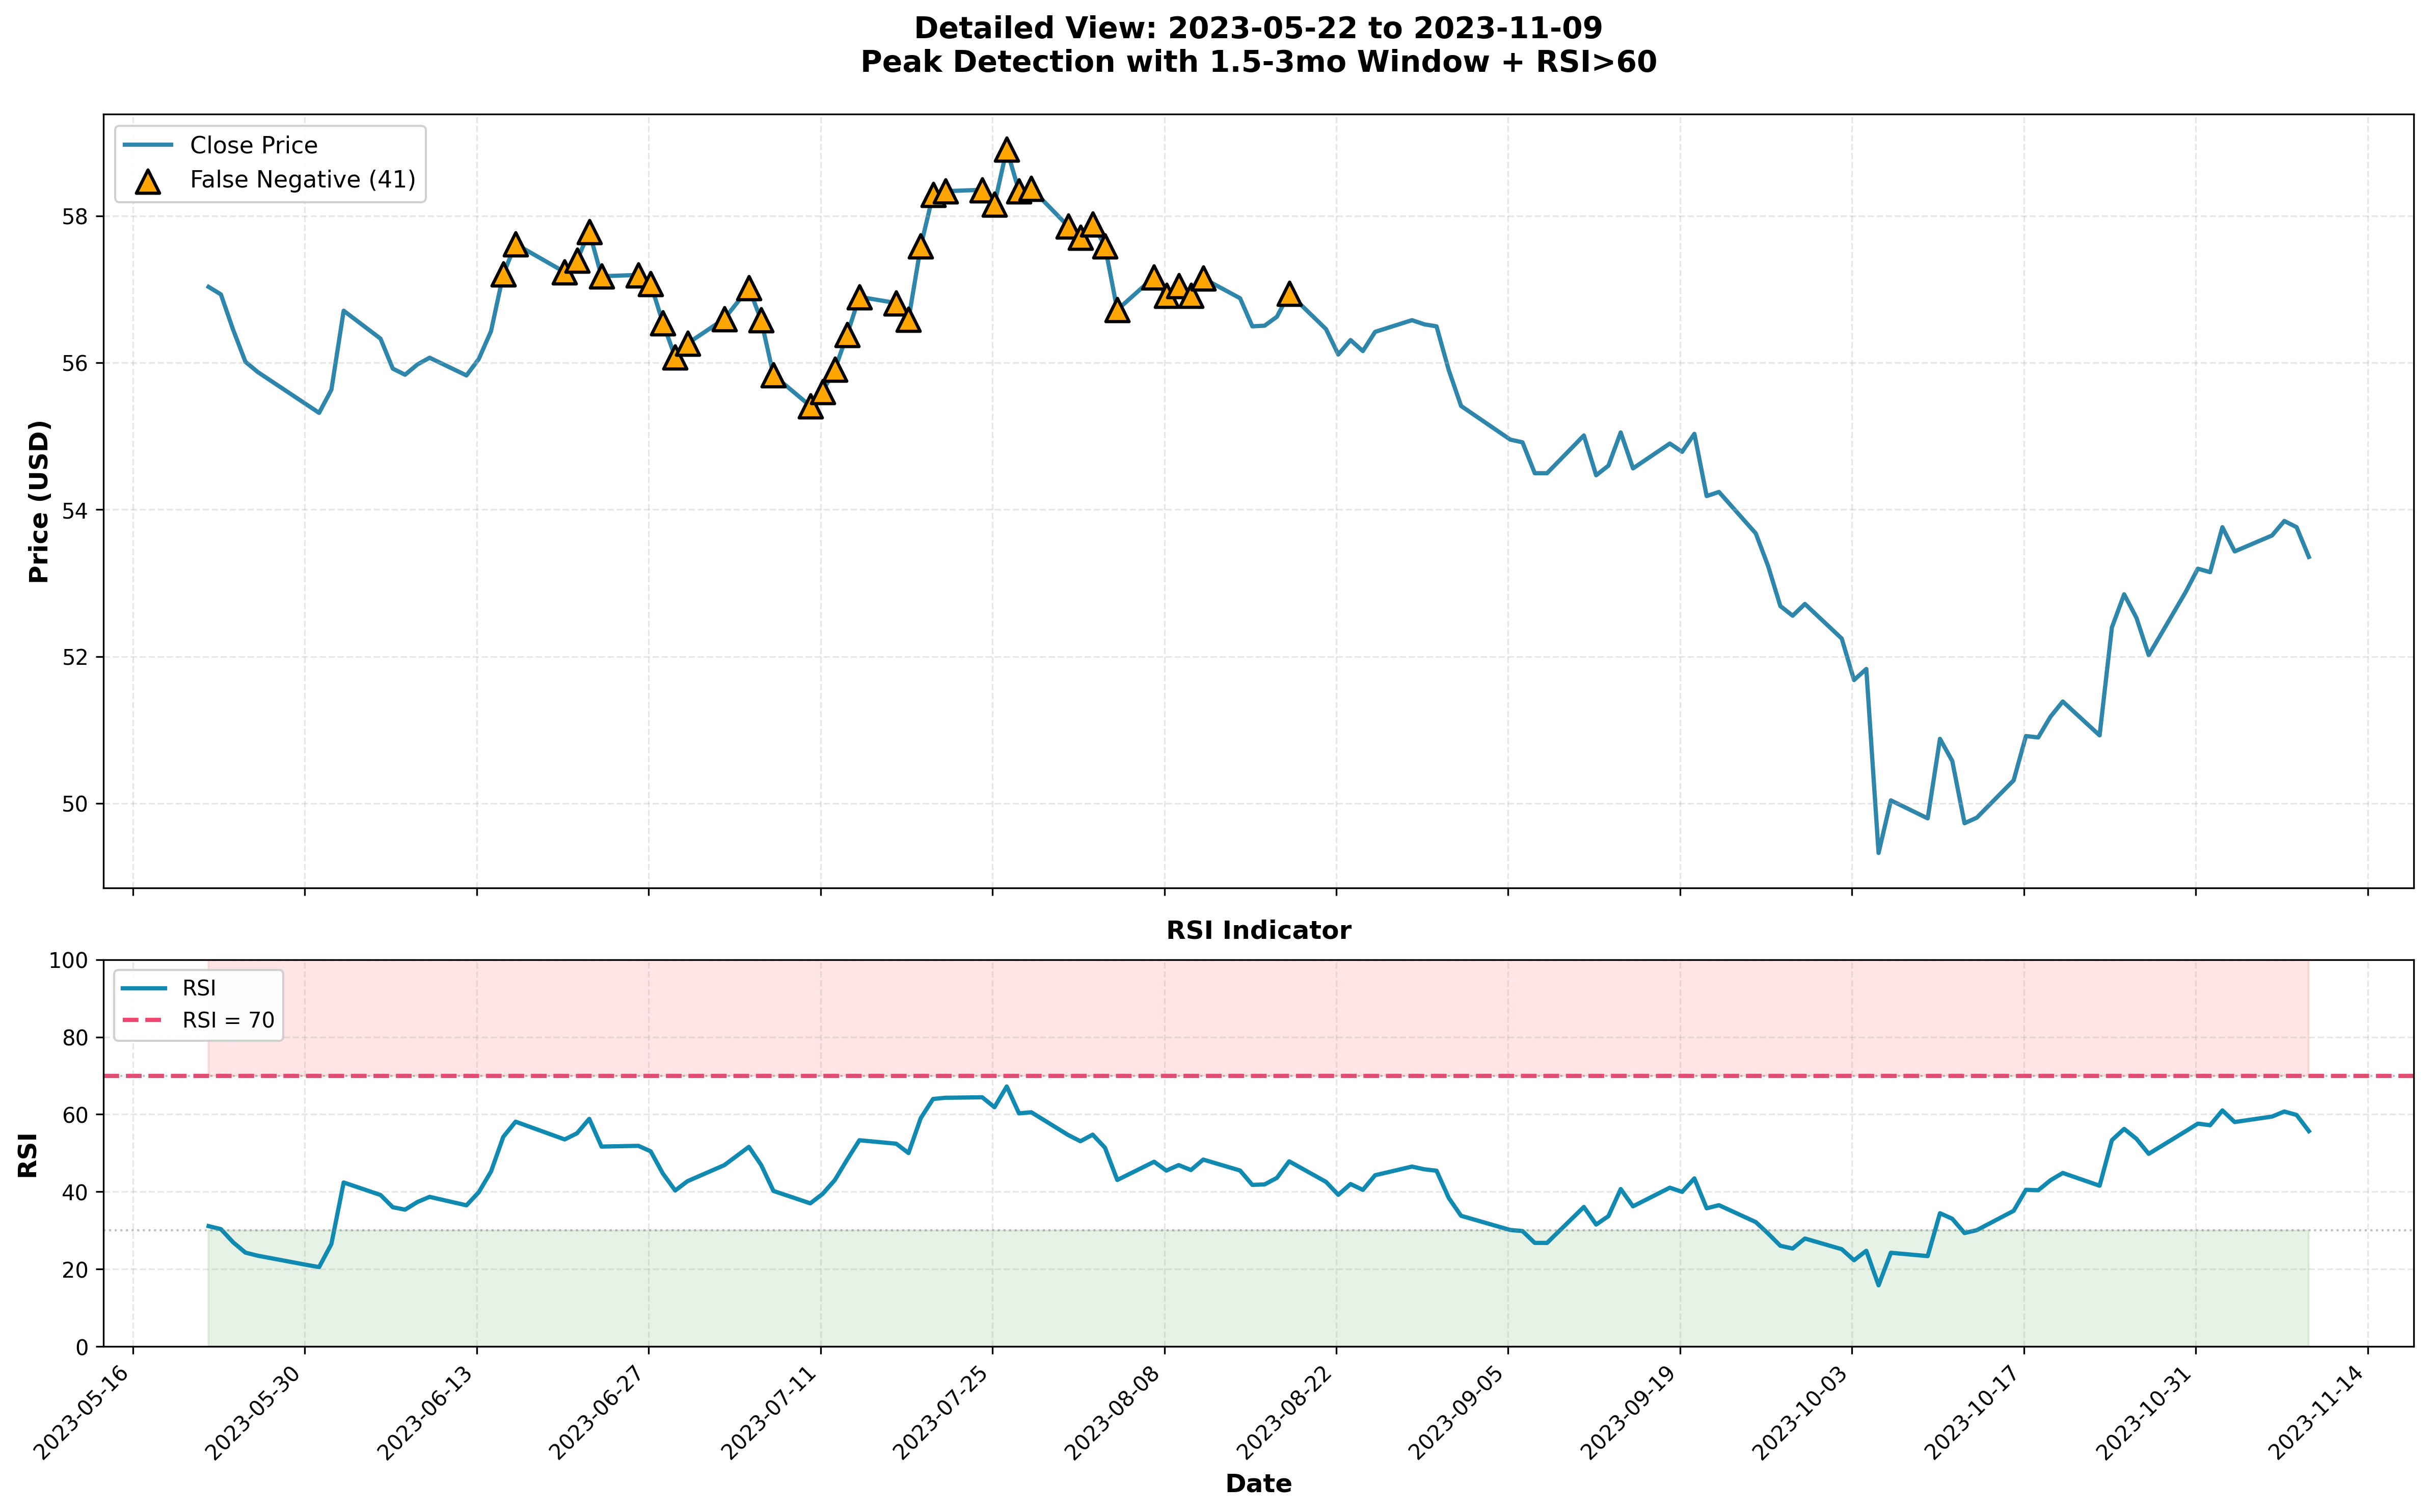
What this chart shows: This 6-month window reveals the challenge of peak prediction. During the May-July 2023 period, the price hovered in a relatively narrow range ($56-59), but our forward-looking peak definition still identified many points as "peaks" because prices declined afterward.
The 41 orange triangles clustered here are false negatives—actual peaks (by our definition) that RSI failed to predict. Why? Look at the bottom panel: RSI stayed mostly in the 40-60 range during this period, never hitting our 60 threshold. The stock wasn't showing strong momentum, yet those prices turned out to be local peaks in hindsight.
This illustrates a fundamental challenge: RSI measures current momentum, but peaks are defined by future price action.
The Surprising Failure: RSI at 65
Here's something unexpected: RSI > 65 consistently performed WORSE than random guessing.
For the 1-2 month window with RSI > 65:
- Precision: 18.9% (vs random: 21.6%)
- Improvement: 0.88x (below 1.0 means worse than random!)
This suggests potential anti-correlation at this specific threshold. When RSI hits the 65-70 range, it might actually indicate continued momentum rather than an imminent peak.
The Extreme Threshold: RSI > 80
What about being extremely selective? RSI > 80 shows impressive relative improvement:
- 2 total signals across 1,255 trading days
- 2 correct predictions
- Precision: 100.0%
- Improvement over random: 5.0x
Sounds great, right? The problem: it only triggers 2 times in 5 years and catches just 0.8% of actual peaks. Perfect precision with 0.8% recall isn't useful in practice.
Comparing Against Random: The Reality Check
Why do I keep mentioning "random guessing"? Because it's the critical benchmark.
The mathematical truth about random predictions:
- If 19.8% of all days are peaks (the "base rate"), then randomly flagging 19.8% of days as peaks will achieve 19.8% precision
- Any predictor must beat this baseline to demonstrate actual skill
For the 1.5-3 month window:
- Base rate: 19.8% of days are peaks
- RSI > 60 precision: 26.6%
- Random precision: 19.8%
RSI > 60 achieves 26.6%, which is 6.8% better than the 19.8% you'd get from random guessing. Modest, but measurable.
Key Findings Summary
After analyzing 1,255 trading days across multiple configurations:
- ✅ RSI has weak predictive power: It performs 1.2-2.3x better than random guessing in optimal configurations
- ⚠️ High false alarm rate: Even the best configurations generate 3-5 false alarms per correct prediction
- 📉 The 65 threshold is worst: Consistently underperforms random guessing across all window sizes
- 🎯 Conservative approach works better: RSI > 70 on longer windows (2-4 months) shows 2.25x improvement over random
- ❌ Not reliable standalone: With 26.6% precision at best, RSI alone cannot reliably predict peaks
Practical Implications for Traders
Should you use RSI to predict peaks?
The honest answer: Use it as one signal among many, not as a standalone predictor.
- For aggressive traders: RSI > 60 might help flag potential peaks worth monitoring, but expect many false alarms
- For conservative traders: RSI > 70 provides more reliable signals, but you'll miss most actual peaks
- For all traders: Never rely on RSI alone—the 26.6% precision means 3 out of 4 signals are false
Why is RSI's performance limited?
- Momentum can persist: Just because a stock is "overbought" doesn't mean it can't get more overbought
- Definition mismatch: RSI measures current momentum; peaks are defined by future price action
- Market complexity: Single indicators can't capture all factors driving price movements
Conclusion
This analysis of 1,255 trading days reveals that RSI has measurable but limited ability to predict price peaks. The best configuration (1.5-3 month peaks, RSI > 60) achieves 26.6% precision and catches 40.2% of peaks—modestly better than random guessing but far from reliable.
The charts tell the story: those red X's and orange triangles outnumber the green circles in every configuration. RSI can be a useful filter in a comprehensive trading strategy, but it's not the crystal ball that some traders hope for.
The bottom line: Technical indicators like RSI provide a mathematical framework for analyzing price action, but markets are complex systems influenced by countless factors. Use RSI as one input in your decision-making process, not as a definitive predictor.
Methodology note: All analysis was performed on Coca-Cola (KO) stock data from 2020-11-20 00:00:00-05:00 to 2025-11-19 00:00:00-05:00. Results may vary for other stocks, market conditions, and time periods. Past performance does not guarantee future results. This article is for educational purposes only and should not be considered investment advice.
Analysis code and data available at: [GitHub repository link]
Comments (0)
No comments yet. Be the first to comment!