Buy the Dip vs. Buy the Peak: Which Strategy Actually Wins?
A data-driven comparison of two contrarian investment approaches
The Conventional Wisdom
"Buy the dip!" It's advice you've probably heard countless times. When prices fall, that's your opportunity to buy low. It sounds logical, even obvious. But what if I told you that buying when prices are high—buying the peak—could be just as effective, or even better in some cases?
I tested both strategies using real Tesla stock data from November 2020 to November 2025, investing $100 every month. The results might surprise you.
The Experiment Setup
Instead of relying on gut feelings, I designed a systematic backtest with clear rules. Here's how it worked:
The Investment Plan:
- Invest $100 at the beginning of each month
- Total investment period: 61 months
- Total capital invested: $6,100
- Stock analyzed: Tesla (TSLA)
The Strategies:
I tested four variations based on two different moving averages (50-day and 200-day):
-
Buy the Dip (95% threshold): Only buy when the stock price falls to 95% or below the moving average. This captures genuine dips below the trend.
-
Buy the Peak (105% threshold): Only buy when the stock price rises to 105% or above the moving average. This follows momentum and strength.
Each strategy keeps cash until conditions are met, then uses all available cash to buy shares.
What Actually Happened
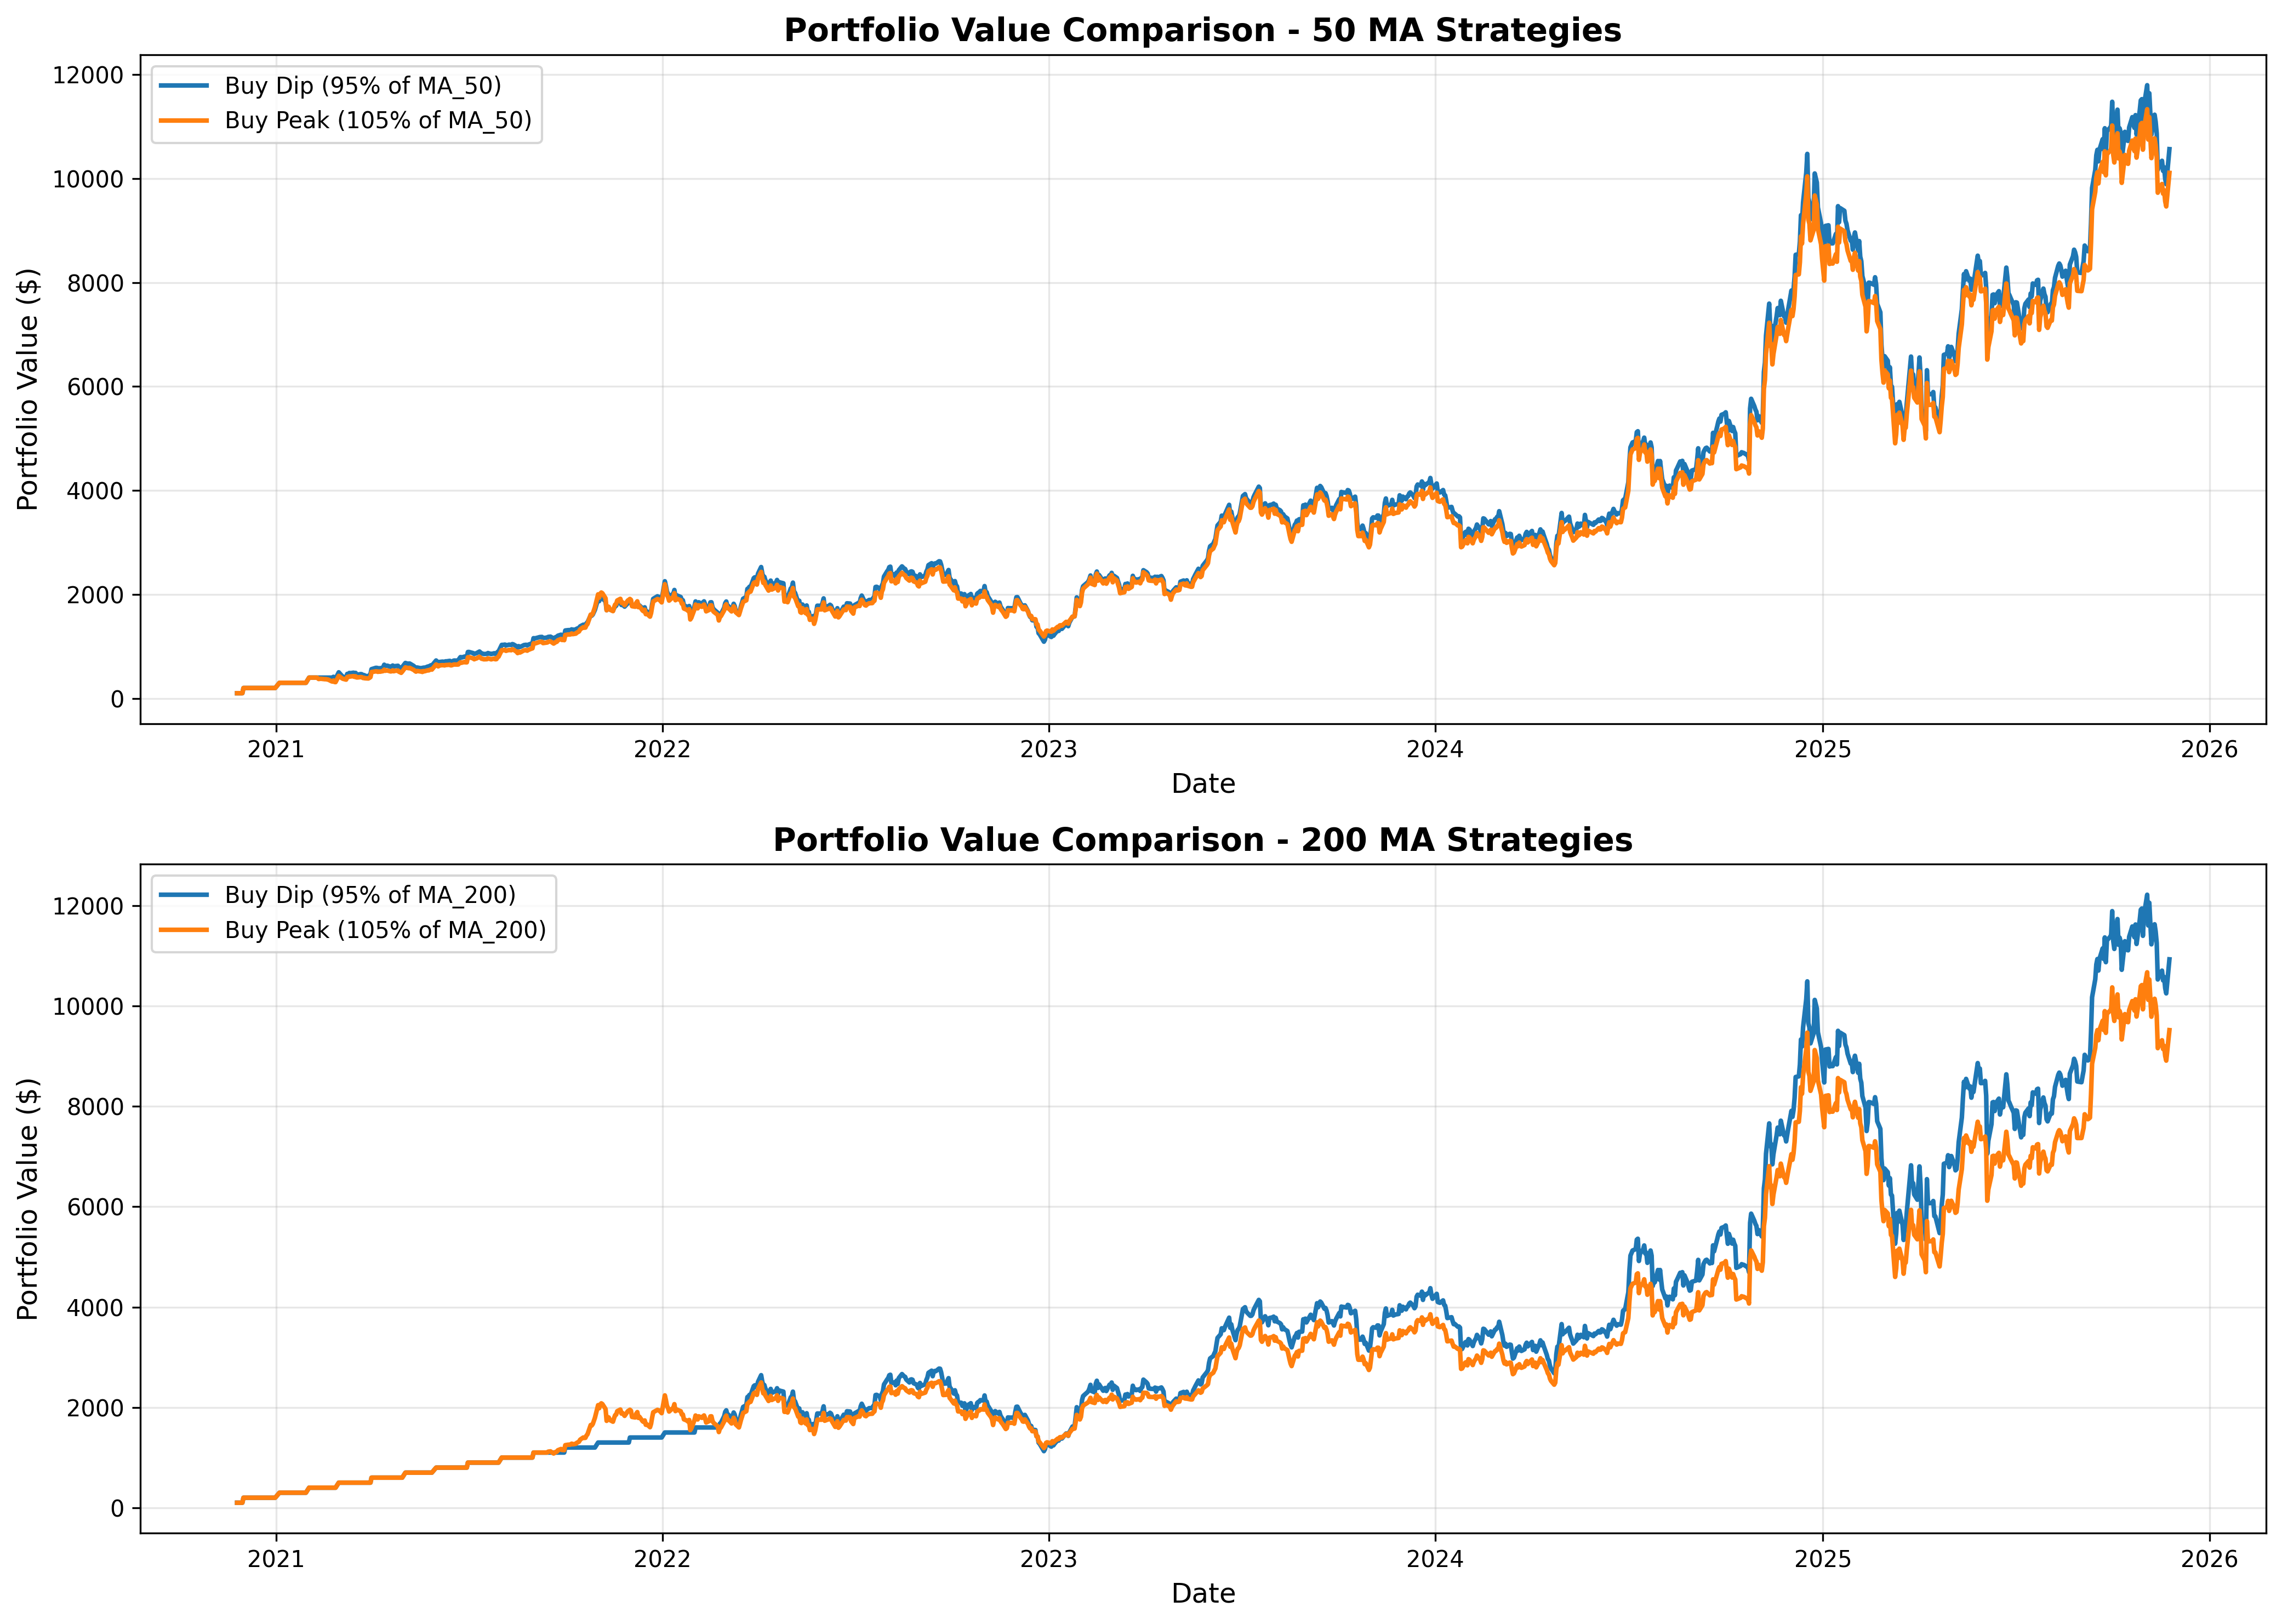
The 50-Day Moving Average Strategies
The 50-day moving average reacts quickly to price changes, making it more sensitive to short-term movements.
Buy the Dip (50 MA):
- Number of purchases: 36
- Final portfolio value: $10,565.47
- Return: 73.2%
Buy the Peak (50 MA):
- Number of purchases: 42
- Final portfolio value: $10,108.78
- Return: 65.7%
The buy-the-dip strategy with the 50-day MA made 36 purchases and ended with $10,565.47. The buy-the-peak strategy made 42 purchases and finished at $10,108.78.
Surprisingly, the difference is only $456.69—just 4.5% apart.
The 200-Day Moving Average Strategies
The 200-day moving average is slower and captures longer-term trends, making it less reactive to daily noise.
Buy the Dip (200 MA):
- Number of purchases: 30
- Final portfolio value: $10,930.37
- Return: 79.2%
Buy the Peak (200 MA):
- Number of purchases: 31
- Final portfolio value: $9,519.13
- Return: 56.1%
Here we see a bigger gap. The buy-the-dip strategy outperformed, ending at $10,930.37 compared to $9,519.13 for buy-the-peak—a difference of $1,411.24.
When Did These Strategies Buy?
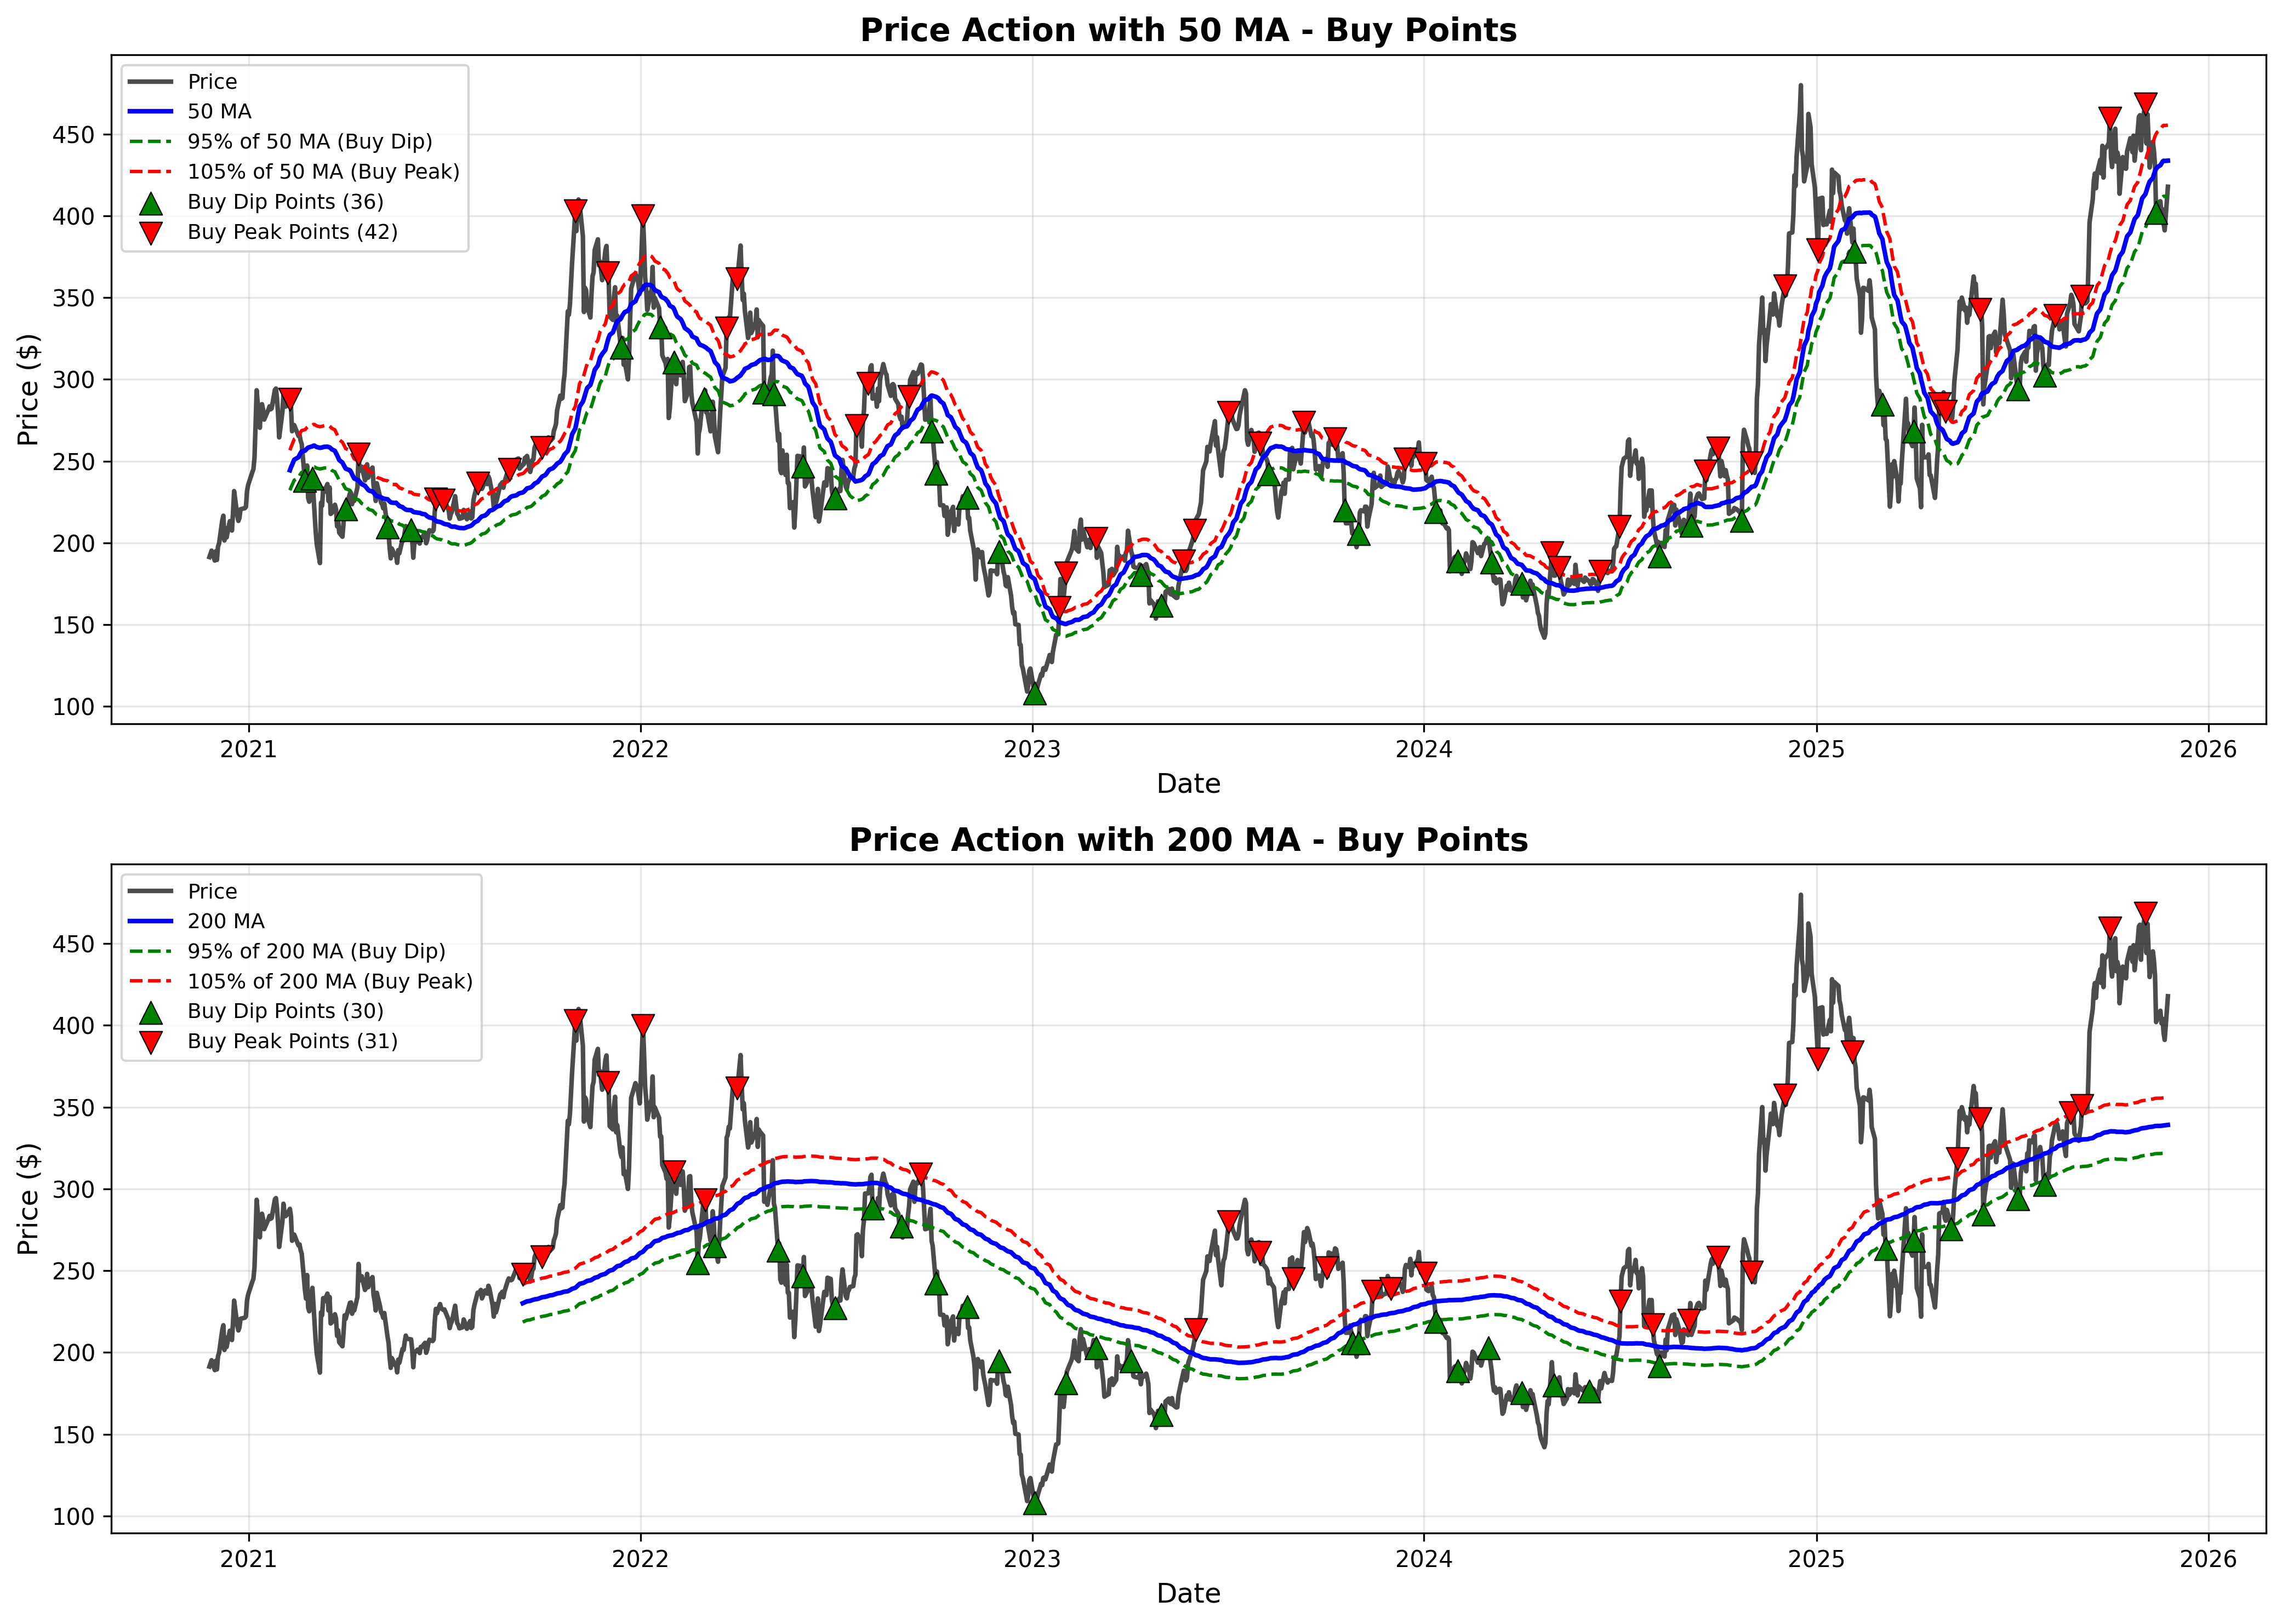
The chart above reveals the timing patterns of each strategy. Let me break down what you're seeing:
Understanding the Lines:
- Black line: The actual Tesla stock price, showing day-to-day movements
- Blue line: The moving average (50-day on top chart, 200-day on bottom)
- Green dashed line: The 95% threshold—this is where "buy the dip" opportunities appear
- Red dashed line: The 105% threshold—this is where "buy the peak" opportunities appear
Where the Buys Happen:
- Green upward triangles (▲): Buy the Dip purchases occur when the black price line falls to or below the green dashed line (95% of MA). Notice these purchases cluster during price declines and corrections.
- Red downward triangles (▼): Buy the Peak purchases occur when the black price line rises to or above the red dashed line (105% of MA). These purchases happen during rallies and uptrends.
Key Observations:
In the top chart (50-day MA), you'll see both green and red triangles scattered throughout the timeline. The Buy the Dip strategy made 36 purchases at points where price dipped below the green threshold, while Buy the Peak made 42 purchases when price broke above the red threshold. The strategies are almost mirror images—when one is buying, the other is usually waiting.
In the bottom chart (200-day MA), the pattern is clearer but less frequent. Buy the Dip made 30 purchases strictly below the green 95% line, while Buy the Peak made 31 purchases strictly above the red 105% line. Notice the long gaps between purchases—this longer-term moving average creates fewer signals, but potentially more significant entry points.
The space between the green and red dashed lines is the "no trade zone" where neither strategy buys—prices are too close to the moving average to trigger either signal.
The Cash Accumulation Story
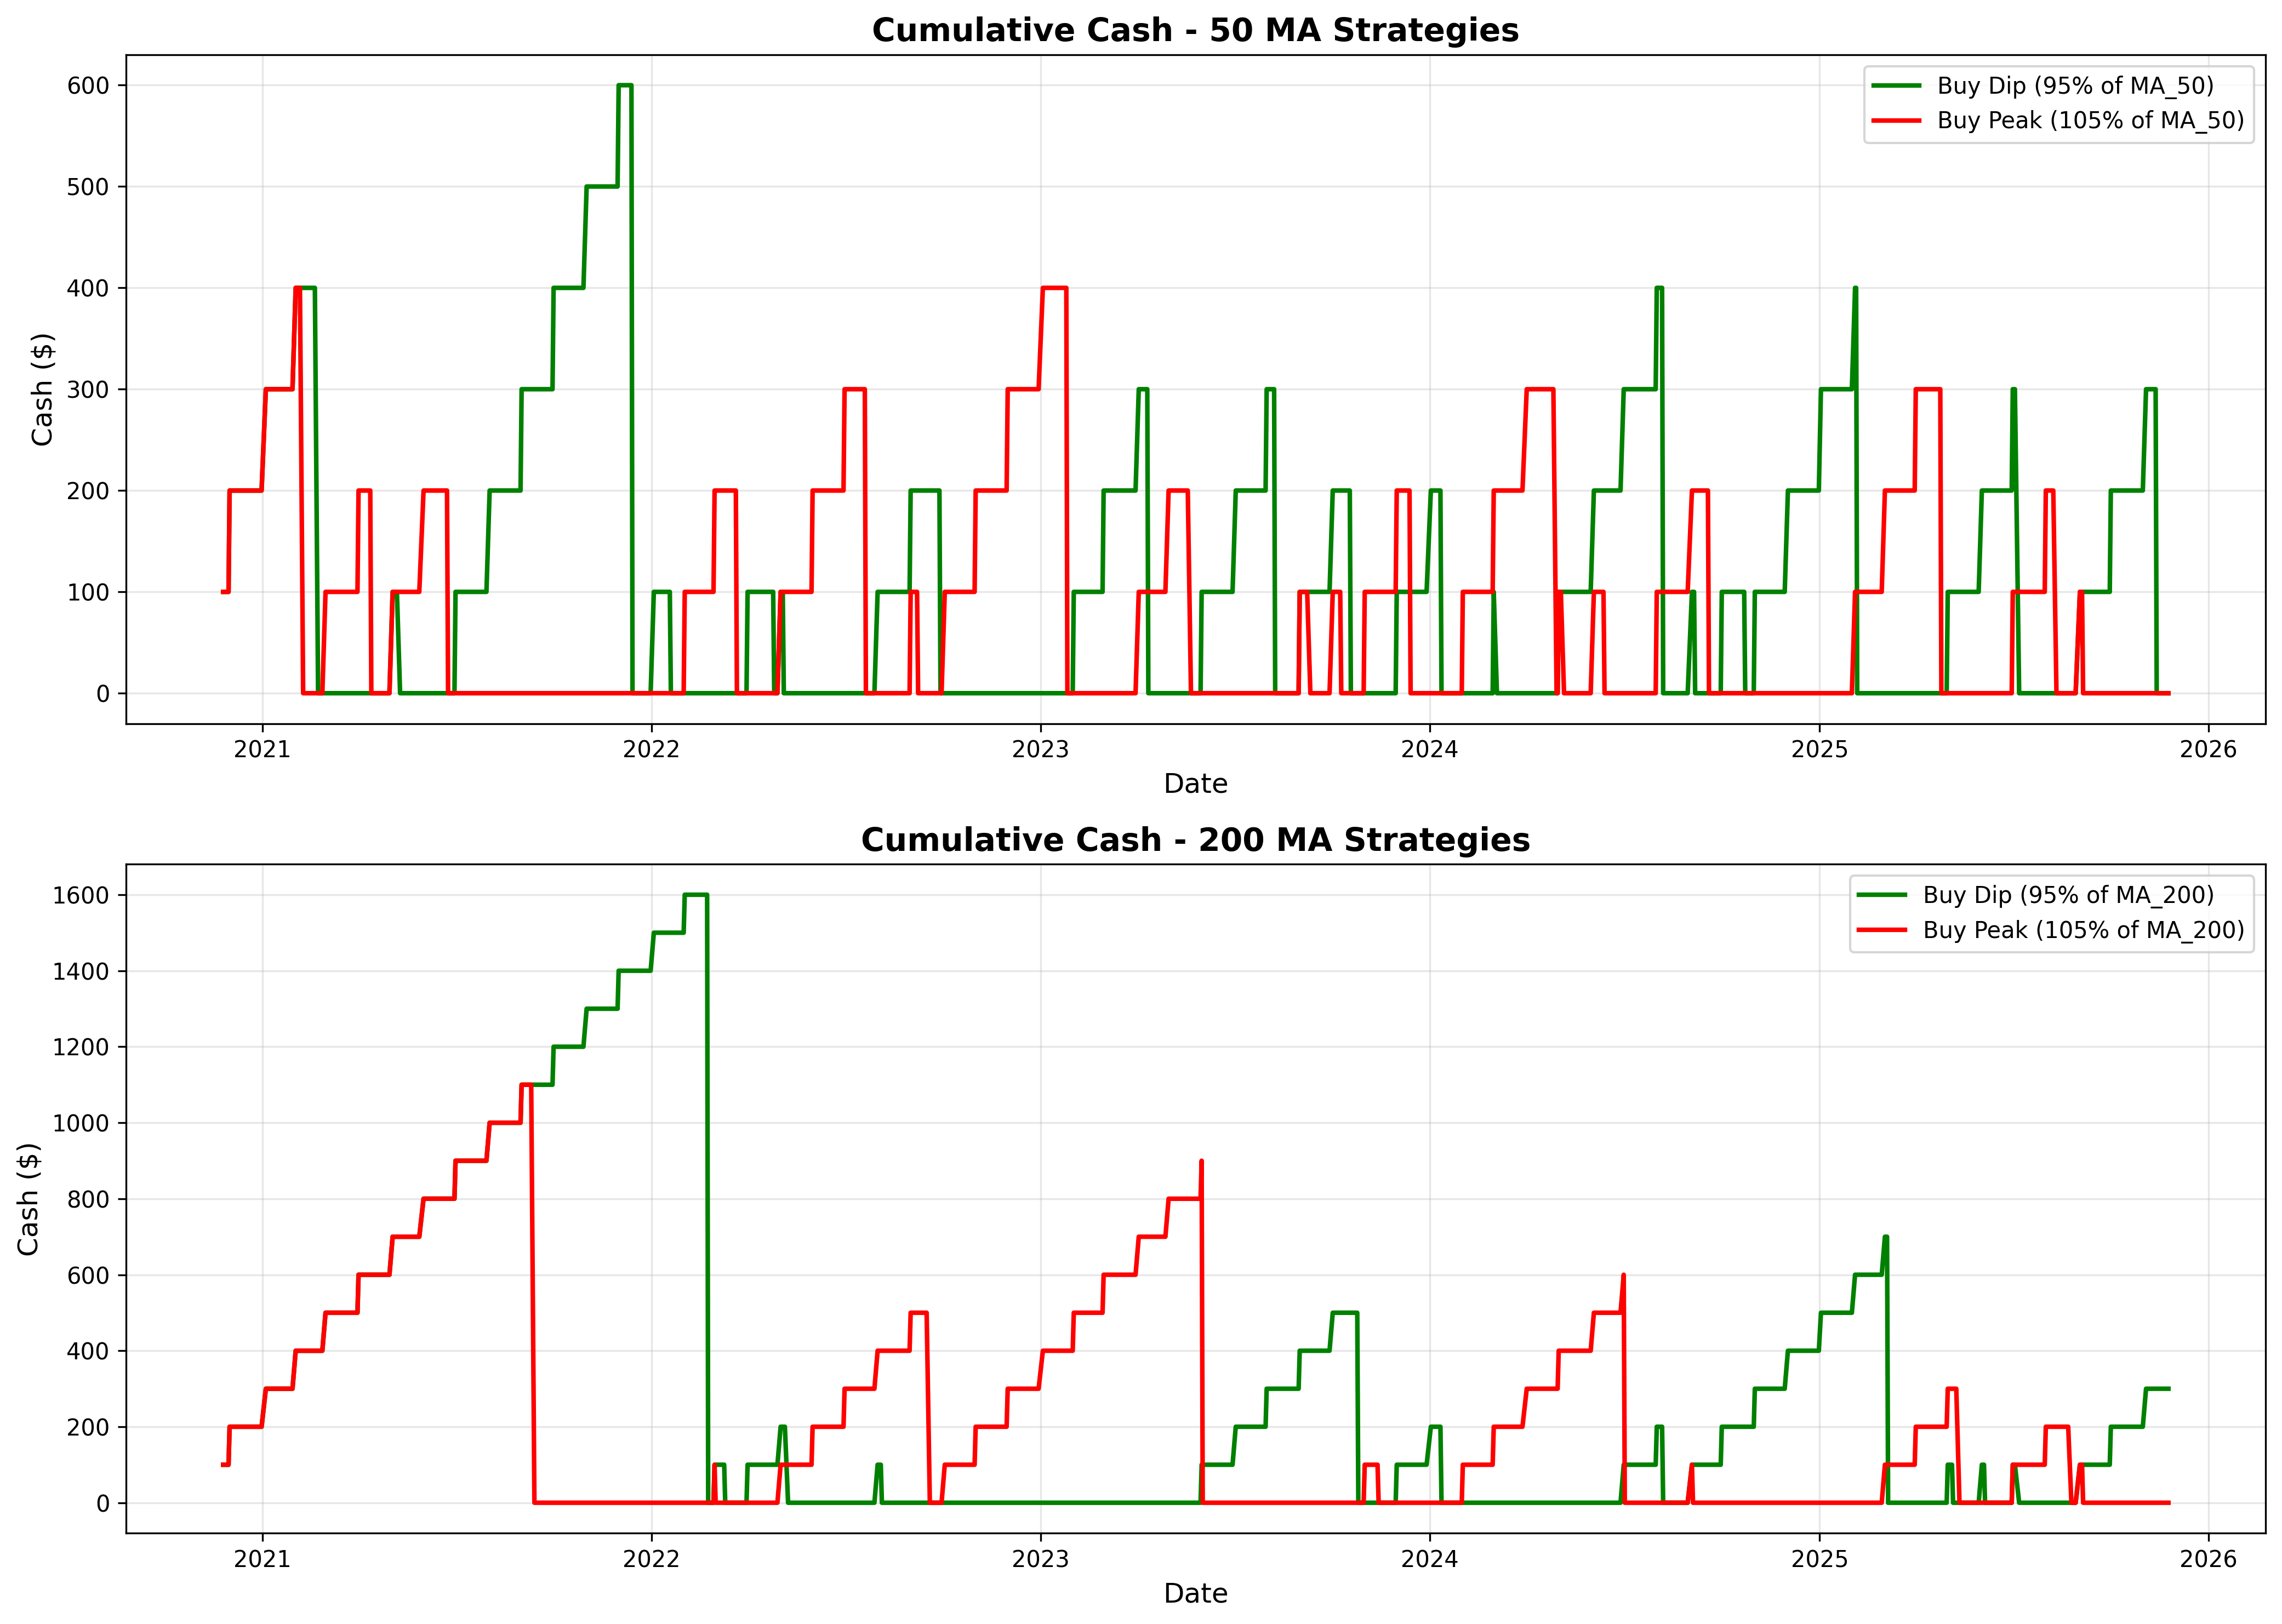
These cash charts tell a fascinating story about when each strategy was "in action" versus "waiting."
The 50-Day MA patterns (top chart): Both strategies show frequent ups and downs, with cash rarely exceeding $600. This indicates regular buying opportunities with both approaches—neither strategy left money sitting idle for too long.
The 200-Day MA patterns (bottom chart): Here's where it gets interesting. The buy-the-dip strategy (green line) accumulated up to $1,600 at its peak, waiting months for the right entry point. When Tesla's price stayed above 95% of the 200-day MA throughout 2022, cash just kept building.
In contrast, the buy-the-peak strategy (red line) accumulated $1,100 during Tesla's extended decline in 2022-2024, when prices rarely broke above the 105% threshold.
These cash patterns reveal a key insight: both strategies experience long waiting periods, just at opposite times in the market cycle.
The Surprising Truth
So, is buying the dip actually far superior? The data says: it depends.
With the 200-day moving average, buy-the-dip won decisively, gaining 79.2% versus 56.1% for buy-the-peak. But with the 50-day moving average, the gap nearly disappeared—73.2% versus 65.7%.
The best performer overall was Buy Dip (200 MA) at $10,930.37, while the worst was Buy Peak (200 MA) at $9,519.13.
But here's what really matters: all four strategies delivered positive returns. Every single approach turned $6,100 of monthly investments into over $9,519.
Why This Happened
Several factors explain these results:
1. Time in the market vs. timing the market Both strategies kept you invested. The buy-the-peak approach wasn't buying at literal tops—it was buying during strength and uptrends. The buy-the-dip wasn't catching falling knives—it was buying when prices were below average but not crashing.
2. Dollar-cost averaging in disguise Both strategies spread purchases across 30 to 42 different dates. This natural diversification across time reduced the impact of any single purchase.
3. The power of staying invested Tesla's stock price went from $191.33 to $417.78 during this period. Both strategies captured that overall growth, just through different entry points.
Practical Implications
For investors who love buying dips: You're not wrong—especially with longer-term (200-day) moving averages. But recognize that you'll experience painful periods of cash accumulation while watching prices rise without you.
For momentum investors who buy strength: You're not crazy either. Buying during uptrends can work, particularly with shorter-term (50-day) signals. Just be prepared to sit out extended downturns.
For everyone: The moving average timeframe matters more than whether you buy dips or peaks. The 200-day MA strategies showed the largest performance spread (23.1 percentage points), while 50-day MA strategies were nearly identical (7.5 percentage points apart).
Conclusion
The conventional wisdom that "buying the dip" is obviously superior doesn't hold up as strongly as you might expect. Yes, it outperformed in this test—particularly with the 200-day moving average—but the margins were closer than most investors would guess.
The real lesson isn't about dips versus peaks. It's about having a systematic approach and sticking with it. All four strategies worked because they:
- Invested consistently ($100/month)
- Followed clear rules (objective entry signals)
- Stayed invested in a growing asset (Tesla stock)
- Avoided emotional decisions
The worst enemy of investment returns isn't buying at the "wrong" time—it's not buying at all, or panic selling when your strategy faces its inevitable rough patches.
Whether you prefer buying dips or buying momentum, the data shows both can work. The key is choosing one approach and maintaining discipline, especially when the cash accumulation charts look uncomfortably steep.
All data and charts generated from backtesting on Tesla stock data from November 2020 to November 2025.
Comments (0)
No comments yet. Be the first to comment!