Beyond the AI Bubble: A Data-Driven Guide to Smart Portfolio Diversification
Published: November 15, 2025
Introduction: The AI Investment Dilemma
If you've been following the stock market over the past two years, you've likely noticed the explosive growth of AI-related stocks. Companies like NVIDIA, Microsoft, and Meta have delivered spectacular returns, making AI stocks the darling of Wall Street. But as the old saying goes: "What goes up must come down." Many investors are now asking a critical question: Are we in an AI bubble, and how can I protect my portfolio?
The good news? You don't have to abandon AI stocks entirely. The answer lies in smart diversification — spreading your investments across different sectors to balance risk and reward. In this article, we'll analyze real data from a 2-year study of S&P 500 stocks to show you exactly how diversification works and which stocks you should consider.
The AI Portfolio: Impressive Returns, But at What Cost?
Let's start by examining a hypothetical "AI Portfolio" consisting of five AI powerhouses:
- NVIDIA (NVDA) — GPU and AI infrastructure leader
- Microsoft (MSFT) — OpenAI partner and Azure AI provider
- Alphabet/Google (GOOGL) — Gemini, TPU, AI advertising
- Meta (META) — LLaMA development and AI recommendations
- AMD (AMD) — AI accelerator MI300 series
If you invested $10,000 equally across these five stocks in November 2023, here's what happened:
- Final Value: $22,497.12
- Total Return: 124.97%
- Annualized Return: 44.87%
- Sharpe Ratio: 1.4072
Impressive, right? But here's the catch: this portfolio came with an annualized volatility of 29.04%. That's a wild ride — your portfolio value could swing dramatically from week to week.
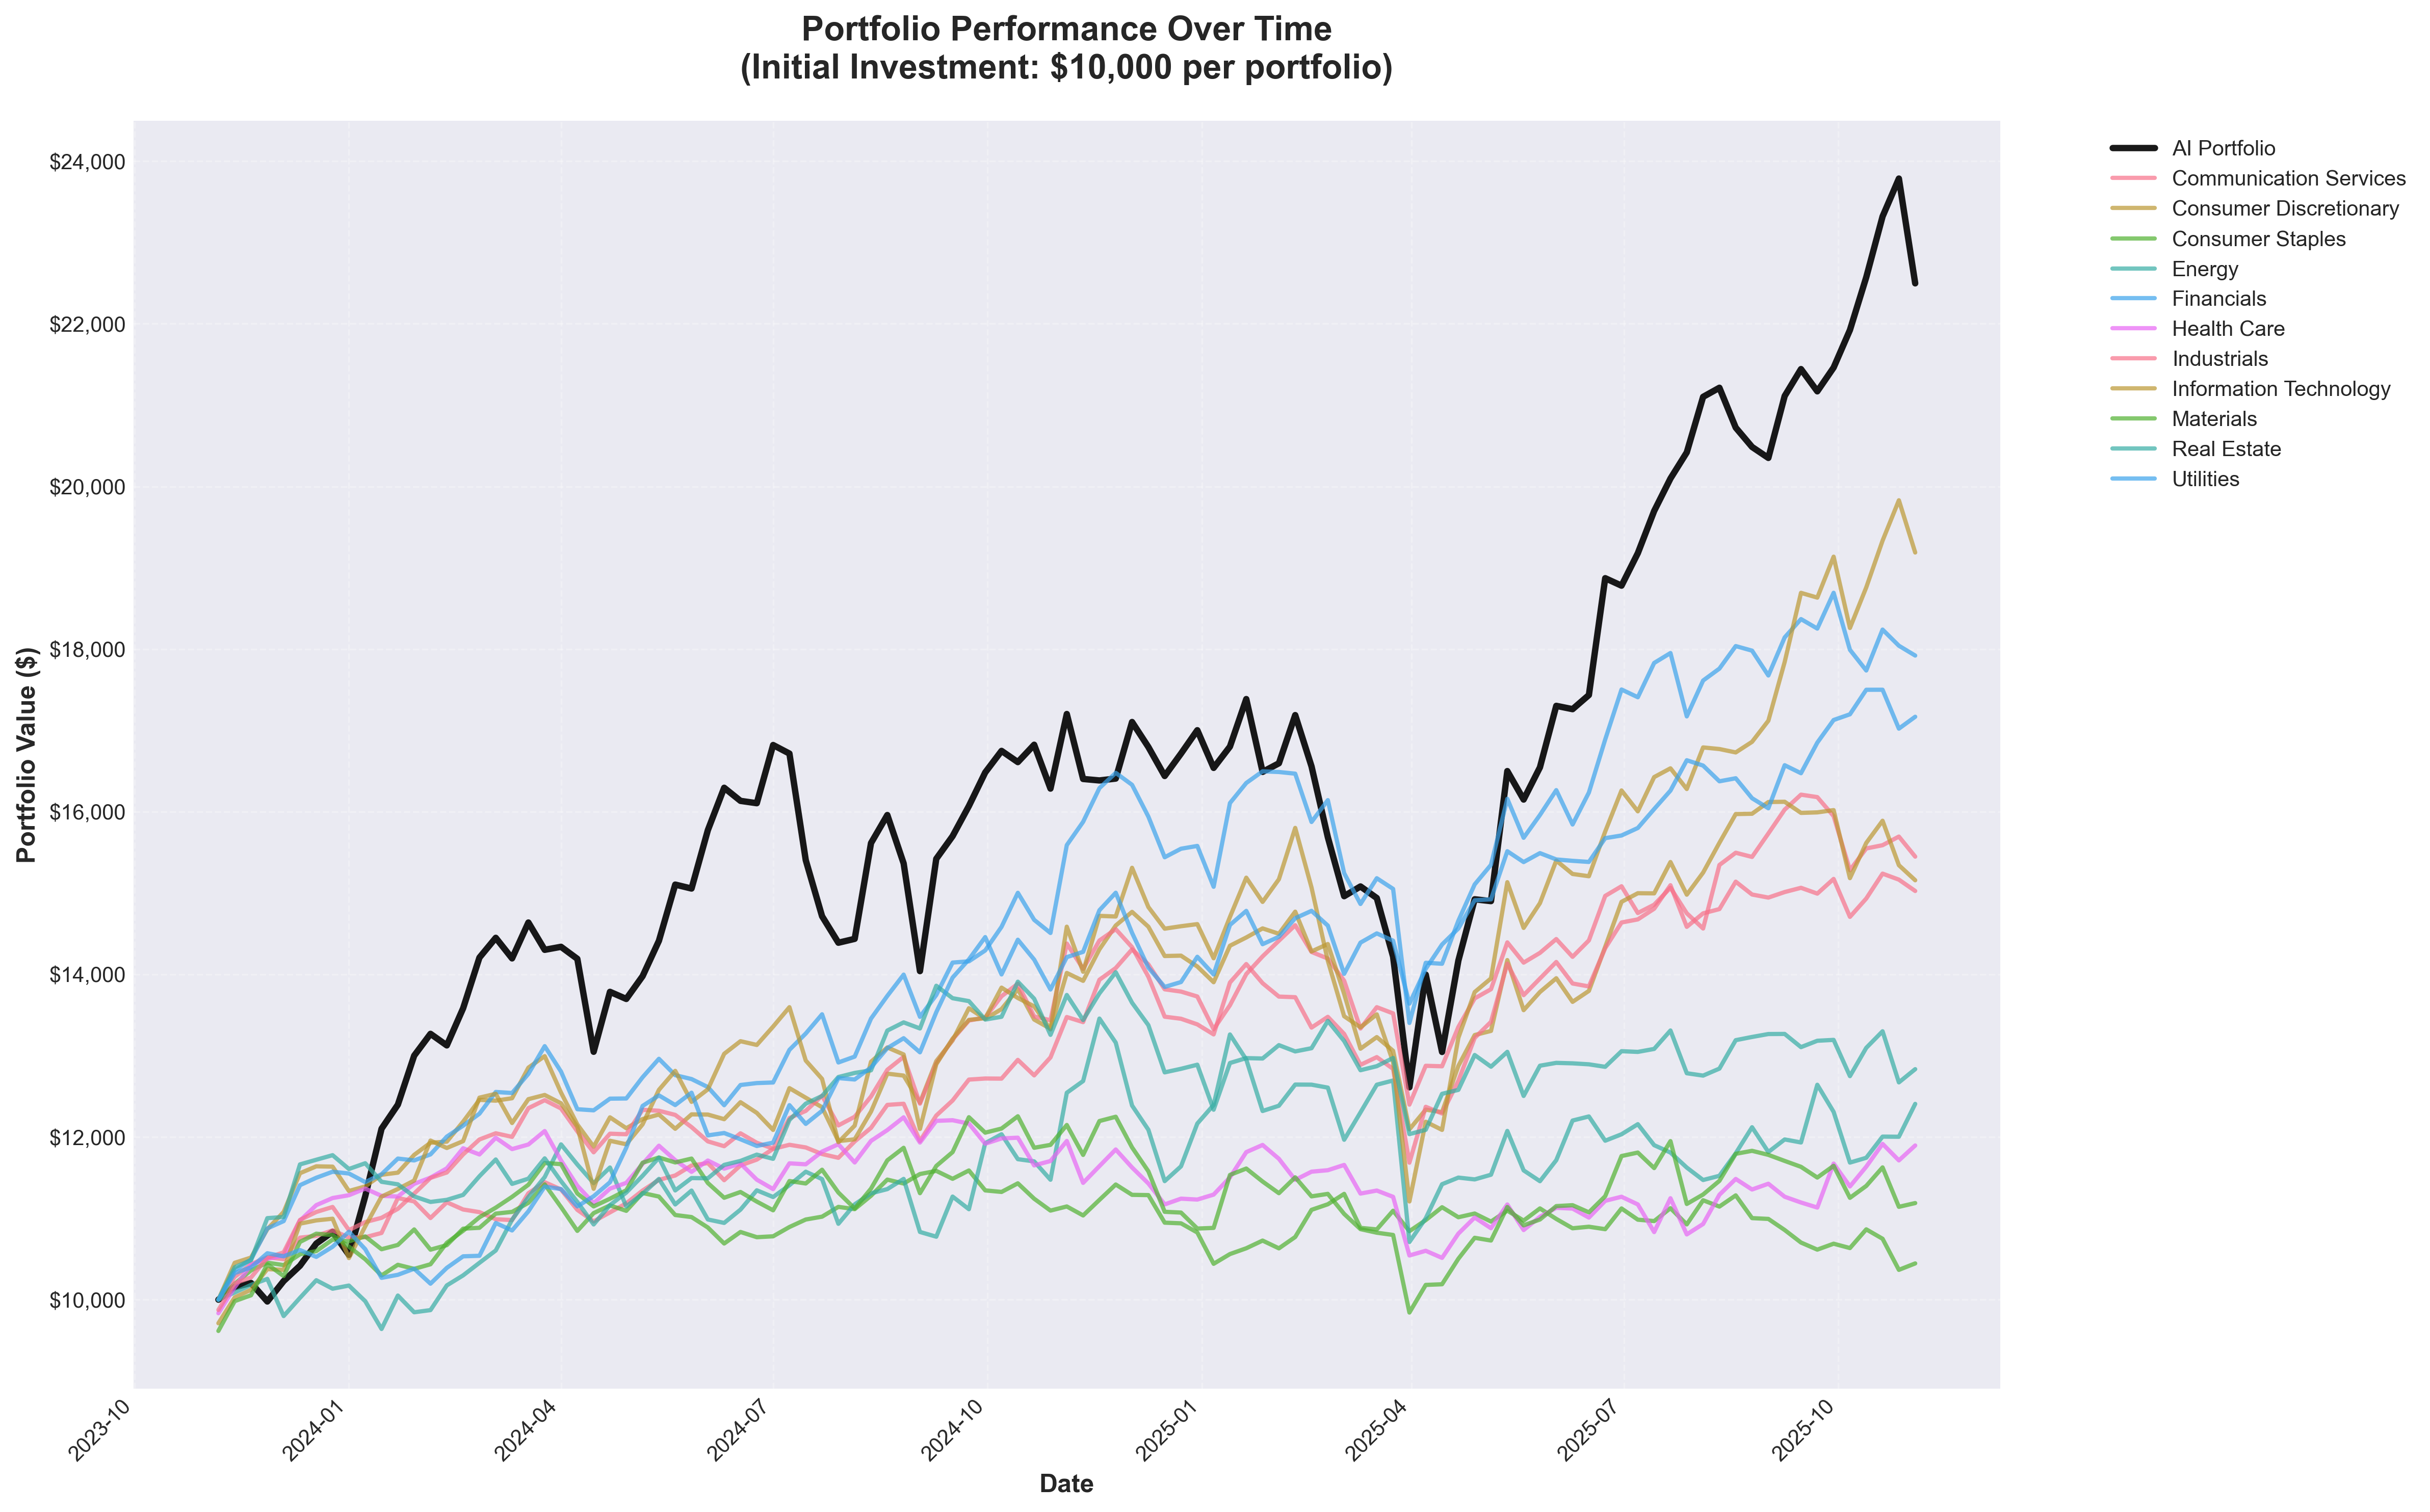 Figure 1: Portfolio performance comparison - AI portfolio (black line) vs. sector portfolios (2023-2025)
As you can see in Figure 1, the AI portfolio (thick black line) shows strong growth but with noticeable ups and downs. Meanwhile, other sector portfolios display different patterns — some with steadier growth, others with lower volatility.
Understanding Risk-Adjusted Returns: The Sharpe Ratio Explained
Before we dive into specific sectors, let's talk about a crucial metric: the Sharpe Ratio. Think of it as a "bang for your buck" measure that answers: "How much return am I getting for each unit of risk I'm taking?"
The Formula (simplified):
Sharpe Ratio = (Return - Risk-Free Rate) / Volatility
What it means:
- Higher Sharpe Ratio = Better risk-adjusted returns
- A Sharpe ratio above 1.0 is considered good
- A Sharpe ratio above 2.0 is excellent
Our AI portfolio has a Sharpe ratio of 1.4072, which is solid but not the best. Some sectors actually offer better risk-adjusted returns!
Sector Analysis: Where Diversification Pays Off
Let's examine how different sectors performed with the same $10,000 investment:
Top Performers by Sharpe Ratio
1. Utilities (Sharpe Ratio: 1.6439)
- Annualized Return: 28.16%
- Annualized Volatility: 14.70%
- Why it matters: Utilities offer stable, predictable cash flows from essential services. In uncertain times, investors flock to defensive sectors like utilities.
2. Financials (Sharpe Ratio: 1.4216)
- Annualized Return: 31.06%
- Annualized Volatility: 19.04%
- Why it matters: Financial stocks benefited from rising interest rates and strong economic growth. Banks and brokerages saw improved profit margins.
3. Communication Services (Sharpe Ratio: 1.2899)
- Annualized Return: 22.85%
- Annualized Volatility: 14.62%
- Why it matters: Streaming services, telecommunications, and digital advertising showed resilience, benefiting from digital transformation trends.
4. Information Technology (Sharpe Ratio: 1.2765)
- Annualized Return: 37.62%
- Annualized Volatility: 26.34%
- Why it matters: Beyond AI hype, the tech sector includes cloud computing, cybersecurity, and enterprise software — areas with sustained demand.
5. Industrials (Sharpe Ratio: 1.1076)
- Annualized Return: 22.41%
- Annualized Volatility: 16.62%
- Why it matters: Infrastructure spending and reshoring of manufacturing boosted industrial stocks, from aerospace to construction equipment.
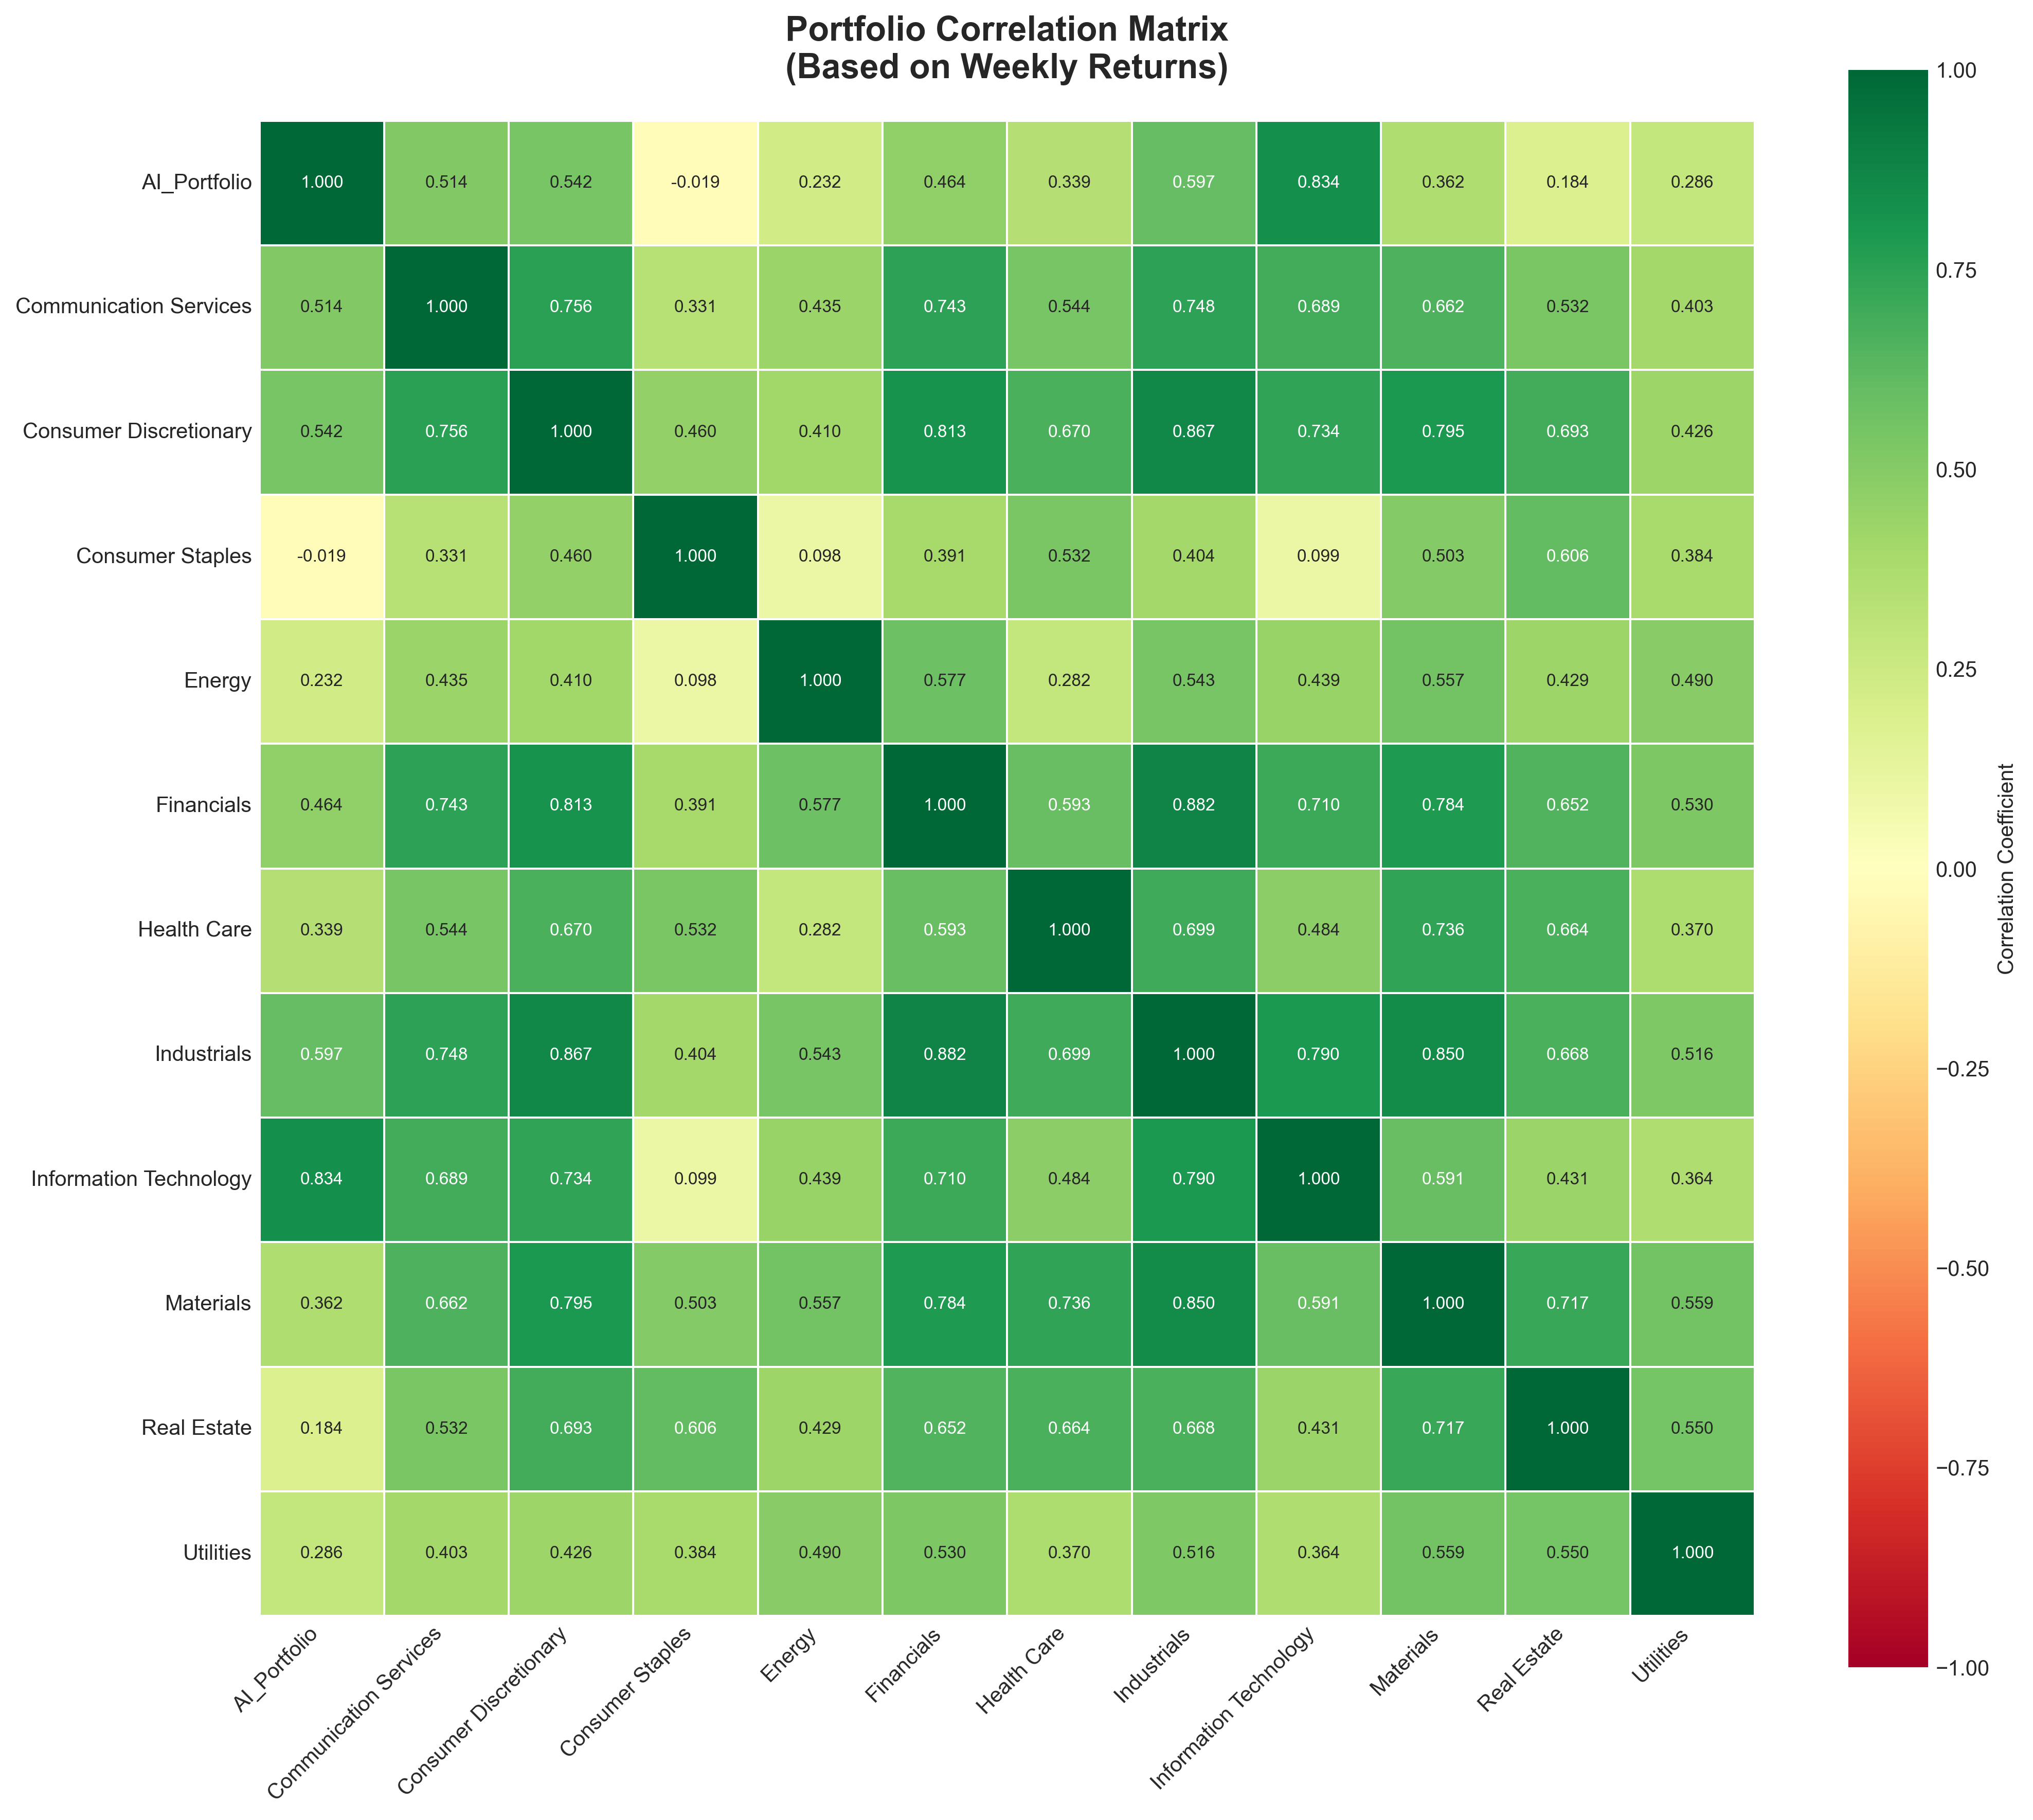 Figure 2: Correlation matrix showing how different portfolios move together
Figure 2 reveals a critical insight: Not all sectors move in sync. The AI portfolio shows high correlation (0.834) with Information Technology — meaning they tend to rise and fall together. But sectors like Consumer Staples show near-zero correlation (-0.019), making them excellent diversification candidates.
Performance Analysis: Top Performers Across Sectors
Our analysis identified the highest Sharpe ratio stocks in each sector. These examples illustrate how strong performers exist beyond the AI-focused technology sector.
 Figure 3: Top 3 stocks from each sector ranked by Sharpe ratio (red line = AI portfolio baseline)
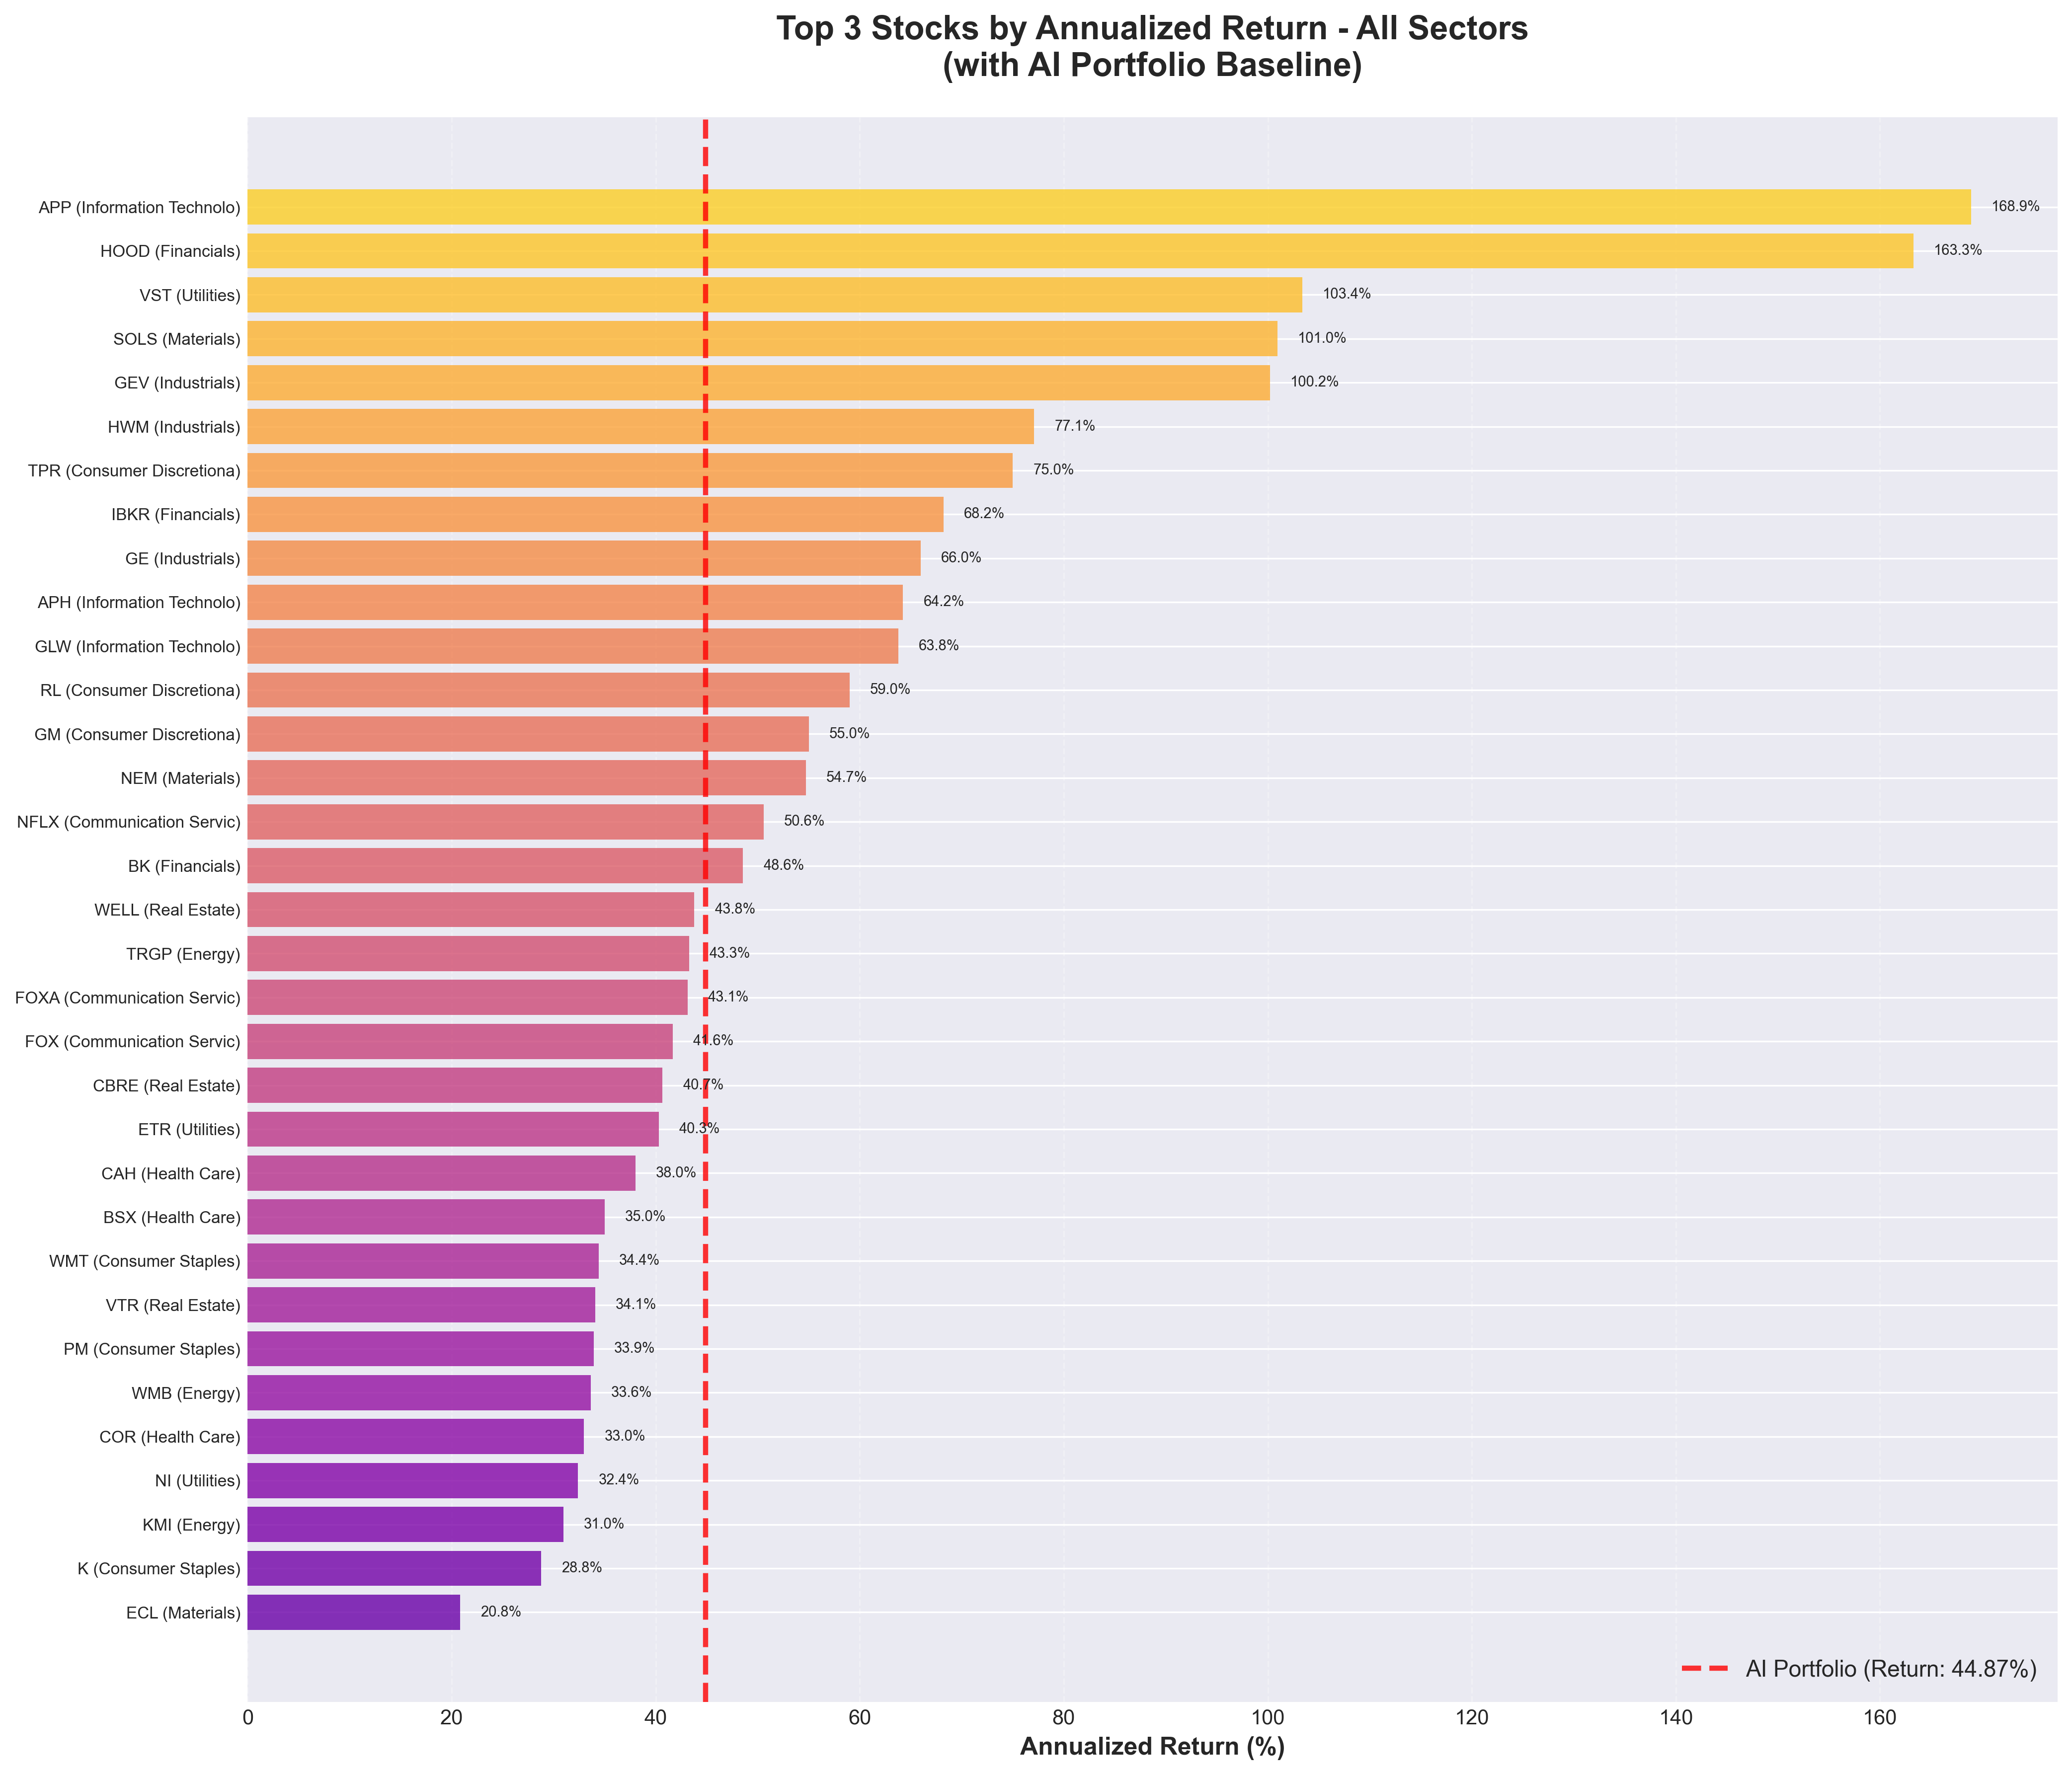 Figure 4: Top 3 stocks from each sector ranked by annualized return (red line = AI portfolio baseline)
Highest Sharpe Ratio Stock by Sector (Historical Performance)
Materials: Solstice Advanced Materials (SOLS)
- Sharpe Ratio: 2.7736 (exceeded AI portfolio)
- Annualized Return: 100.96% (exceeded AI portfolio)
- Annualized Volatility: 34.96%
- Total Return (2-year): nan%
Industrials: Howmet Aerospace (HWM)
- Sharpe Ratio: 2.2945 (exceeded AI portfolio)
- Annualized Return: 77.09% (exceeded AI portfolio)
- Annualized Volatility: 31.86%
- Total Return (2-year): 319.65%
Financials: Robinhood Markets (HOOD)
- Sharpe Ratio: 2.2749 (exceeded AI portfolio)
- Annualized Return: 163.29% (exceeded AI portfolio)
- Annualized Volatility: 70.02%
- Total Return (2-year): 1483.96%
Real Estate: Welltower (WELL)
- Sharpe Ratio: 2.1460 (exceeded AI portfolio)
- Annualized Return: 43.77%
- Annualized Volatility: 18.53%
- Total Return (2-year): 131.21%
Utilities: Entergy (ETR)
- Sharpe Ratio: 2.0380 (exceeded AI portfolio)
- Annualized Return: 40.30%
- Annualized Volatility: 17.81%
- Total Return (2-year): 116.40%
Information Technology: Corning Inc. (GLW)
- Sharpe Ratio: 2.0001 (exceeded AI portfolio)
- Annualized Return: 63.79% (exceeded AI portfolio)
- Annualized Volatility: 29.89%
- Total Return (2-year): 225.98%
Consumer Discretionary: Tapestry, Inc. (TPR)
- Sharpe Ratio: 1.9272 (exceeded AI portfolio)
- Annualized Return: 75.01% (exceeded AI portfolio)
- Annualized Volatility: 36.85%
- Total Return (2-year): 288.74%
Communication Services: Fox Corporation (Class A) (FOXA)
- Sharpe Ratio: 1.7280 (exceeded AI portfolio)
- Annualized Return: 43.11%
- Annualized Volatility: 22.63%
- Total Return (2-year): 124.50%
Health Care: Boston Scientific (BSX)
- Sharpe Ratio: 1.6407 (exceeded AI portfolio)
- Annualized Return: 35.00%
- Annualized Volatility: 18.90%
- Total Return (2-year): 93.99%
Consumer Staples: Walmart (WMT)
- Sharpe Ratio: 1.3949
- Annualized Return: 34.40%
- Annualized Volatility: 21.80%
- Total Return (2-year): 89.52%
Energy: Williams Companies (WMB)
- Sharpe Ratio: 1.2777
- Annualized Return: 33.64%
- Annualized Volatility: 23.20%
- Total Return (2-year): 85.45%
Low-Correlation Sectors: Diversification Opportunities
One key principle of diversification is finding investments that don't move in lockstep with your existing holdings. Here are sectors that showed low correlation with the AI portfolio while still delivering attractive returns:
1. Utilities
- Correlation with AI Portfolio: 0.286 (low)
- Sharpe Ratio: 1.6439
- Annualized Return: 28.16%
- Annualized Volatility: 14.70%
2. Real Estate
- Correlation with AI Portfolio: 0.184 (low)
- Sharpe Ratio: 0.6019
- Annualized Return: 13.81%
- Annualized Volatility: 16.30%
3. Energy
- Correlation with AI Portfolio: 0.232 (low)
- Sharpe Ratio: 0.4053
- Annualized Return: 13.68%
- Annualized Volatility: 23.88%
4. Consumer Staples
- Correlation with AI Portfolio: -0.019 (low)
- Sharpe Ratio: -0.1187
- Annualized Return: 2.74%
- Annualized Volatility: 10.61%
These sectors demonstrated that low correlation doesn't mean low returns. Utilities achieved a 28.16% annualized return with only 0.286 correlation to the AI portfolio.
Case Studies: Notable Historical Performers
Solstice Advanced Materials (SOLS) - Materials Sector
With a Sharpe ratio of 2.7736, SOLS was the highest risk-adjusted performer in our analysis. This materials sector company delivered a 100.96% annualized return with 34.96% volatility.
What this shows: Materials stocks are often overlooked in discussions dominated by AI and technology. However, they're essential to industrial production, construction, and technology manufacturing. This demonstrates how opportunities existed across diverse sectors.
Robinhood Markets (HOOD) - Financials Sector
HOOD posted 163.29% annualized returns with a Sharpe ratio of 2.2749, exceeding the AI portfolio's risk-adjusted performance despite operating in a completely different sector.
What this shows: Digital investing platforms benefited from secular trends beyond the AI boom, including increased retail participation in markets and cryptocurrency adoption.
Howmet Aerospace (HWM) - Industrials Sector
HWM achieved a 2.2945 Sharpe ratio with 77.09% annualized returns, demonstrating strong performance in the aerospace subsector.
What this shows: Aerospace and defense spending remained robust globally. Supply chain improvements and production ramp-ups benefited specialized manufacturers during this period.
Understanding Diversification Principles
Our analysis illustrates several key diversification concepts:
Historical Sector Performance Patterns
Looking at the 2-year period studied:
Lower Correlation Sectors (< 0.3 correlation with AI portfolio): These sectors moved more independently from AI-focused investments:
- Utilities: 1.6439 Sharpe ratio, 28.16% annualized return
- Consumer Staples: Demonstrated low volatility characteristics
- Real Estate: Showed different return drivers
Higher Returns with Diversification Benefits: Some sectors delivered strong performance while offering portfolio balance:
- Financials benefited from interest rate environment
- Industrials gained from infrastructure and manufacturing trends
- Health Care followed independent biotech and medical device cycles
Key Observations from the Data
-
Correlation Matters: Sectors with correlation below 0.3 to the AI portfolio provided true diversification benefits. When technology stocks fluctuated, these sectors often moved differently.
-
Multiple Performance Drivers: Different sectors responded to distinct economic factors — interest rates (Financials), energy prices (Utilities), healthcare innovation (Health Care), and infrastructure spending (Industrials).
-
Risk-Adjusted Performance: The highest absolute returns didn't always equal the best risk-adjusted returns. Utilities achieved a 1.6439 Sharpe ratio with 14.70% volatility, compared to the AI portfolio's 29.04% volatility.
Key Takeaways
Looking at Figures 3 and 4, notice how many individual stocks (shown as bars) exceed the AI portfolio baseline (red dotted line). This proves an important point: exceptional opportunities exist across ALL sectors, not just in AI.
What Our Data Shows:
-
The AI portfolio delivered strong returns (124.97% over 2 years), but not the best risk-adjusted returns. Utilities and Financials sectors actually had higher Sharpe ratios.
-
Correlation matters. The AI portfolio showed 0.834 correlation with Information Technology, meaning they often move together. True diversification requires adding sectors with lower correlations.
-
Hidden winners exist everywhere. From SOLS in Materials to HOOD in Financials, our analysis uncovered top performers in unexpected places.
-
Volatility kills returns. Even with high nominal returns, the AI portfolio's 29.04% volatility creates stress and may tempt you to sell at the worst times. Lower-volatility sectors help you stay invested.
Final Thoughts: Learning from Historical Data
This analysis of 2-year historical data demonstrates several important investing principles:
Diversification Created Options: While AI stocks delivered impressive returns, they weren't the only strong performers. Multiple sectors and individual stocks exceeded the AI portfolio's risk-adjusted returns.
Risk Comes in Different Forms: The AI portfolio's 29.04% volatility represented significant price swings. Lower-volatility sectors like Utilities (14.70%) and Consumer Staples offered different risk profiles while still generating positive returns.
Past Performance Provides Lessons, Not Guarantees: These historical results illustrate how different sectors behaved during this specific period. Future market conditions will differ, and past returns don't predict future results.
As legendary investor Benjamin Graham noted: "The essence of investment management is the management of risks, not the management of returns."
The data in this article shows how diversification across sectors with different correlations and risk profiles worked historically. Use these insights to understand portfolio construction principles and evaluate your own investment strategy with the help of a qualified financial advisor.
Data Source and Methodology
Data Source
This analysis utilized historical stock price data from the S&P 500 index, covering all constituent companies during the analysis period.
Price History Period:
- Start Date: November 06, 2023
- End Date: November 03, 2025
- Duration: 2.02 years (105 weeks)
- Frequency: Weekly closing prices
- Universe: 33 S&P 500 stocks with complete data
- Sectors Covered: All 11 GICS (Global Industry Classification Standard) sectors
Data Points:
- Open, High, Low, Close prices (OHLC)
- Trading volume
- Adjusted closing prices (accounting for splits and dividends)
Methodology
The analysis calculated the following metrics using standard financial formulas:
Performance Metrics:
- Sharpe Ratios: Calculated using a 4% annualized risk-free rate (approximate 2-year U.S. Treasury yield during the period)
- Annualized Returns: Computed from weekly returns using geometric mean methodology, then annualized (× 52 weeks)
- Annualized Volatility: Standard deviation of weekly returns, annualized using the square root of time method (× √52)
- Correlations: Pearson correlation coefficients based on weekly portfolio returns
Portfolio Construction:
- Equal-Weight Methodology: Within each sector, all stocks received equal allocation
- Initial Investment: $10,000 per portfolio (AI portfolio and each sector portfolio)
- Rebalancing: Buy-and-hold strategy with no rebalancing during the period
- No Transaction Costs: Analysis excludes trading fees, taxes, and slippage
Sector Classification: All stocks were categorized using the Global Industry Classification Standard (GICS), which divides the market into 11 sectors:
- Communication Services
- Consumer Discretionary
- Consumer Staples
- Energy
- Financials
- Health Care
- Industrials
- Information Technology
- Materials
- Real Estate
- Utilities
Disclaimer: This article is for educational and informational purposes only. It does not constitute financial, investment, or professional advice. The analysis presents historical data from a specific time period and should not be interpreted as recommendations to buy, sell, or hold any securities. All investment decisions carry risk, including the potential loss of principal. Past performance does not guarantee future results. Market conditions, correlations, and risk profiles can change significantly over time. Readers should conduct their own research and consult with qualified financial, tax, and legal advisors before making any investment decisions. The author and publisher assume no liability for any financial decisions made based on information in this article.
Comments (0)
No comments yet. Be the first to comment!