The AI Infrastructure Bubble: A Deep Dive into Nebius and Coreweave
Analysis Date: November 25, 2025
Executive Summary
In the rush to build AI infrastructure, two companies—Nebius and Coreweave—represent a fascinating case study of the current AI bubble. Both are spending billions on capital expenditures (building data centers, AI infrastructure, etc.) while generating massive losses. This analysis examines their financial statements to understand how they're funding this growth and whether their business models are sustainable.
Spoiler alert: The numbers reveal a debt-fueled race that may not end well.
🎯 Key Findings at a Glance
| Metric | Nebius | Coreweave |
|---|---|---|
| Latest Quarter Revenue | $146.1M | $1364.7M |
| Net Income | $-119.6M | $-110.1M |
| Net Margin | -81.9% | -8.1% |
| Operating Cash Flow | $-80.4M | $1689.1M |
| Quarterly CapEx | $955.5M | $2388.9M |
| Free Cash Flow | $-1035.9M | $-699.8M |
| Total Debt | $4569.0M | $18808.3M |
All figures from Q3 2025 (most recent quarter)
📚 Understanding the Metrics (For Non-Finance Folks)
Before we dive in, let's understand the key financial metrics we'll be discussing:
Revenue vs. Profit
- Revenue: Total money coming in from sales (the "top line")
- Net Income: What's left after all expenses (the "bottom line"). Negative = losing money
- Net Margin: Net Income ÷ Revenue × 100. Shows profit efficiency. Negative = unprofitable
Cash Flow Metrics
- Operating Cash Flow (OCF): Actual cash generated from running the business
- Positive = Business generates cash
- Negative = Business burns cash
- Capital Expenditure (CapEx): Money spent on long-term assets (buildings, servers, data centers)
- Free Cash Flow (FCF): OCF - CapEx = Cash available after maintaining/growing the business
- Positive = Self-sustaining
- Negative = Needs external funding
Debt & Leverage
- Total Debt: Money owed to creditors
- Net Debt: Total Debt - Cash on hand
- Debt-to-Revenue Ratio: Total Debt ÷ Revenue. Shows how many years of revenue needed to pay off debt
Growth Metrics
- QoQ Growth: Quarter-over-Quarter growth rate (comparing to previous quarter)
Part 1: The Profitability Problem 📉
Neither Company Is Profitable
Let's start with the most basic question: Are these companies making money? The answer is no.
Nebius:
- Q3 2025 Net Income: $-119.6M loss
- Net Margin: -81.9% (industry healthy range: 10-20%)
- 5-Quarter Average Loss: $24.8M per quarter
Coreweave:
- Q3 2025 Net Income: $-110.1M loss
- Net Margin: -8.1%
- 5-Quarter Average Loss: $-225.3M per quarter
What This Means
Both companies lose money on every dollar of revenue they generate. Nebius is particularly concerning—it's losing 82 cents on every dollar of revenue. Even at a much larger scale, Coreweave is still losing 8 cents per dollar.
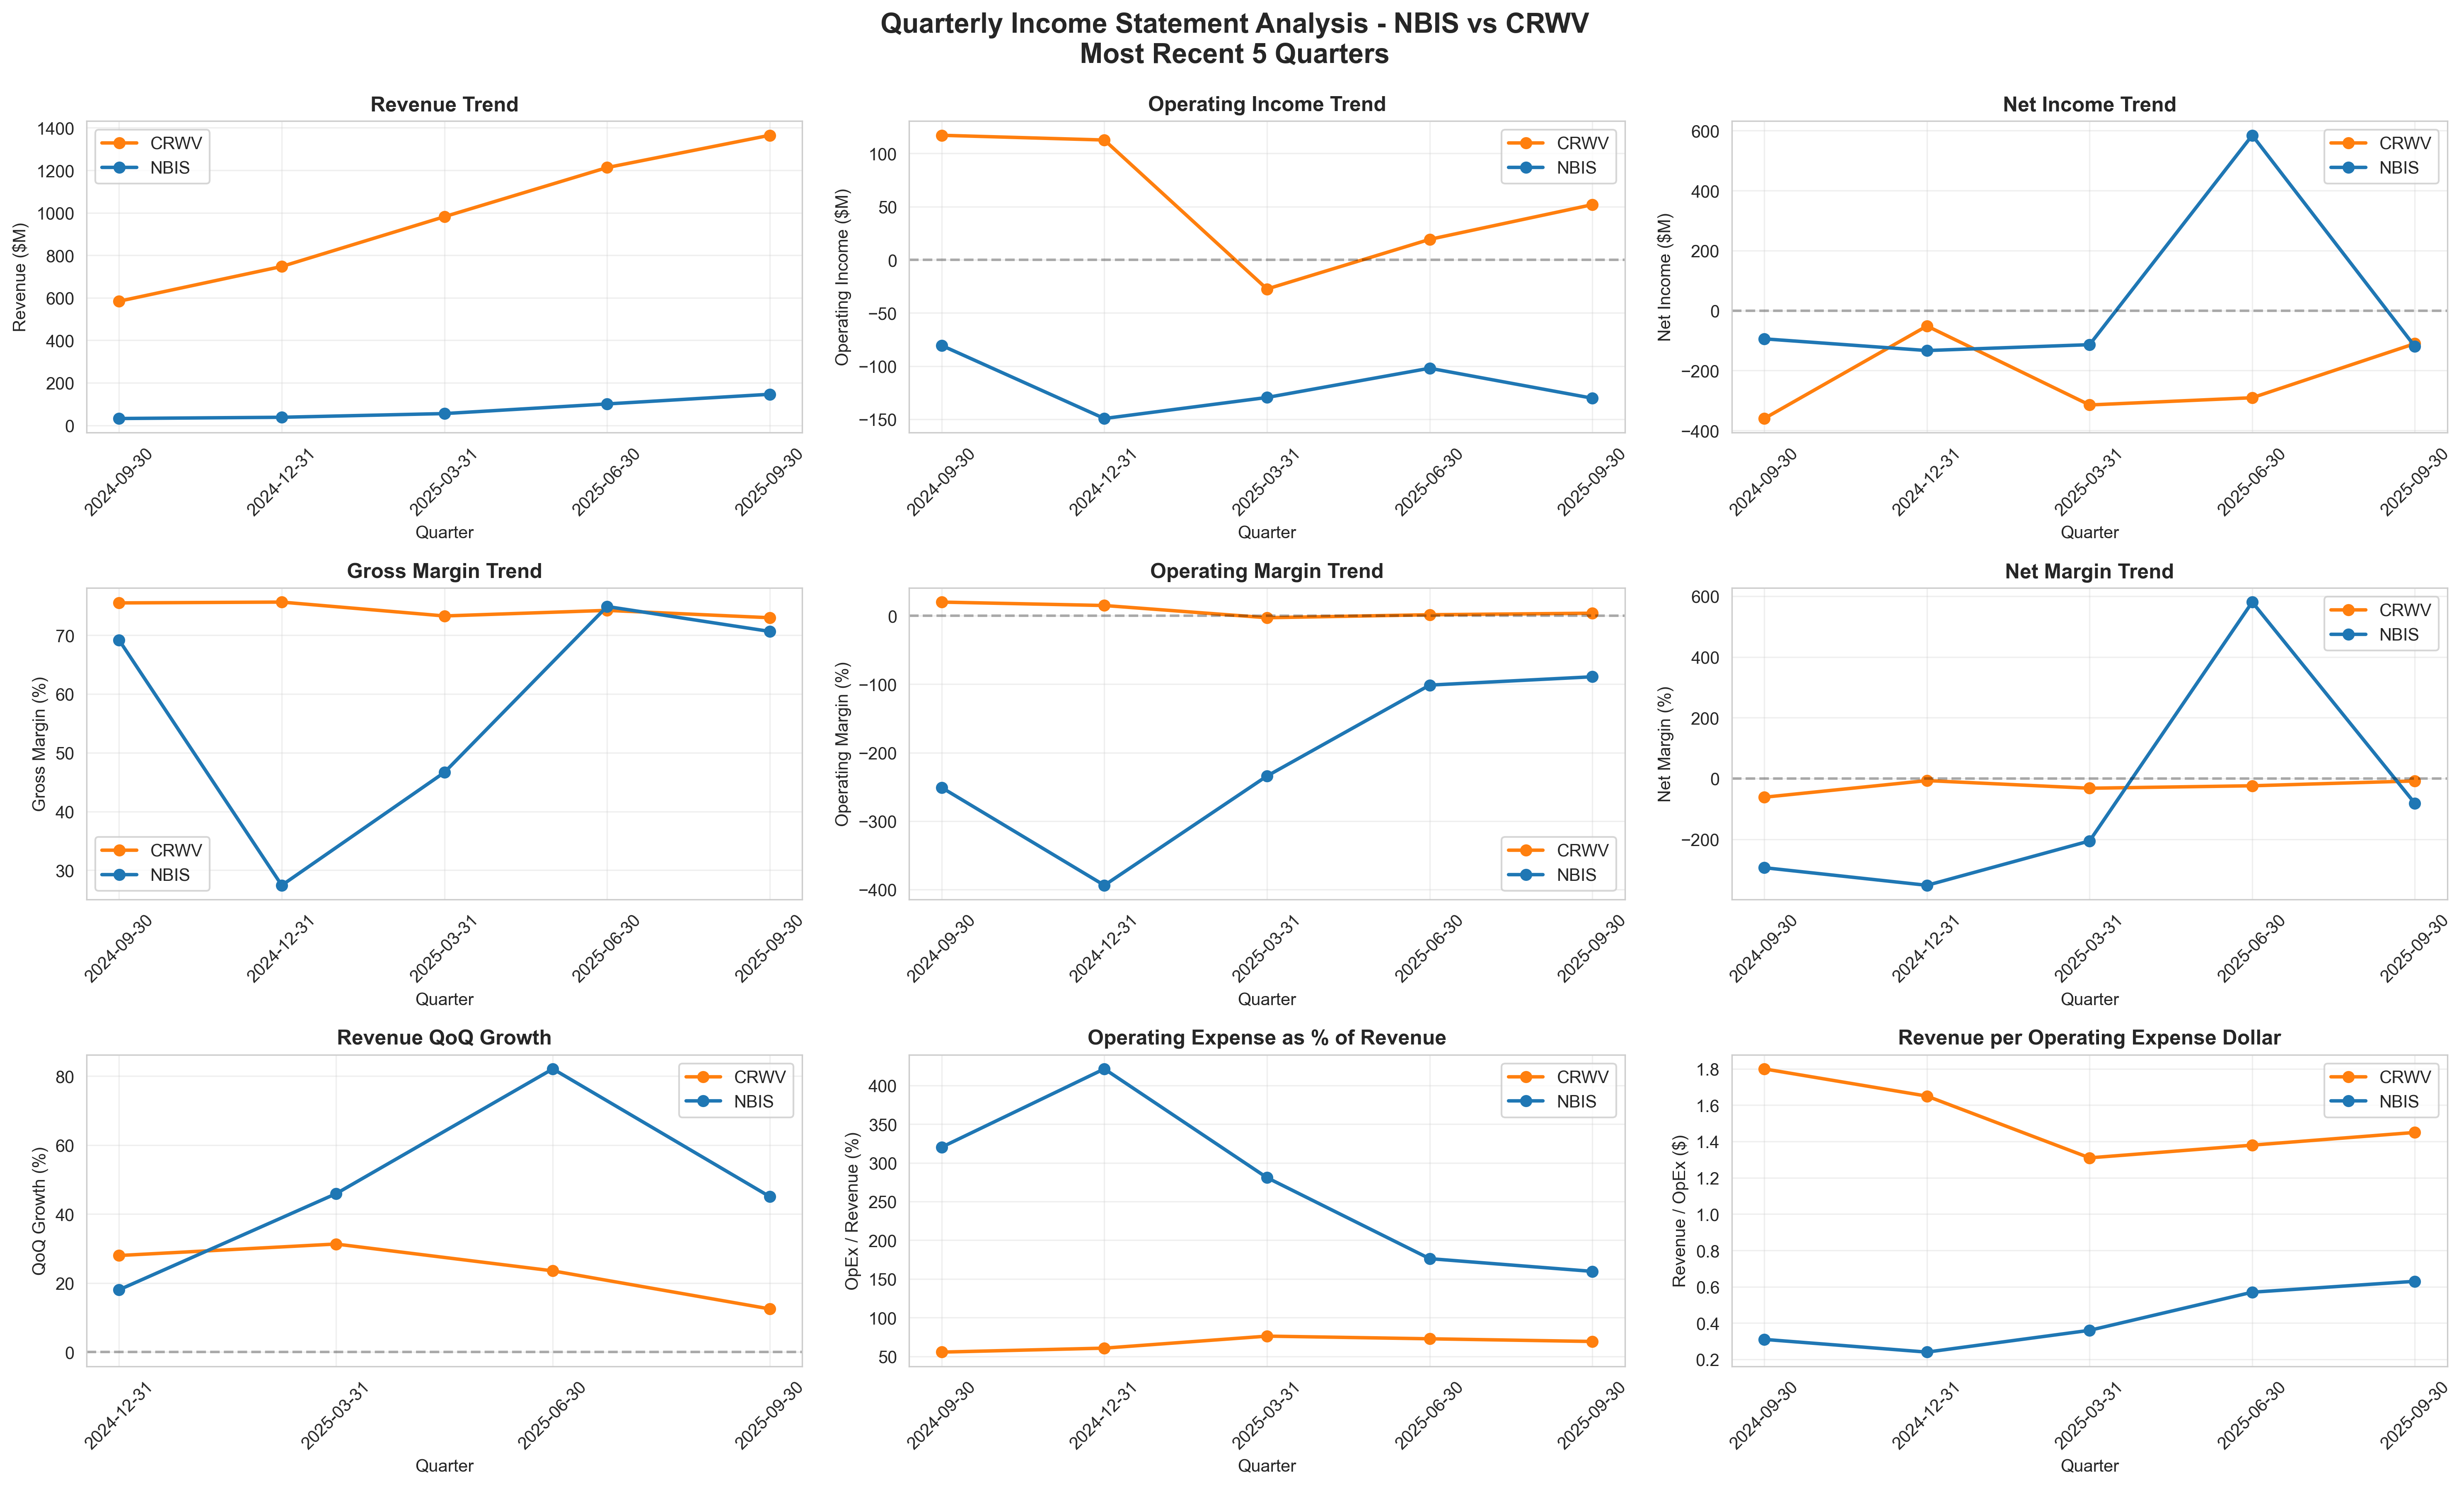 Figure 1: Income statement trends over 5 quarters. Notice how both companies remain unprofitable (net income below zero) despite growing revenue. The margins chart (middle row) shows Nebius with deeply negative operating and net margins, while Coreweave shows slight improvement but still unprofitable.
📖 How to Read This Chart
This dashboard contains 9 mini-charts showing different financial metrics over time. Here's what to look for:
Top Row (Revenue, Operating Income, Net Income):
- Lines going up = Growing revenue/income (good)
- Lines below zero = Losing money (bad)
- Nebius (blue) shows tiny revenue (~$150M) but massive losses
- Coreweave (orange) shows large revenue (~$1.4B) but still losing ~$110M/quarter
- Key insight: Revenue grows but both stay unprofitable
Middle Row (Margins):
- These show efficiency of turning revenue into profit
- Gross Margin (~70-73% for both): They make good profit on each sale before expenses
- Operating Margin: Nebius deeply negative (-89%), Coreweave slightly positive (+3.8%)
- Net Margin: Both negative - the bottom line is losses
- Key insight: Good gross margins but expenses destroy profitability
Bottom Row (Growth & Efficiency):
- QoQ Growth (bottom left): How much revenue changed from previous quarter
- Nebius: Volatile, latest +45% (good but inconsistent)
- Coreweave: Steady ~10-15% (more sustainable)
- OpEx as % of Revenue (bottom middle): Operating costs relative to sales
- Lower is better (means more efficient)
- Nebius: ~150-160% (spending 1.5× revenue just on operations!)
- Coreweave: ~65-70% (more reasonable but still high)
🚩 Red Flags in This Chart:
- Nebius operating income (top middle) is consistently deep negative
- Nebius net margin (middle right) is getting worse over time (line going down)
- OpEx ratios (bottom middle) show both companies spending more than they should
Part 2: But Revenue Is Growing... Right? 📈
The bull case for these companies is that they're in "growth mode"—sacrificing profits now for market share.
Nebius Revenue Growth:
- Q3 2025 Revenue: $146.1M
- QoQ Growth: +45.1% (Q2 → Q3)
- Total 5-Quarter Growth: +355.1%
Coreweave Revenue Growth:
- Q3 2025 Revenue: $1364.7M
- QoQ Growth: +12.5% (Q2 → Q3)
- Total 5-Quarter Growth: +133.7%
The Problem: Growing Revenue, But Margins Aren't Improving
Nebius Margin Trends (2024-09-30 → 2025-09-30):
- Gross Margin: 69.2% → 70.6% (Change: 1.5 points)
- Operating Margin: -251.1% → -89.1% (Change: 162.0 points)
- Net Margin: -293.5% → -81.9% (Change: 211.6 points)
Coreweave Margin Trends (2024-09-30 → 2025-09-30):
- Gross Margin: 75.5% → 73.0% (Change: -2.5 points)
- Operating Margin: 20.1% → 3.8% (Change: -16.3 points)
- Net Margin: -61.6% → -8.1% (Change: 53.5 points)
Translation: Both companies are growing revenue, but Nebius is getting worse at turning that revenue into profit. Coreweave shows modest improvement but remains deeply unprofitable.
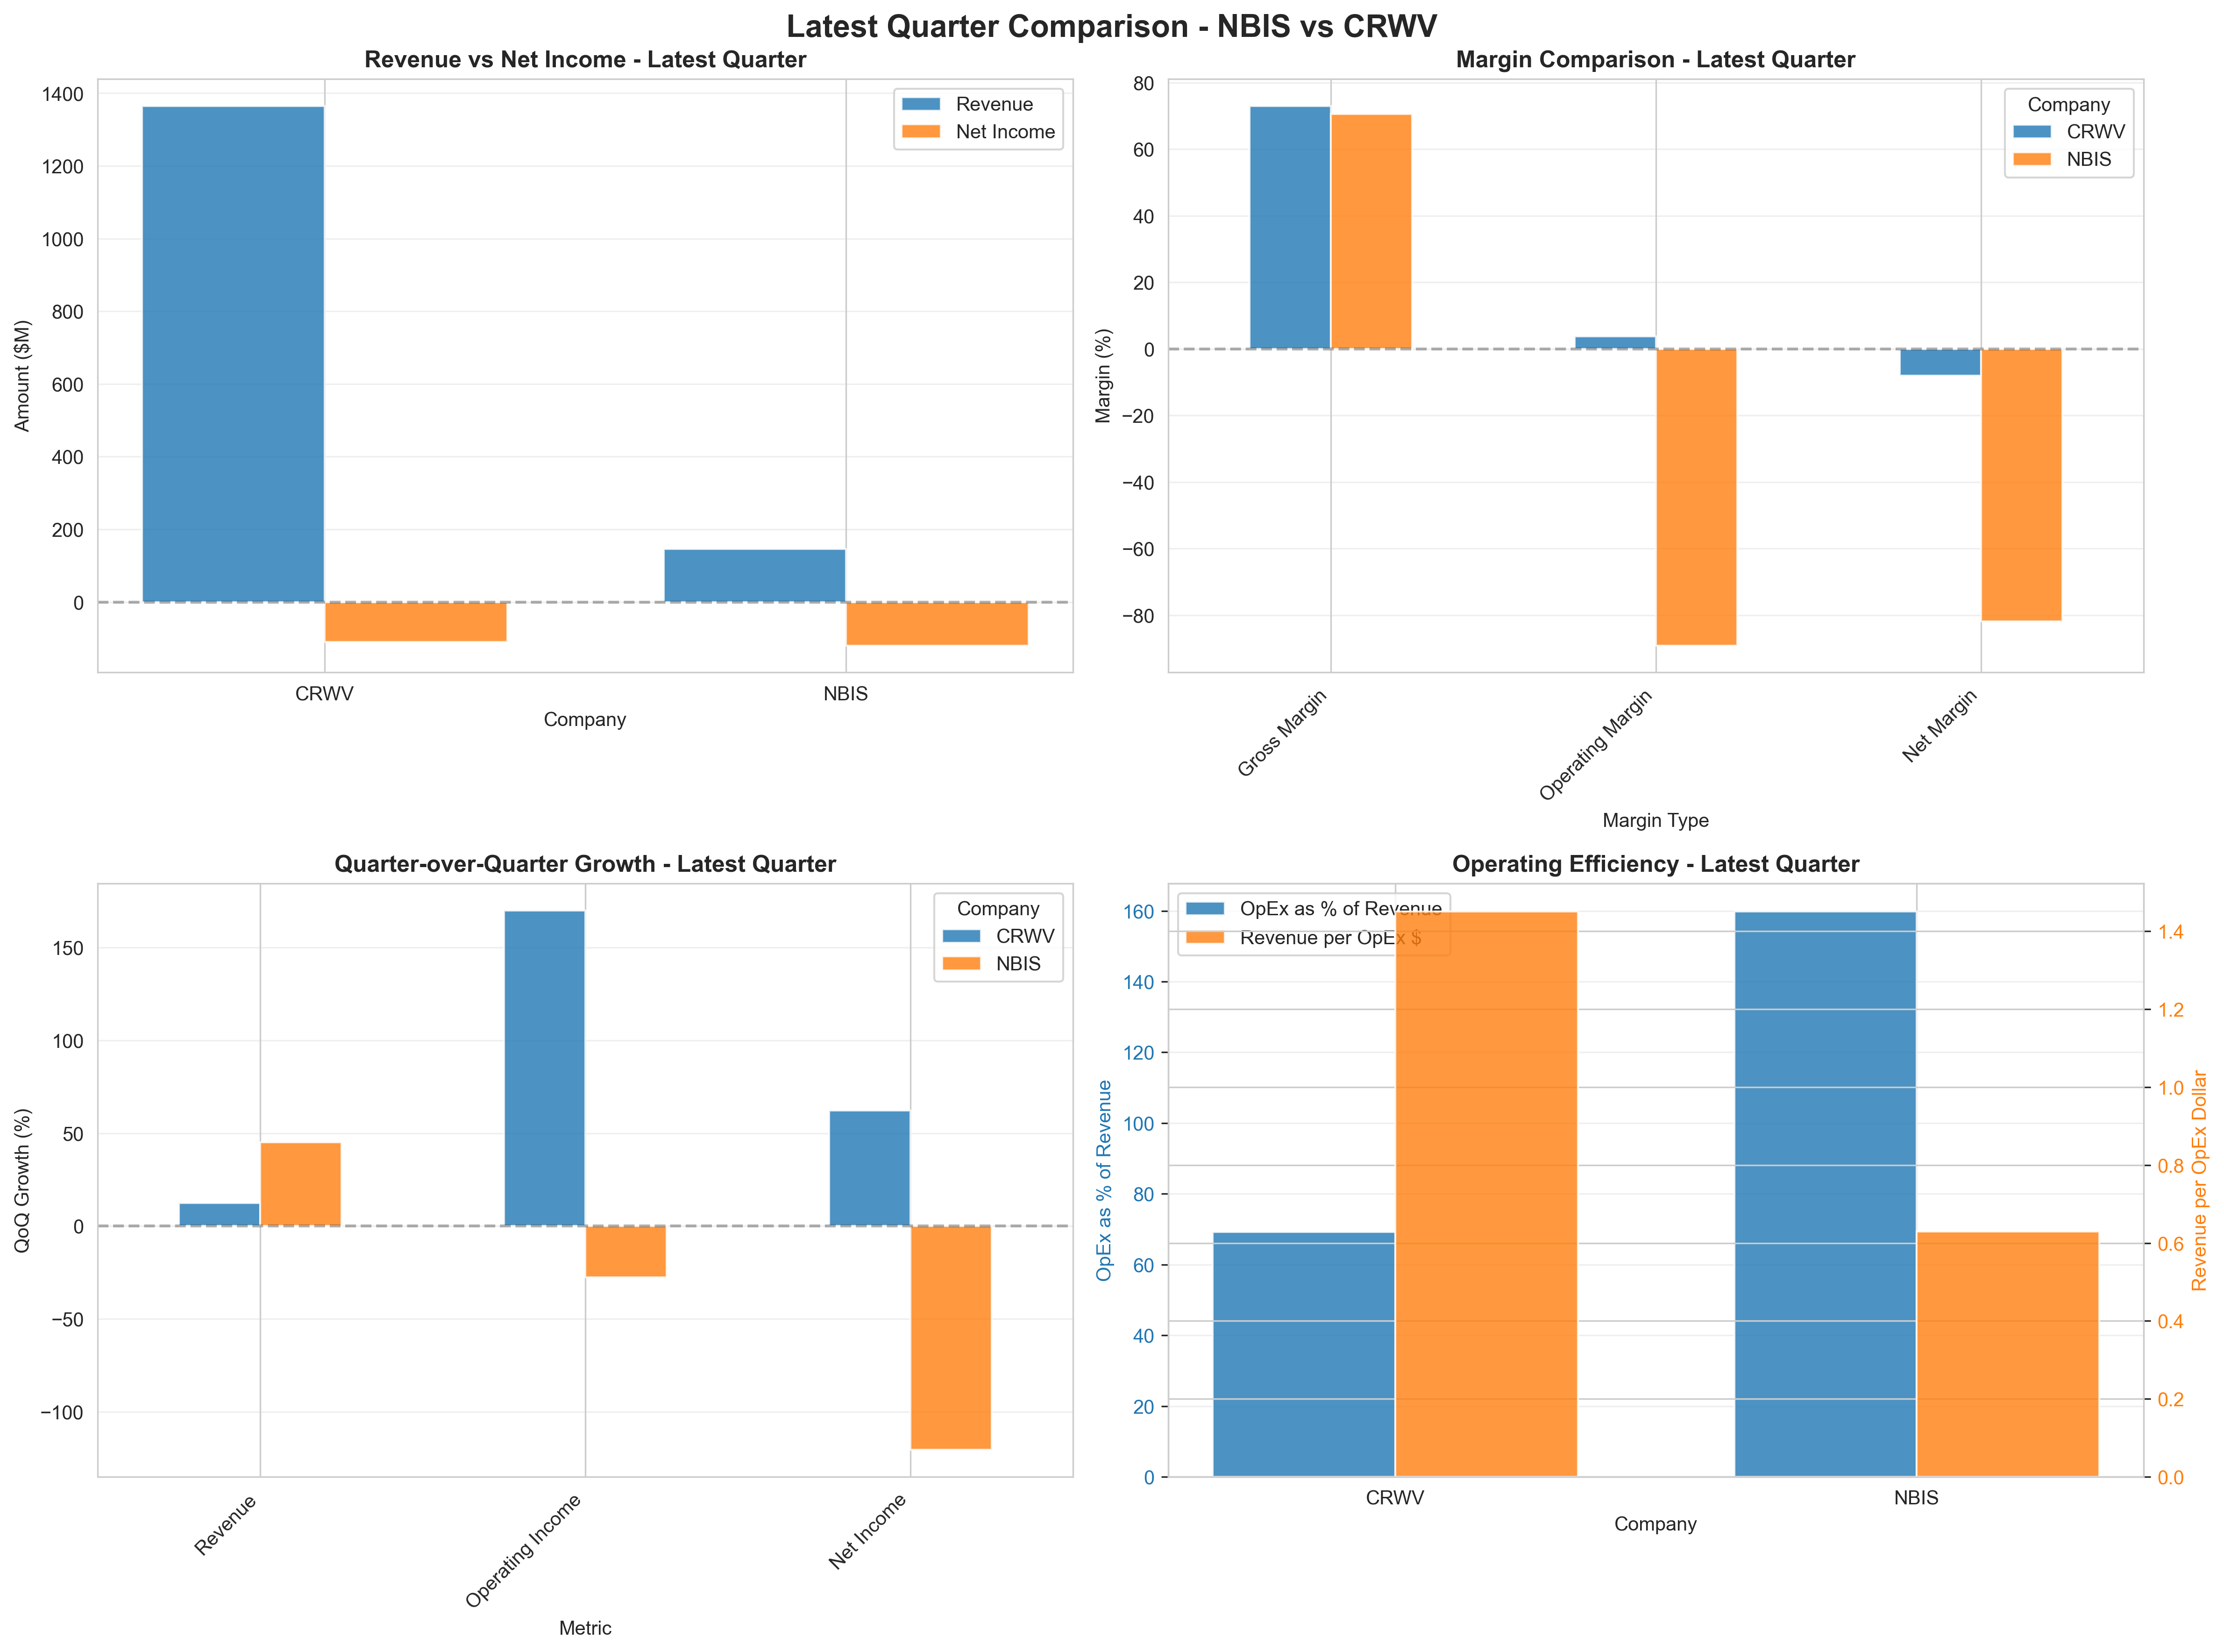 Figure 2: Latest quarter comparison between Nebius and Coreweave. Top left shows the massive gap in scale—Coreweave generates 9.3× more revenue than Nebius. Top right shows both have negative net margins but Coreweave is much less inefficient. Bottom charts show modest revenue growth but concerning margin deterioration for Nebius.
Part 3: The Cash Flow Reality 💸
Accounting profits can be manipulated. Cash flow doesn't lie. Let's see where the money actually flows.
Operating Cash Flow: Who's Actually Generating Cash?
Nebius (Q3 2025):
- Operating Cash Flow: $-80.4M
- OCF Margin: -55.0% (burning $0.55 per $1 of revenue)
- QoQ Change: -7.8% (getting worse)
Coreweave (Q3 2025):
- Operating Cash Flow: $1689.1M
- OCF Margin: 123.8% (generating $1.24 per $1 of revenue!)
- QoQ Change: +772.3% (massive improvement)
This looks like Coreweave is a cash-generating machine while Nebius is a bonfire. But there's a twist...
🚨 The Working Capital Manipulation
Coreweave's stunning Q3 cash flow has a secret. Let's look at where that $1.69B in operating cash flow came from:
| Component | Q2 2025 | Q3 2025 | Change |
|---|---|---|---|
| Net Income | $-291M loss | $-110M loss | $+180M |
| Depreciation (non-cash) | +$560M | +$630M | +$71M |
| Working Capital Change | -$835M | +$1018M | +$1853M |
| Operating Cash Flow | -$251M | +$1689M | +$1940M |
What happened with working capital?
- Collected receivables: +$1,118M (squeezed customers to pay their bills)
- Delayed paying suppliers: +$622M (stretched payables)
This is a one-time cash extraction, not sustainable business improvement. It's like pawning your watch to pay rent—you can only do it once.
Adjusted for working capital games:
- Coreweave's "Core" Operating Cash Flow: $671M (only 28% of reported OCF)
- Core OCF Margin: 49.2% (not the inflated 123.8%)
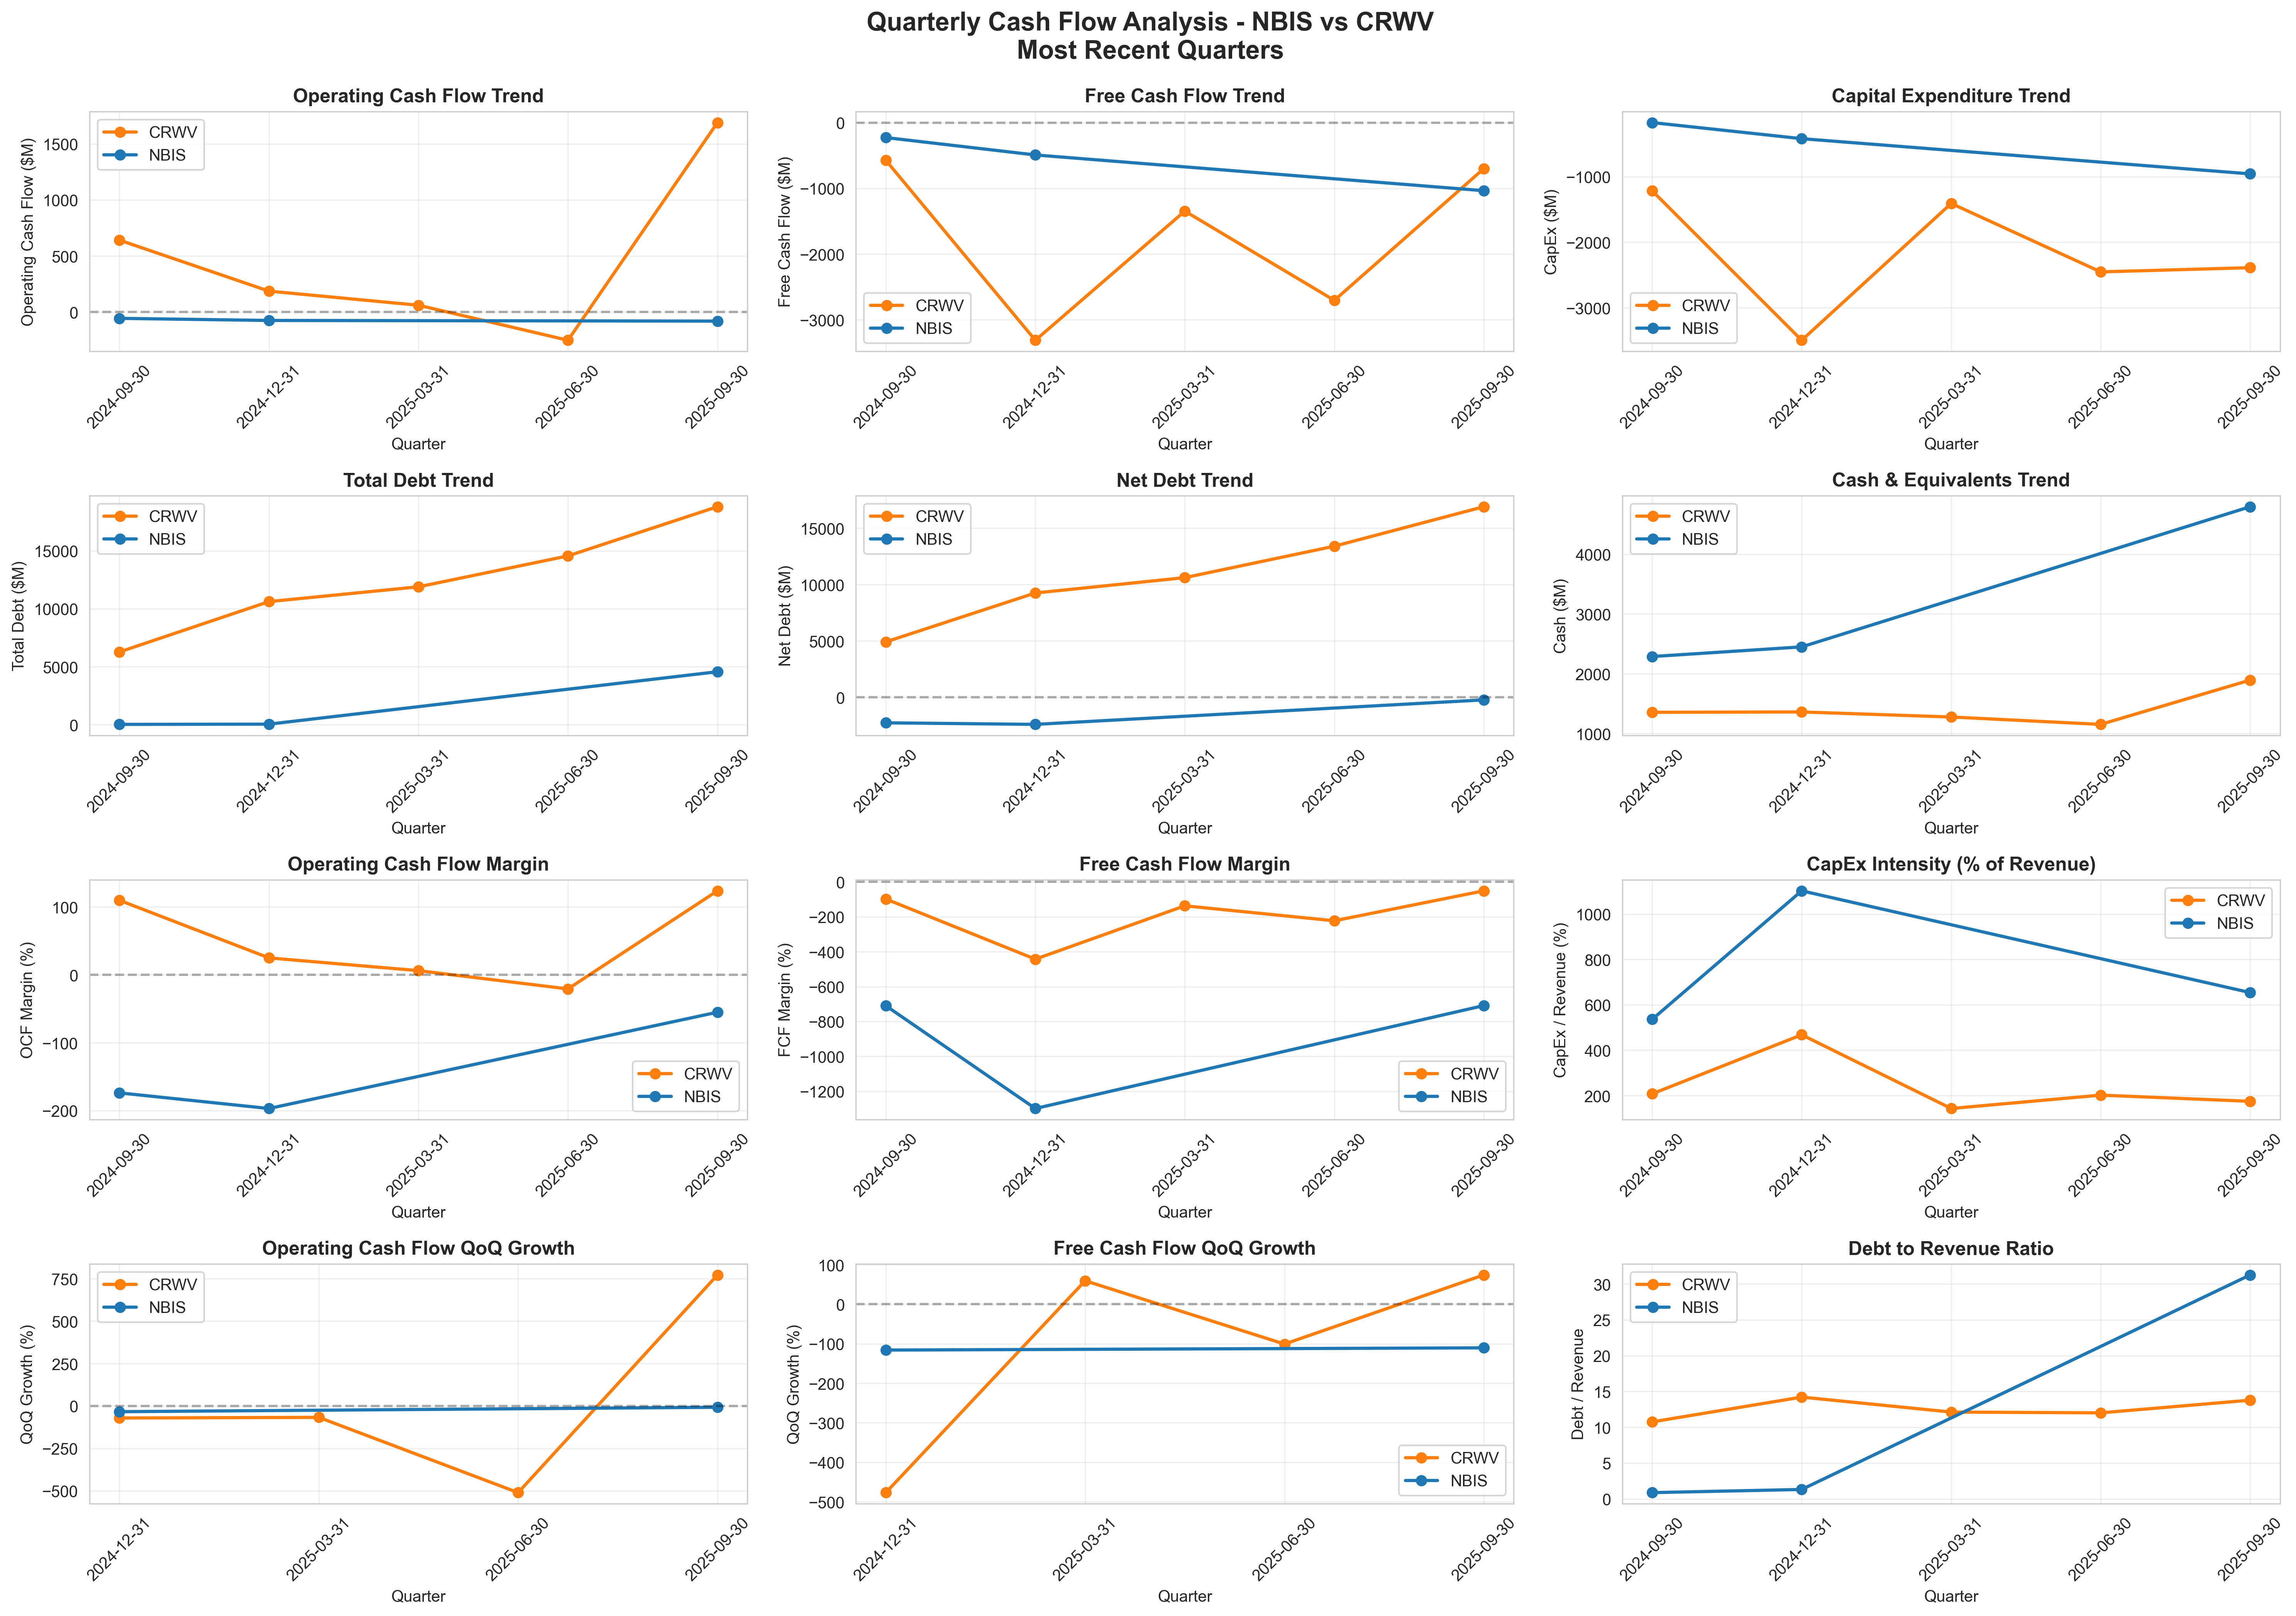 Figure 3: Cash flow trends over time. Top left shows Coreweave's dramatic OCF spike in Q3 2025—this is the working capital manipulation. Top middle shows both companies burning free cash flow (FCF below zero). Notice the massive capital expenditures (top right) that dwarf operating cash generation for both companies.
📖 How to Read This Chart
This is the most important chart—it shows actual cash movements, which can't be manipulated like accounting profits.
Understanding the Rows:
Row 1 - Cash Generation:
-
Operating Cash Flow (top left):
- Above zero = Business generates cash from operations (good)
- Below zero = Business burns cash to operate (bad)
- 📊 Nebius (blue): Consistently below zero = burning cash
- 📊 Coreweave (orange): Notice the huge spike in Q3 2025 - this is the working capital manipulation!
-
Free Cash Flow (top middle):
- = Operating Cash Flow - Capital Expenditure
- This is the "true" cash available after building infrastructure
- 📊 Both companies: Deeply negative (below zero line) = burning cash
- 🚨 Nebius hitting -$1B in latest quarter!
-
Capital Expenditure (top right):
- Money spent on buildings, servers, data centers
- Shown as negative because it's cash out
- 📊 Coreweave: Massive spike to -$3.5B in Q4 2024, now "only" -$2.4B
- 📊 Nebius: Exploding from -$172M to -$956M in recent quarter
Row 2 - Debt & Cash Positions:
-
Total Debt (middle left):
- 📊 Coreweave: Growing from $6.3B → $18.8B (tripling!)
- 📊 Nebius: Exploding from $28M → $4.6B in one year
-
Net Debt (middle):
- = Total Debt - Cash on hand
- Lower (or negative) is better
- 📊 Nebius: Negative net debt (more cash than debt) - surprising!
- 📊 Coreweave: $16.9B net debt and growing
Row 3 - Margins:
-
OCF Margin (bottom left):
- = Operating Cash Flow ÷ Revenue
- 📊 Coreweave Q3: 124%! But this is the working capital trick
- 📊 Nebius: Consistently -50% to -200% (burning half to double their revenue)
-
FCF Margin (bottom middle):
- = Free Cash Flow ÷ Revenue
- This is the "reality check" metric
- 📊 Both deeply negative - the true burn rate
- 🚨 Nebius: -709% FCF margin (burning 7× its revenue!)
🎯 The One Number That Matters: Look at Free Cash Flow (top middle chart). Both companies' lines are below zero = Both are burning cash and need external funding to survive.
🚩 Critical Red Flags:
- Coreweave's OCF spike (top left) is a one-time working capital extraction
- Debt lines (middle left) are shooting upward = dependency growing
- FCF margins (bottom middle) are deeply negative = unsustainable
- CapEx (top right) remains massive = the cash burn continues
Part 4: The CapEx Explosion 🏗️
Now we get to the heart of the story: both companies are spending billions building AI infrastructure.
Capital Expenditure Comparison
| Company | Q3 2025 CapEx | Quarterly Revenue | CapEx as % of Revenue |
|---|---|---|---|
| Nebius | $956M | $146M | 654% |
| Coreweave | $2389M | $1365M | 175% |
What does this mean?
- Nebius is spending 654% of its revenue on infrastructure. For every $1 in sales, it's investing $6.54 in buildings/servers/data centers.
- Coreweave is spending 175% of its revenue on infrastructure. For every $1 in sales, it's investing $1.75.
These are unprecedented levels of capital intensity. For comparison, mature tech companies typically spend 5-15% of revenue on CapEx.
The 5-Quarter Capital Spending Spree
Nebius Total CapEx: $1545M over 3 quarters Coreweave Total CapEx: $10962M over 5 quarters
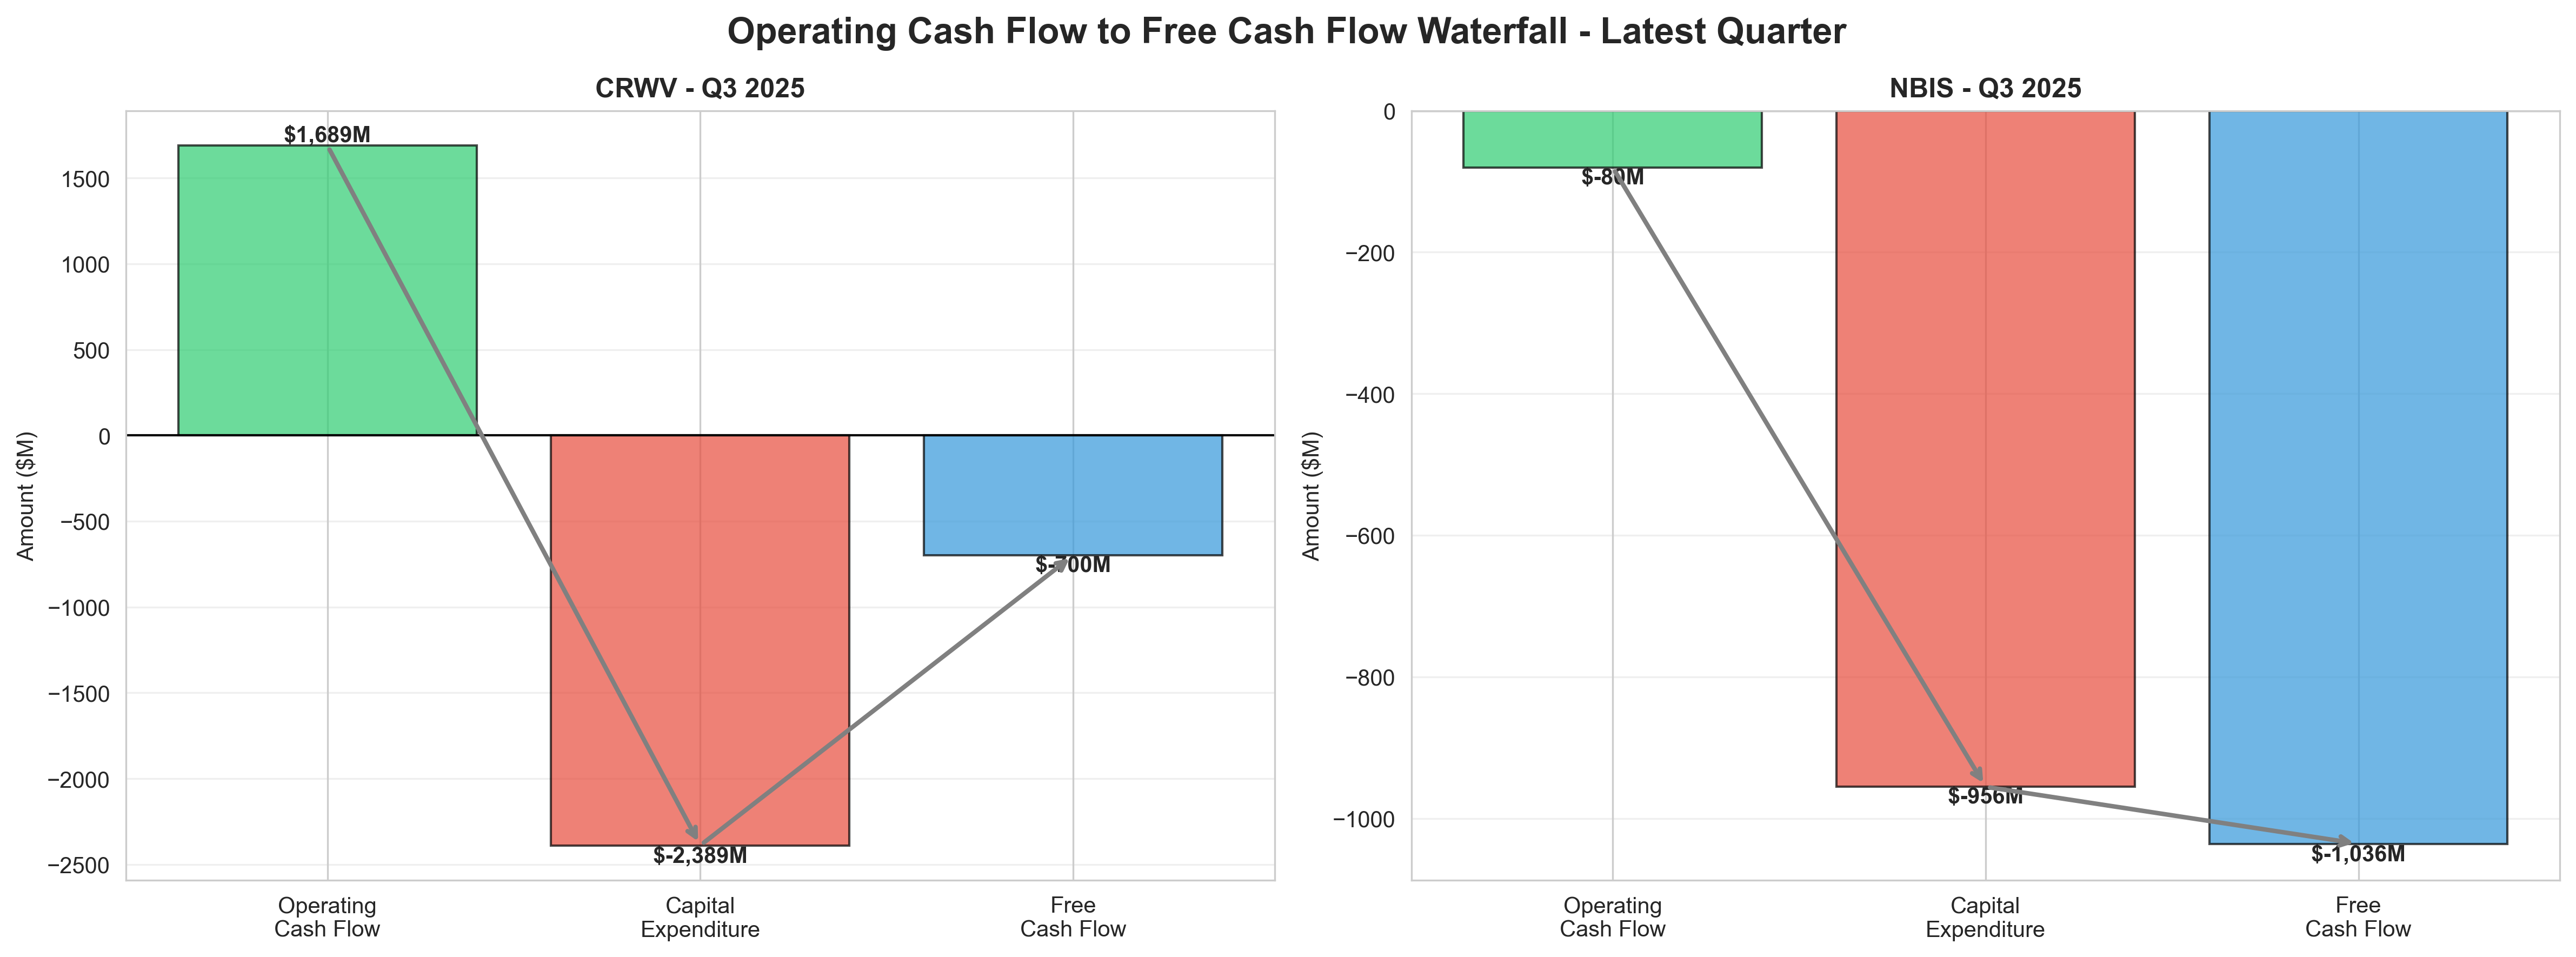 Figure 4: Operating Cash Flow to Free Cash Flow waterfall for Q3 2025. This clearly shows how massive CapEx spending (red bars) obliterates any operating cash generation. Nebius burns cash at every stage. Coreweave generates operating cash but spends it all (and more) on infrastructure, resulting in negative free cash flow (blue bars below zero).
📖 How to Read This Chart
This waterfall chart shows the journey of cash from operations to what's actually available (free cash flow).
How Waterfall Charts Work:
- Start on the left with Operating Cash Flow
- Subtract Capital Expenditure (middle bar)
- End on the right with Free Cash Flow
- Arrows show the flow from left to right
Reading Each Company:
Nebius (Left Panel):
- 🟩 Operating Cash Flow: -$80M (green but negative = burning)
- 🟥 Capital Expenditure: -$956M (red = huge outflow)
- 🟦 Free Cash Flow: -$1,036M (blue, deeply negative)
What this means: Nebius burns $80M just running the business, then spends another $956M on infrastructure. Total quarterly burn: over $1 billion.
Coreweave (Right Panel):
- 🟩 Operating Cash Flow: +$1,689M (green and positive = good!)
- 🟥 Capital Expenditure: -$2,389M (red = massive outflow)
- 🟦 Free Cash Flow: -$700M (blue, negative)
What this means: Coreweave generates $1.7B from operations (impressive!) but then spends $2.4B on infrastructure. Despite the strong operations, they're still burning $700M/quarter.
⚠️ Remember: Coreweave's $1,689M OCF includes the $1,018M working capital trick. The sustainable OCF is only ~$671M, which would make FCF even worse (~-$1.7B).
🎯 Key Insight: The red CapEx bars are so large they dwarf everything else. This shows both companies are in a massive infrastructure build-out phase. The question: Will revenue grow fast enough to justify these investments before the debt crushes them?
Visual Comparison:
- Nebius: All bars negative = burning at every stage
- Coreweave: Positive OCF but CapEx bar is 1.4× larger = net burn
Part 5: So... Where Does All This Money Come From? 💰
If both companies are burning free cash flow, how are they funding their operations and massive CapEx?
Free Cash Flow: The Bottom Line
Nebius Q3 2025:
- Free Cash Flow: $-1036M (massive burn)
- Burn breakdown:
- Operating burn: $-80M
- CapEx spend: $-956M
- Total cash need: $-1036M per quarter
Coreweave Q3 2025:
- Free Cash Flow: $-700M
- But remember: $1018M of the OCF was working capital manipulation
- Sustainable FCF: $-1718M (much worse)
The Answer: Debt. Lots and Lots of Debt.
Nebius: 100% Debt-Fueled
| Quarter | Total Debt | Quarterly Debt Increase |
|---|---|---|
| 2024-09-30 | $28M | - |
| 2024-12-31 | $50M | +$22M |
| 2025-09-30 | $4569M | +$4519M |
In Q3 2025 alone, Nebius issued $3162M in new debt. That's:
- 21.6× its quarterly revenue
- Enough to fund the $1036M burn with $2127M left over for cash reserves
Debt-to-Revenue Ratio: 31.3× (would take 31 years of current revenue to pay off debt)
Coreweave: The Hidden Debt Dependency
Coreweave's story is more nuanced:
Q3 2025 CapEx Funding Breakdown ($2,389M total):
| Source | Amount | % of CapEx | Sustainability |
|---|---|---|---|
| Core Operations | $671M | 28% | ✅ Repeatable |
| Working Capital Squeeze | $1,018M | 43% | ⚠️ One-time only |
| Net New Debt | $1,726M | - | ⚠️ Must keep raising |
The math:
- Reported OCF: $1689M
- Minus WC manipulation: -$1018M
- Core OCF: $671M
- CapEx: $2389M
- Shortfall: $1718M
- Funded by: Net debt issuance of $1726M
Without the working capital games, Coreweave can only self-fund 28% of its CapEx. It needs debt for the remaining 72%.
Debt-to-Revenue Ratio: 13.8× (would take 14 years of current revenue to pay off debt)
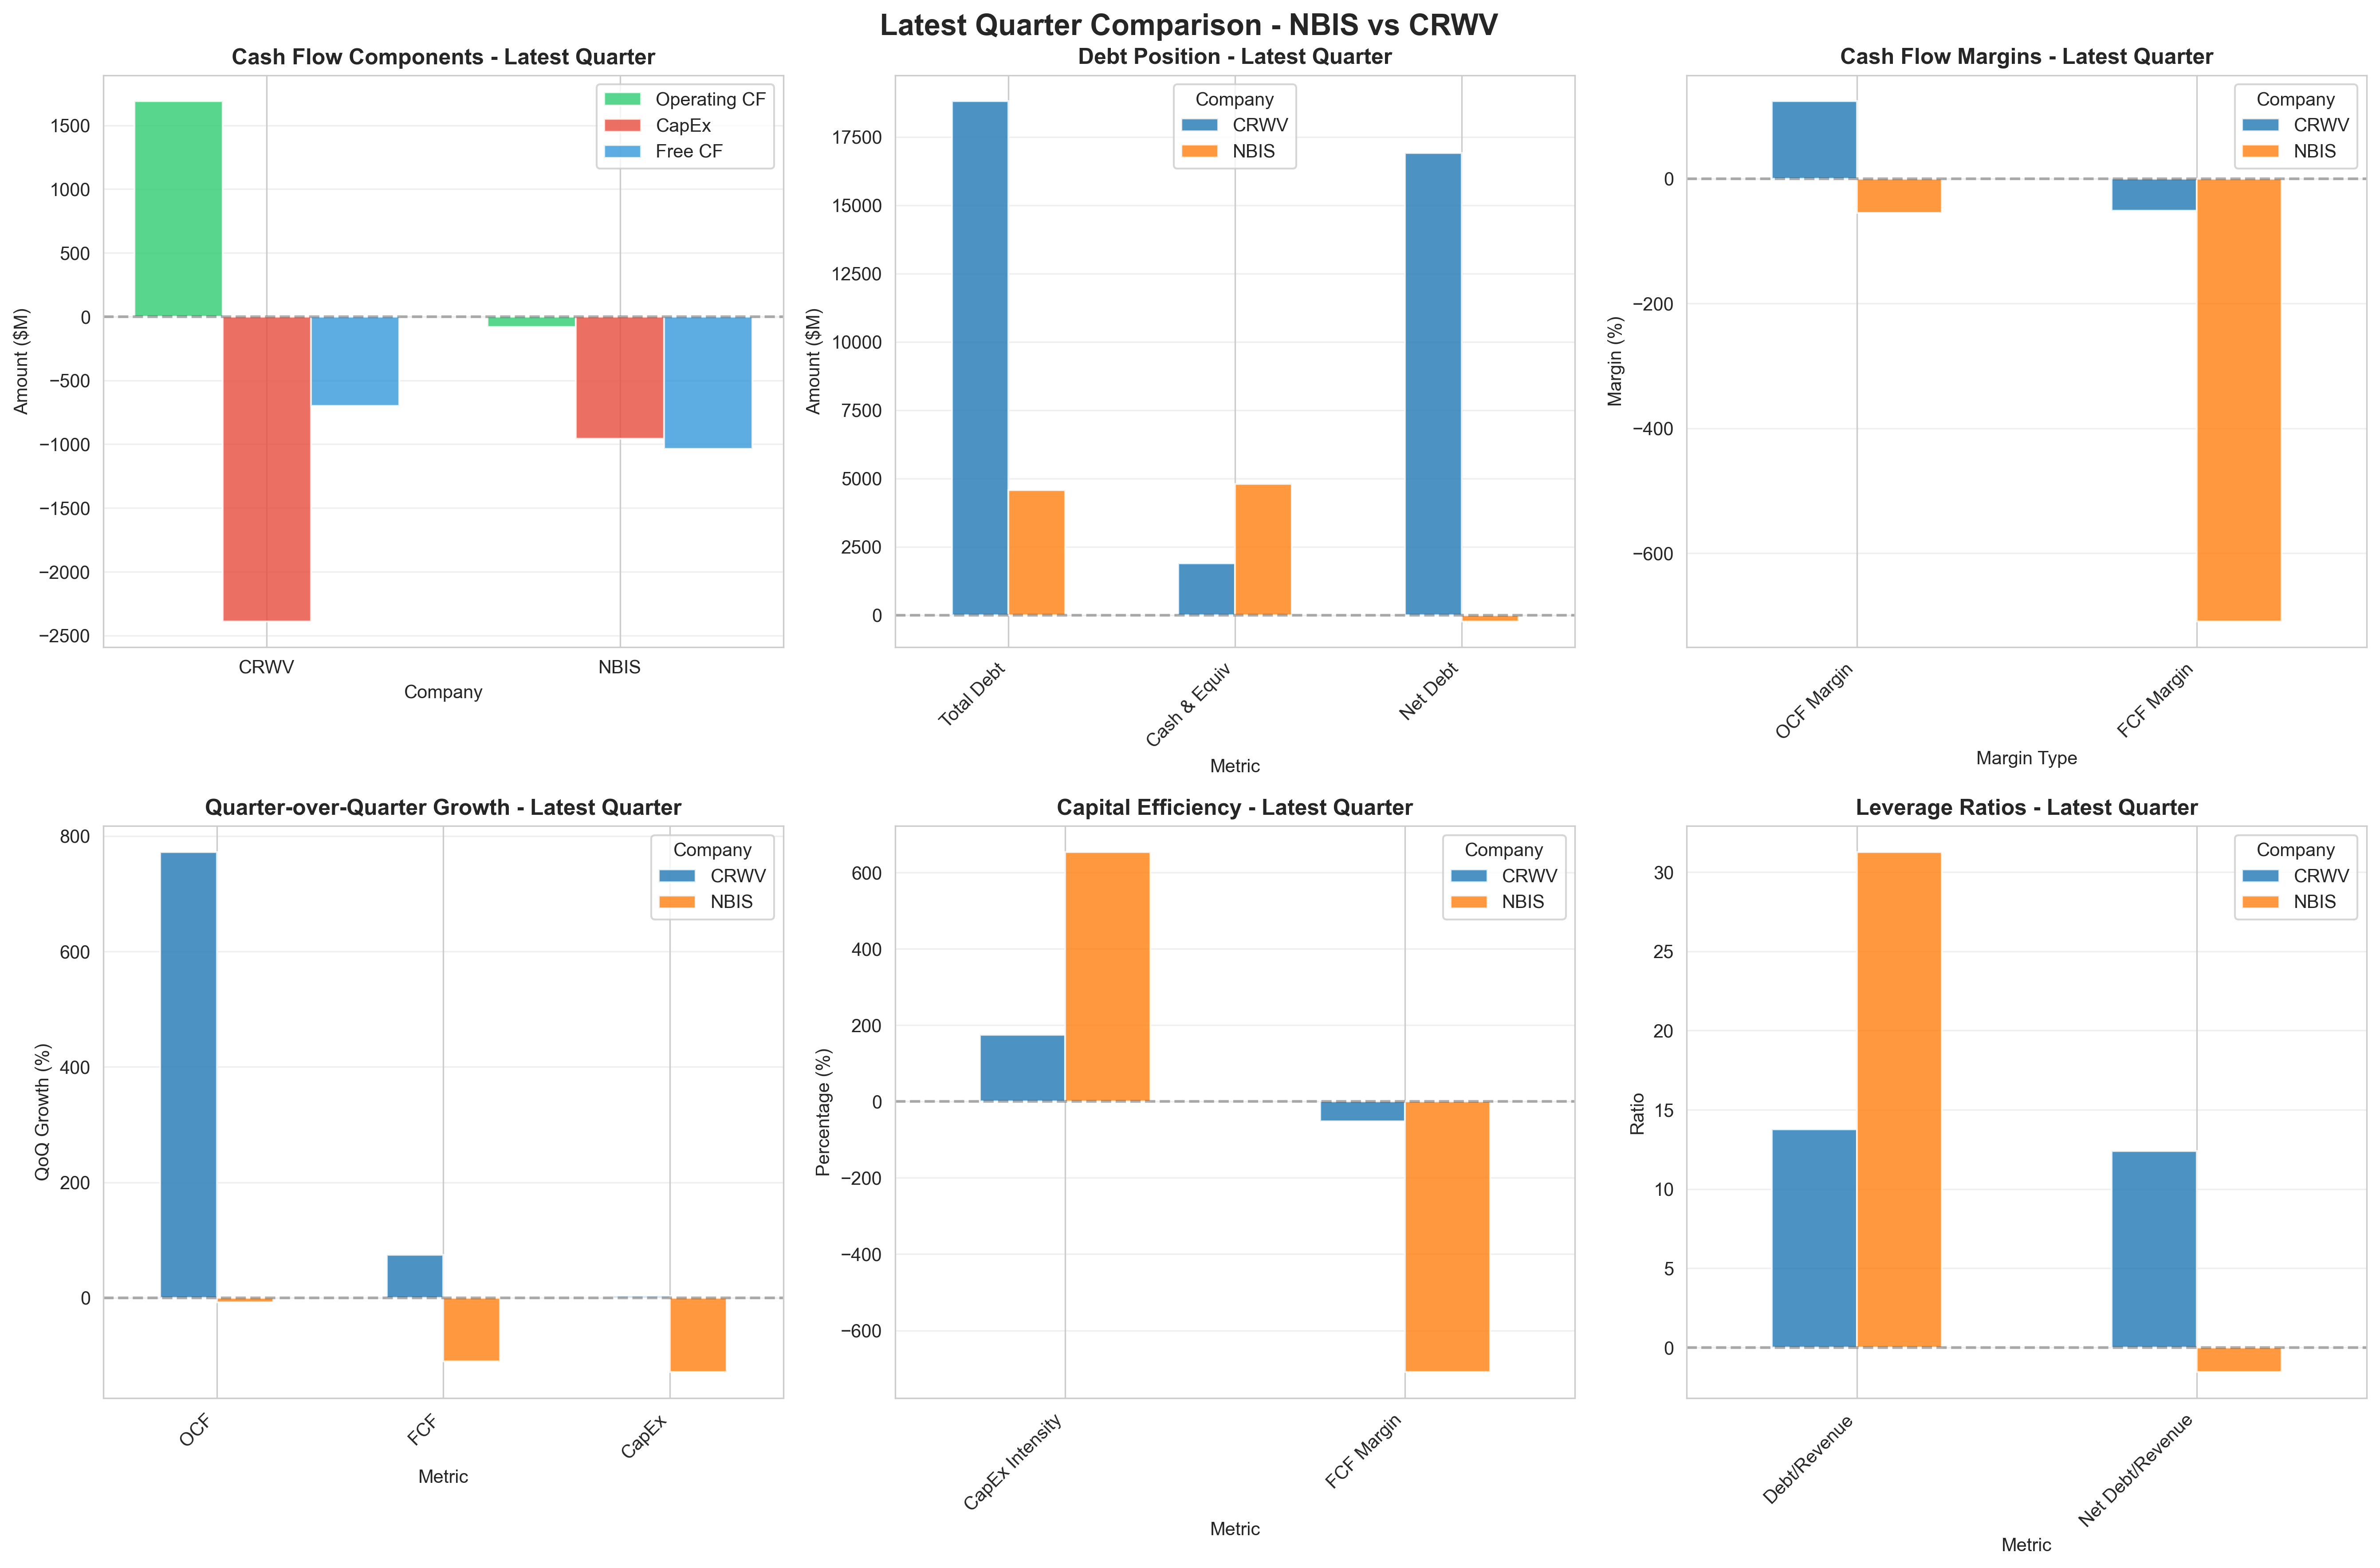 Figure 5: Latest quarter comparison. Top left shows Coreweave generates substantial operating cash (green) but both companies have deeply negative free cash flow (blue) after CapEx (red). Top right shows Coreweave's massive debt load ($18.8B) dwarfs Nebius ($4.6B), but Coreweave has more cash. Bottom charts reveal the scale of debt issuance needed to fund operations.
📖 How to Read This Chart
This 6-panel comparison shows Q3 2025 side-by-side metrics for both companies.
Top Left - Cash Flow Components:
- Three bars per company: Operating CF (green), CapEx (red), Free CF (blue)
- Black dashed line at zero = the "break-even" line
- Above zero = generating cash
- Below zero = burning cash
What to look for:
- 📊 Nebius: All bars below zero = burning at every stage
- 📊 Coreweave: Green bar (OCF) above zero, but red (CapEx) bar is huge and negative
- 🎯 The blue bars (FCF) are what matters—both negative
Top Middle - Debt Position:
- Three metrics: Total Debt, Cash & Equivalents, Net Debt
- Grouped bars show Nebius (blue) vs Coreweave (orange)
- Scale matters: Coreweave's bars are 4× taller = much more debt
Key observations:
- 📊 Coreweave: $18.8B debt, $1.9B cash = $16.9B net debt exposure
- 📊 Nebius: $4.6B debt, $4.8B cash = negative net debt (more cash than debt!)
- 🤔 Why does Nebius have more cash than debt? Because they just raised $3.2B in Q3!
Top Right - Cash Flow Margins:
- OCF Margin = Operating Cash Flow ÷ Revenue
- FCF Margin = Free Cash Flow ÷ Revenue
- Healthy companies: Both positive, FCF margin >10%
What the chart shows:
- 📊 Coreweave: +124% OCF margin (inflated by WC trick), -51% FCF margin
- 📊 Nebius: Both deeply negative (chart shows bars far below zero)
- 🚨 FCF margins tell the truth: Both are cash burners
Bottom Left - QoQ Growth:
- How much OCF, FCF, and CapEx changed from previous quarter
- Dramatic swings indicate instability
Key patterns:
- 📊 Coreweave: +772% OCF QoQ = the working capital manipulation
- 📊 Nebius: Negative growth = getting worse
- ⚠️ Volatile growth = unpredictable business
Bottom Middle - Capital Efficiency:
- CapEx Intensity: How much you spend on infrastructure per $1 of revenue
- FCF Margin: Already explained above
- Ideal: Low CapEx intensity, high FCF margin
- Reality here: High CapEx intensity, negative FCF margin = burning cash to grow
Bottom Right - Leverage Ratios:
- Debt/Revenue: Years of revenue needed to pay off debt
- Net Debt/Revenue: Same but accounting for cash reserves
- Healthy range: 1-3× for mature companies, <5× for growth companies
What to see:
- 📊 Coreweave: 13.8× debt-to-revenue = dangerously high
- 📊 Nebius: 31.3× debt-to-revenue = catastrophically high
- 🚨 These are "zombie company" levels of leverage
🎯 What This Chart Tells You:
- Both companies burn free cash (top left blue bars)
- Both carry excessive debt (bottom right)
- Coreweave's Q3 cash flow was artificial (bottom left growth spike)
- Neither is efficiently converting revenue to cash (top right, bottom middle)
Part 6: Is This a Bubble? 🎈
Let's synthesize what we've learned:
The Bull Case (Why This Might Work)
1. Infrastructure Build-Out Phase
- Both companies are in "land grab" mode, building infrastructure before it's profitable
- Coreweave's 73.0% gross margin suggests the unit economics could work at scale
- If AI demand materializes, they'll own critical infrastructure
2. Revenue Is Growing
- Nebius: +45.1% QoQ
- Coreweave: +12.5% QoQ
- Market clearly wants what they're building
3. Coreweave Generates Operating Cash
- Even without WC games, Coreweave generated $671M in core OCF
- That's a 49.2% core OCF margin—quite healthy
- Shows the business model can work
The Bear Case (Why This Might Implode)
1. Neither Company Is Profitable
- Nebius: Losing $120M/quarter at -81.9% margins
- Coreweave: Losing $110M/quarter despite massive scale
- No clear path to profitability visible in the data
2. Unsustainable Debt Accumulation
- Nebius debt increased 9,000%+ in one year
- Coreweave carrying $18.8B in debt (13.8× revenue)
- Interest expense growing: Coreweave paid $311M in interest in Q3 alone
- If debt markets close or rates rise, both companies face existential crisis
3. CapEx Treadmill
- Nebius spending 654% of revenue on CapEx
- Coreweave spending 175% of revenue on CapEx
- This is not sustainable long-term
- If they slow CapEx, competitors may leapfrog them
- If they continue, debt load becomes unmanageable
4. The Working Capital Red Flag
- Coreweave's Q3 "cash generation" was financial engineering
- Collected $1.1B from customers (can't repeat)
- Delayed $622M to suppliers (strains relationships)
- Q4 will likely show OCF crash when WC normalizes
5. Margin Compression
- Nebius margins getting worse despite revenue growth
- Operating margin declined 162.0 points over 5 quarters
- Suggests fundamental business model problems
Part 7: The Verdict ⚖️
Two Different Flavors of Risky
Nebius: High-Risk Moonshot 🚀
- Tiny scale ($146M quarterly revenue)
- Massively unprofitable (-81.9% net margin)
- 100% debt-funded
- Hemorrhaging cash ($80M OCF burn)
Verdict: This is a venture capital-style bet. Either:
- ✅ AI infrastructure demand explodes, revenue scales 10-20×, margins improve dramatically, debt becomes manageable
- ❌ Debt markets close, can't raise more capital, files for bankruptcy
Probability: This looks like a bubble stock. The numbers don't support the current path.
Coreweave: Overleveraged Growth Story 📊
- Meaningful scale ($1365M quarterly revenue)
- Generates strong core operating cash ($671M/quarter)
- But: carrying $18.8B in debt
- Still unprofitable (-8.1% net margin)
- Spending 175% of revenue on CapEx
Verdict: This could work if:
- ✅ CapEx spending moderates in next 2-3 years
- ✅ Revenue continues growing at 10-15%+ annually
- ✅ Operating leverage kicks in (margins improve)
- ✅ Debt markets remain open for refinancing
But it fails if:
- ❌ AI infrastructure demand plateaus
- ❌ Debt markets seize up
- ❌ Interest rates stay high
- ❌ Competitors force price cuts
Probability: 40% this works out, 60% it ends badly. The debt load is the Sword of Damocles.
Conclusion: The AI Infrastructure Gamble 🎲
These two companies represent a microcosm of the current AI bubble:
- Massive Capital Expenditures — Building infrastructure at unprecedented scale
- No Profitability — Both deeply unprofitable despite growing revenue
- Debt-Fueled Growth — Neither can self-fund their growth
- Racing Against Time — Must achieve profitability before debt markets close
Is This a Bubble?
Yes, if:
- AI demand doesn't materialize at the scale needed to justify these investments
- Debt markets close before these companies reach profitability
- Interest rates stay high, making debt servicing impossible
- Technology shifts make current infrastructure obsolete
No, if:
- AI adoption accelerates beyond current expectations
- Infrastructure becomes a moat that justifies the investment
- Companies achieve operating leverage and reach profitability
- Debt markets remain accommodative
What to Watch
For Nebius:
- Can revenue grow 5-10× in the next 2 years?
- Do margins improve as they scale?
- Can they continue raising debt?
For Coreweave:
- Does Q4 OCF collapse when working capital normalizes?
- Does CapEx spending moderate?
- Can they reach positive net income in 2026?
- Do they refinance existing debt successfully?
The Bottom Line
Both companies are making a leveraged bet on AI infrastructure demand. The numbers suggest they're building for a future that might materialize—but if it doesn't, the debt load will crush them.
This is a bubble that could inflate further or pop spectacularly. The data suggests investors should proceed with extreme caution.
Appendix: Data & Methodology 📊
Data Sources
- Financial statements downloaded from Yahoo Finance (yfinance)
- Analysis period: 5 most recent quarters (Q3 2024 - Q3 2025)
- Data as of: Q3 2025 (most recent reported quarter)
Key Calculations
- Free Cash Flow = Operating Cash Flow - Capital Expenditure
- Net Margin = Net Income ÷ Revenue × 100
- OCF Margin = Operating Cash Flow ÷ Revenue × 100
- CapEx Intensity = Capital Expenditure ÷ Revenue × 100
- Debt-to-Revenue Ratio = Total Debt ÷ Quarterly Revenue
- Core OCF = Operating Cash Flow - Working Capital Changes
Charts Referenced
- Income Statement Trends — 5-quarter view of revenue, income, and margins
- Income Statement Comparison — Latest quarter head-to-head comparison
- Cash Flow Trends — 5-quarter view of OCF, FCF, CapEx, and debt
- Cash Flow Waterfall — OCF to FCF breakdown for latest quarter
- Cash Flow Comparison — Latest quarter cash flow and debt comparison
Analysis generated on November 25, 2025
Disclaimer: This analysis is for educational purposes only. Not financial advice.
Comments (0)
No comments yet. Be the first to comment!