What This Ranking Measures (And Why It Matters)
This ranking spotlights companies that excel at what every business ultimately tries to do: turn sales into profits. While many rankings focus only on how fast companies grow their revenue or how big their profits are, this analysis looks at something more fundamental—how efficiently companies convert their sales growth into even stronger profit growth.
Think of it like this: If a company increases its sales by 10% but grows its profits by 30%, it's becoming more efficient at making money from each dollar of sales. This ability is especially valuable during challenging economic periods like the past three years, which featured post-pandemic recovery challenges, rising interest rates, inflation, and rapid technology changes.
Understanding the Metrics: What Do These Numbers Mean?
The ranking combines five key financial metrics, each with its own importance in evaluating how well companies convert revenue to profit:
- EBITDA Growth (35% of score): EBITDA stands for 'Earnings Before Interest, Taxes, Depreciation, and Amortization.' It shows a company's operational profitability before accounting for non-operational expenses. This measures how much the core business operations are improving year over year.
- Normalized EBITDA Growth (20% of score): This is EBITDA with one-time or unusual items removed. It gives a clearer picture of sustainable, ongoing profit improvement from regular business activities.
- Operating Margin Change (15% of score): This measures how much of each sales dollar a company keeps as operating profit, and how that percentage is improving. A positive number means the company is becoming more efficient at converting sales into profit.
- Revenue Growth (15% of score): The simple year-over-year increase in total sales. This is the foundation that companies build profit growth upon.
- Net Income Growth (15% of score): The growth in bottom-line profits after all expenses. This represents the ultimate financial outcome that matters to shareholders.
How These Metrics Are Calculated
For each company, the analysis compares the most recent quarter's performance (Q1 2025 for most companies) to the same quarter one year ago (Q1 2024). This year-over-year comparison eliminates seasonal variations that might skew the results. The calculations are as follows:
- EBITDA Growth % = ((Recent EBITDA - EBITDA Year Ago) ÷ |EBITDA Year Ago|) × 100
- Normalized EBITDA Growth % = ((Recent Normalized EBITDA - Normalized EBITDA Year Ago) ÷ |Normalized EBITDA Year Ago|) × 100
- Operating Margin Change % = (Recent Operating Income ÷ Recent Revenue) × 100 - (Year Ago Operating Income ÷ Year Ago Revenue) × 100
- Revenue Growth % = ((Recent Revenue - Revenue Year Ago) ÷ Revenue Year Ago) × 100
- Net Income Growth % = ((Recent Net Income - Net Income Year Ago) ÷ |Net Income Year Ago|) × 100
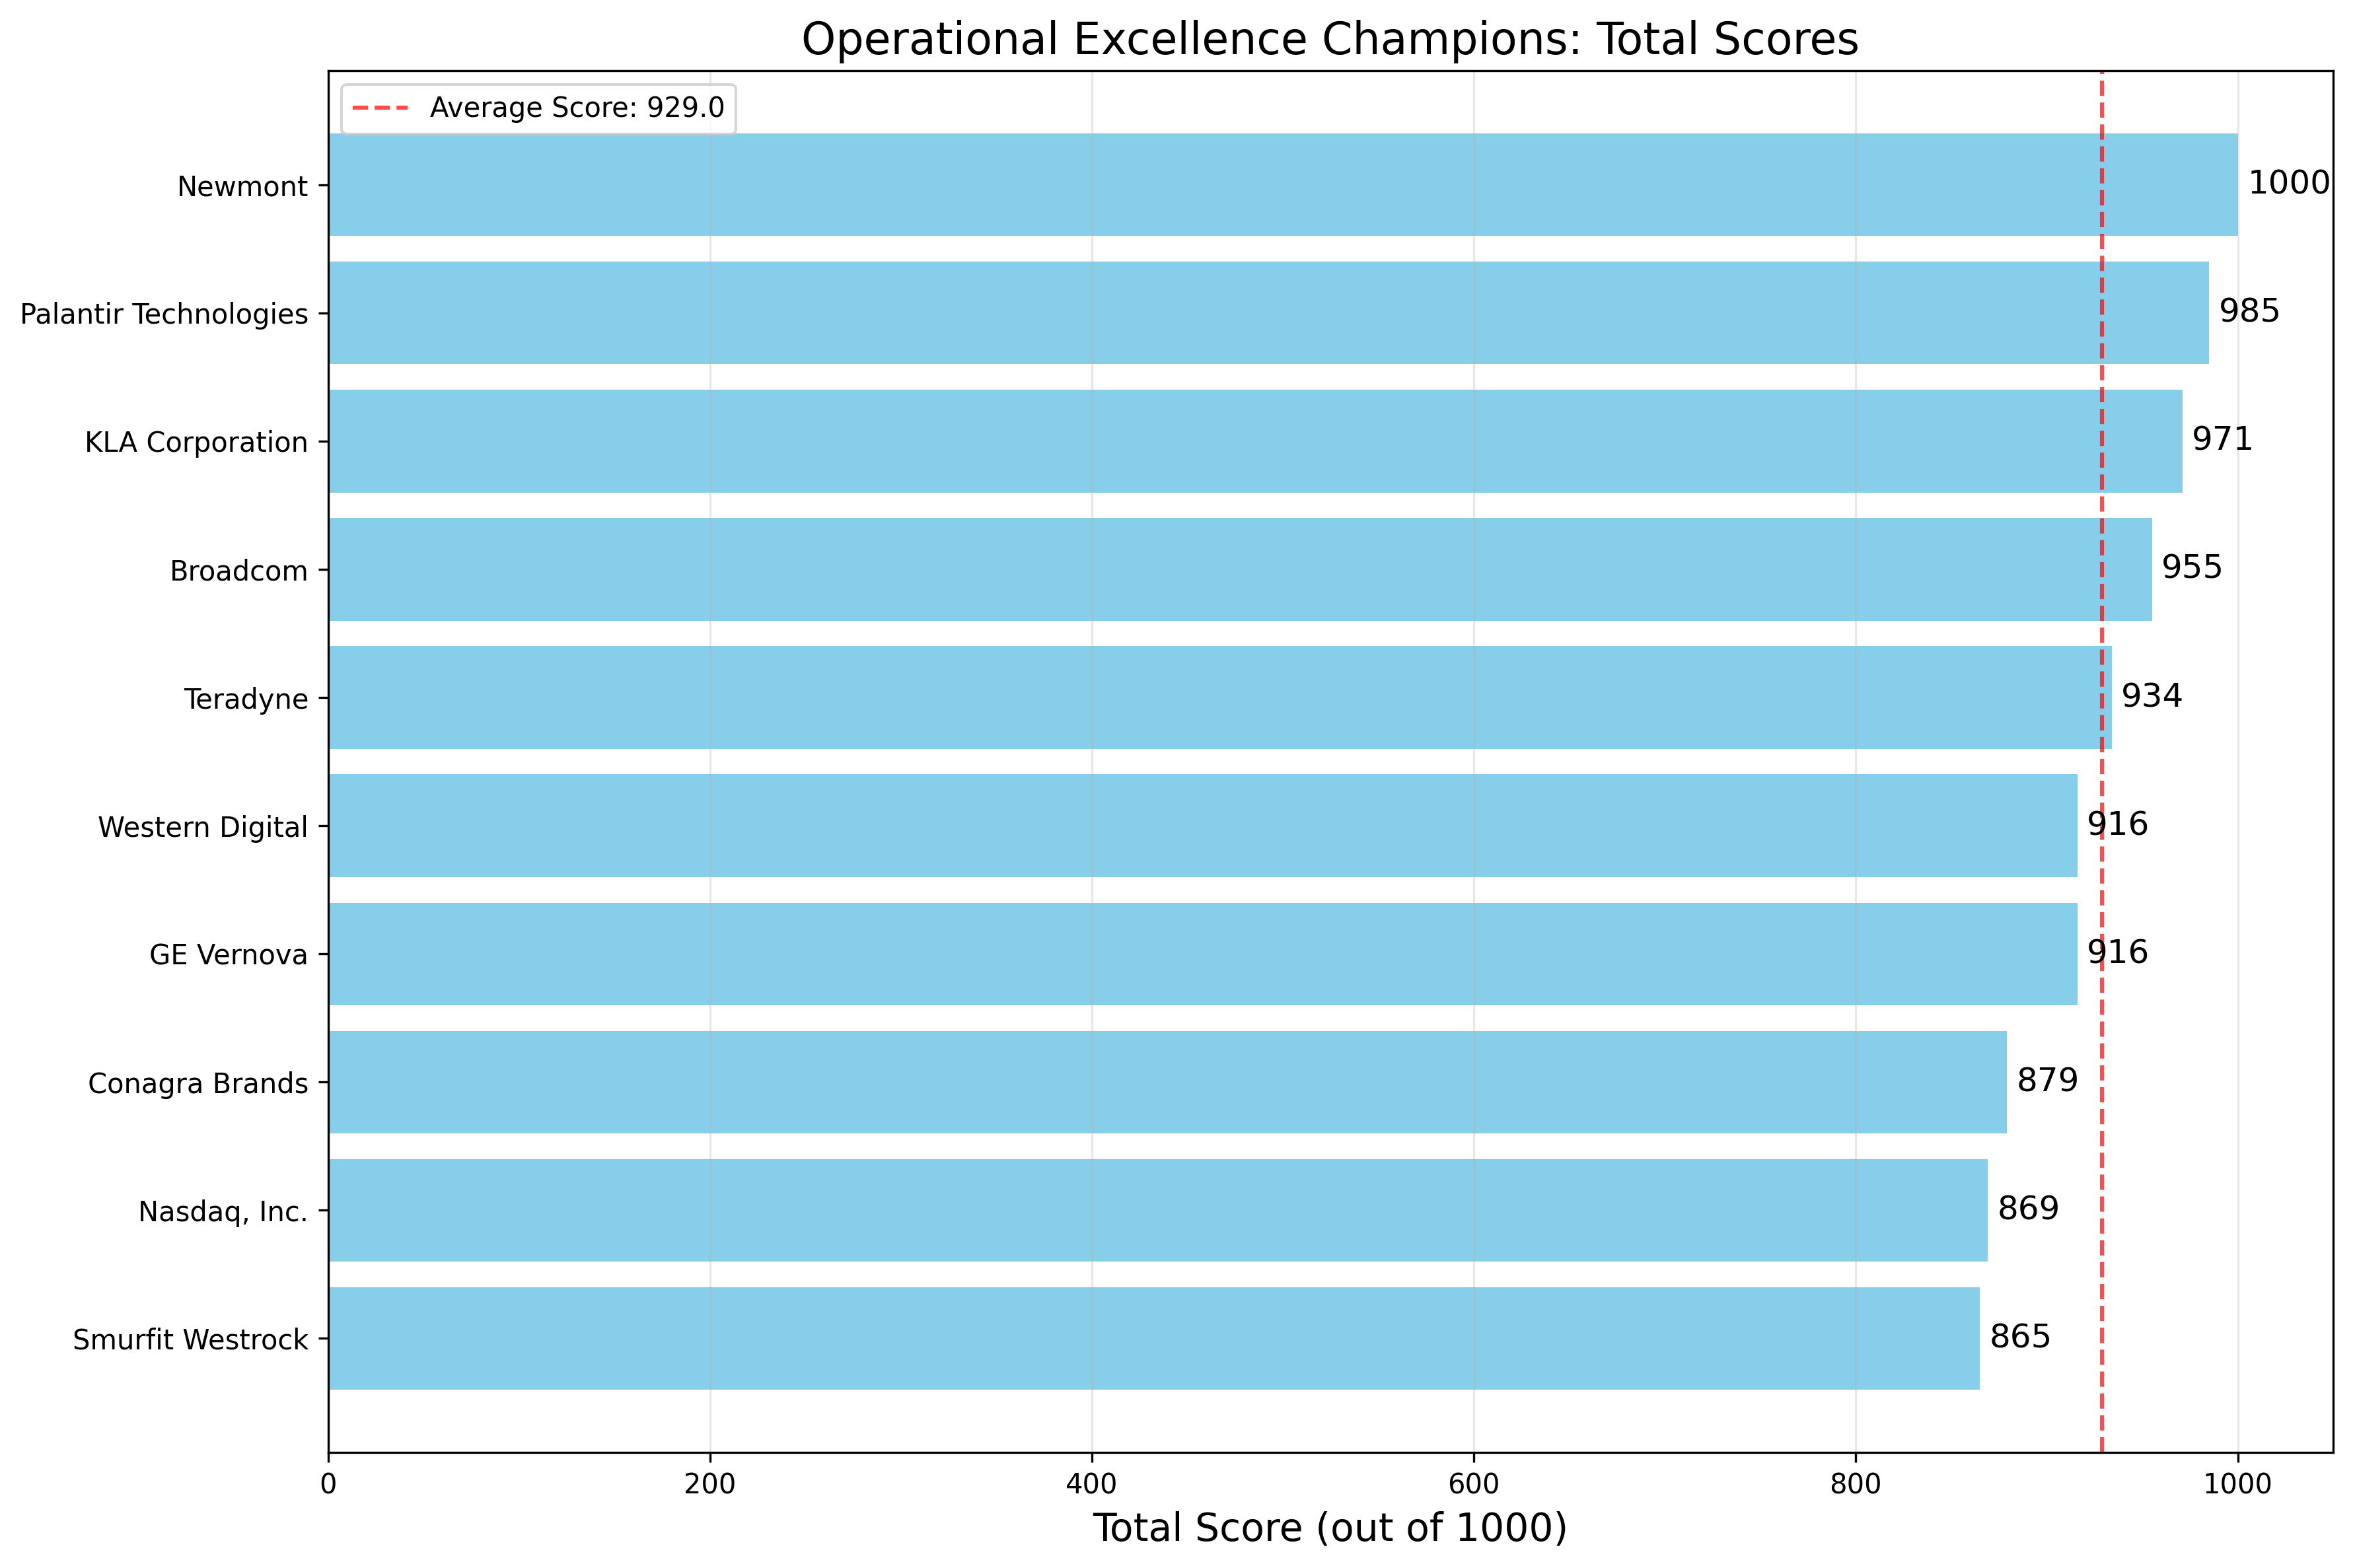
The absolute value signs (|x|) in some formulas ensure proper handling of companies that had negative values in the previous year. Each metric is ranked on a percentile basis and weighted according to its importance. The final score is normalized to a 1000-point scale.
Insights from the Top Performers
The analysis reveals several interesting patterns among the top performers:
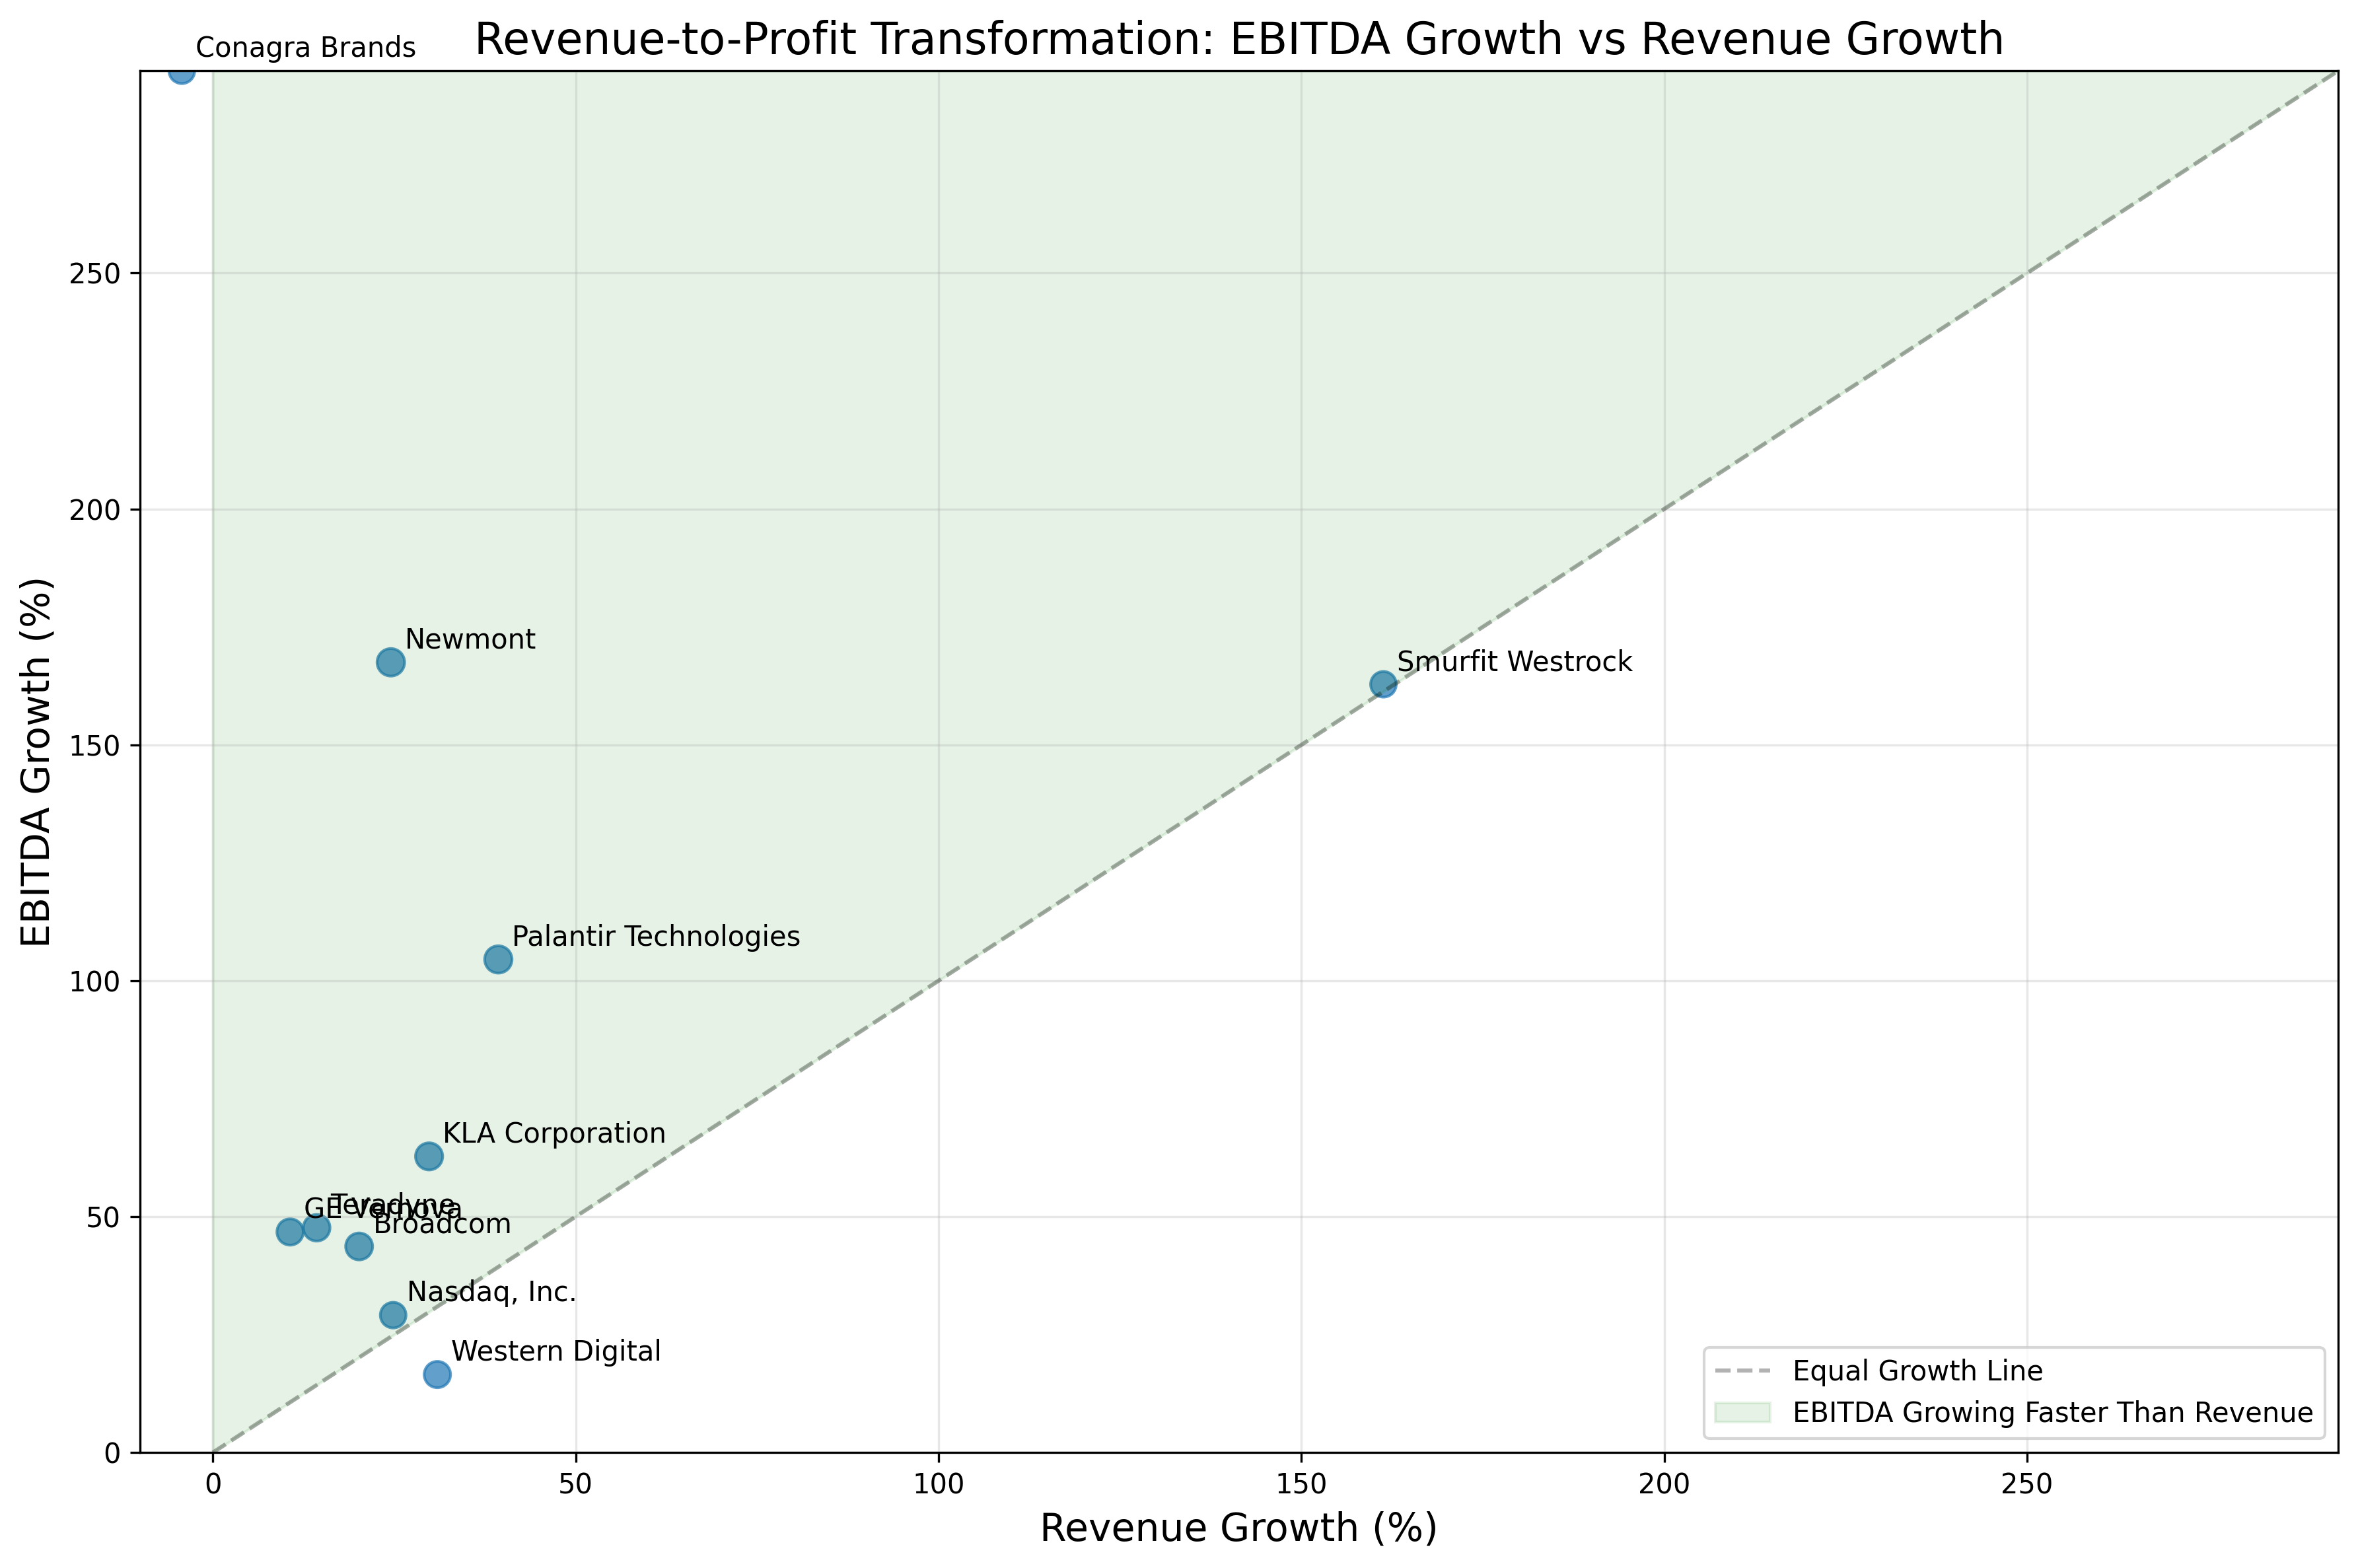
Looking at the chart above, you can see that most top-ranked companies fall in the green area, where EBITDA growth exceeds revenue growth. This is the sweet spot for operational excellence: companies that can grow their profits faster than their sales are becoming more efficient with each dollar they bring in.
Standout Success Stories
Diving deeper into the data reveals some remarkable performance stories:
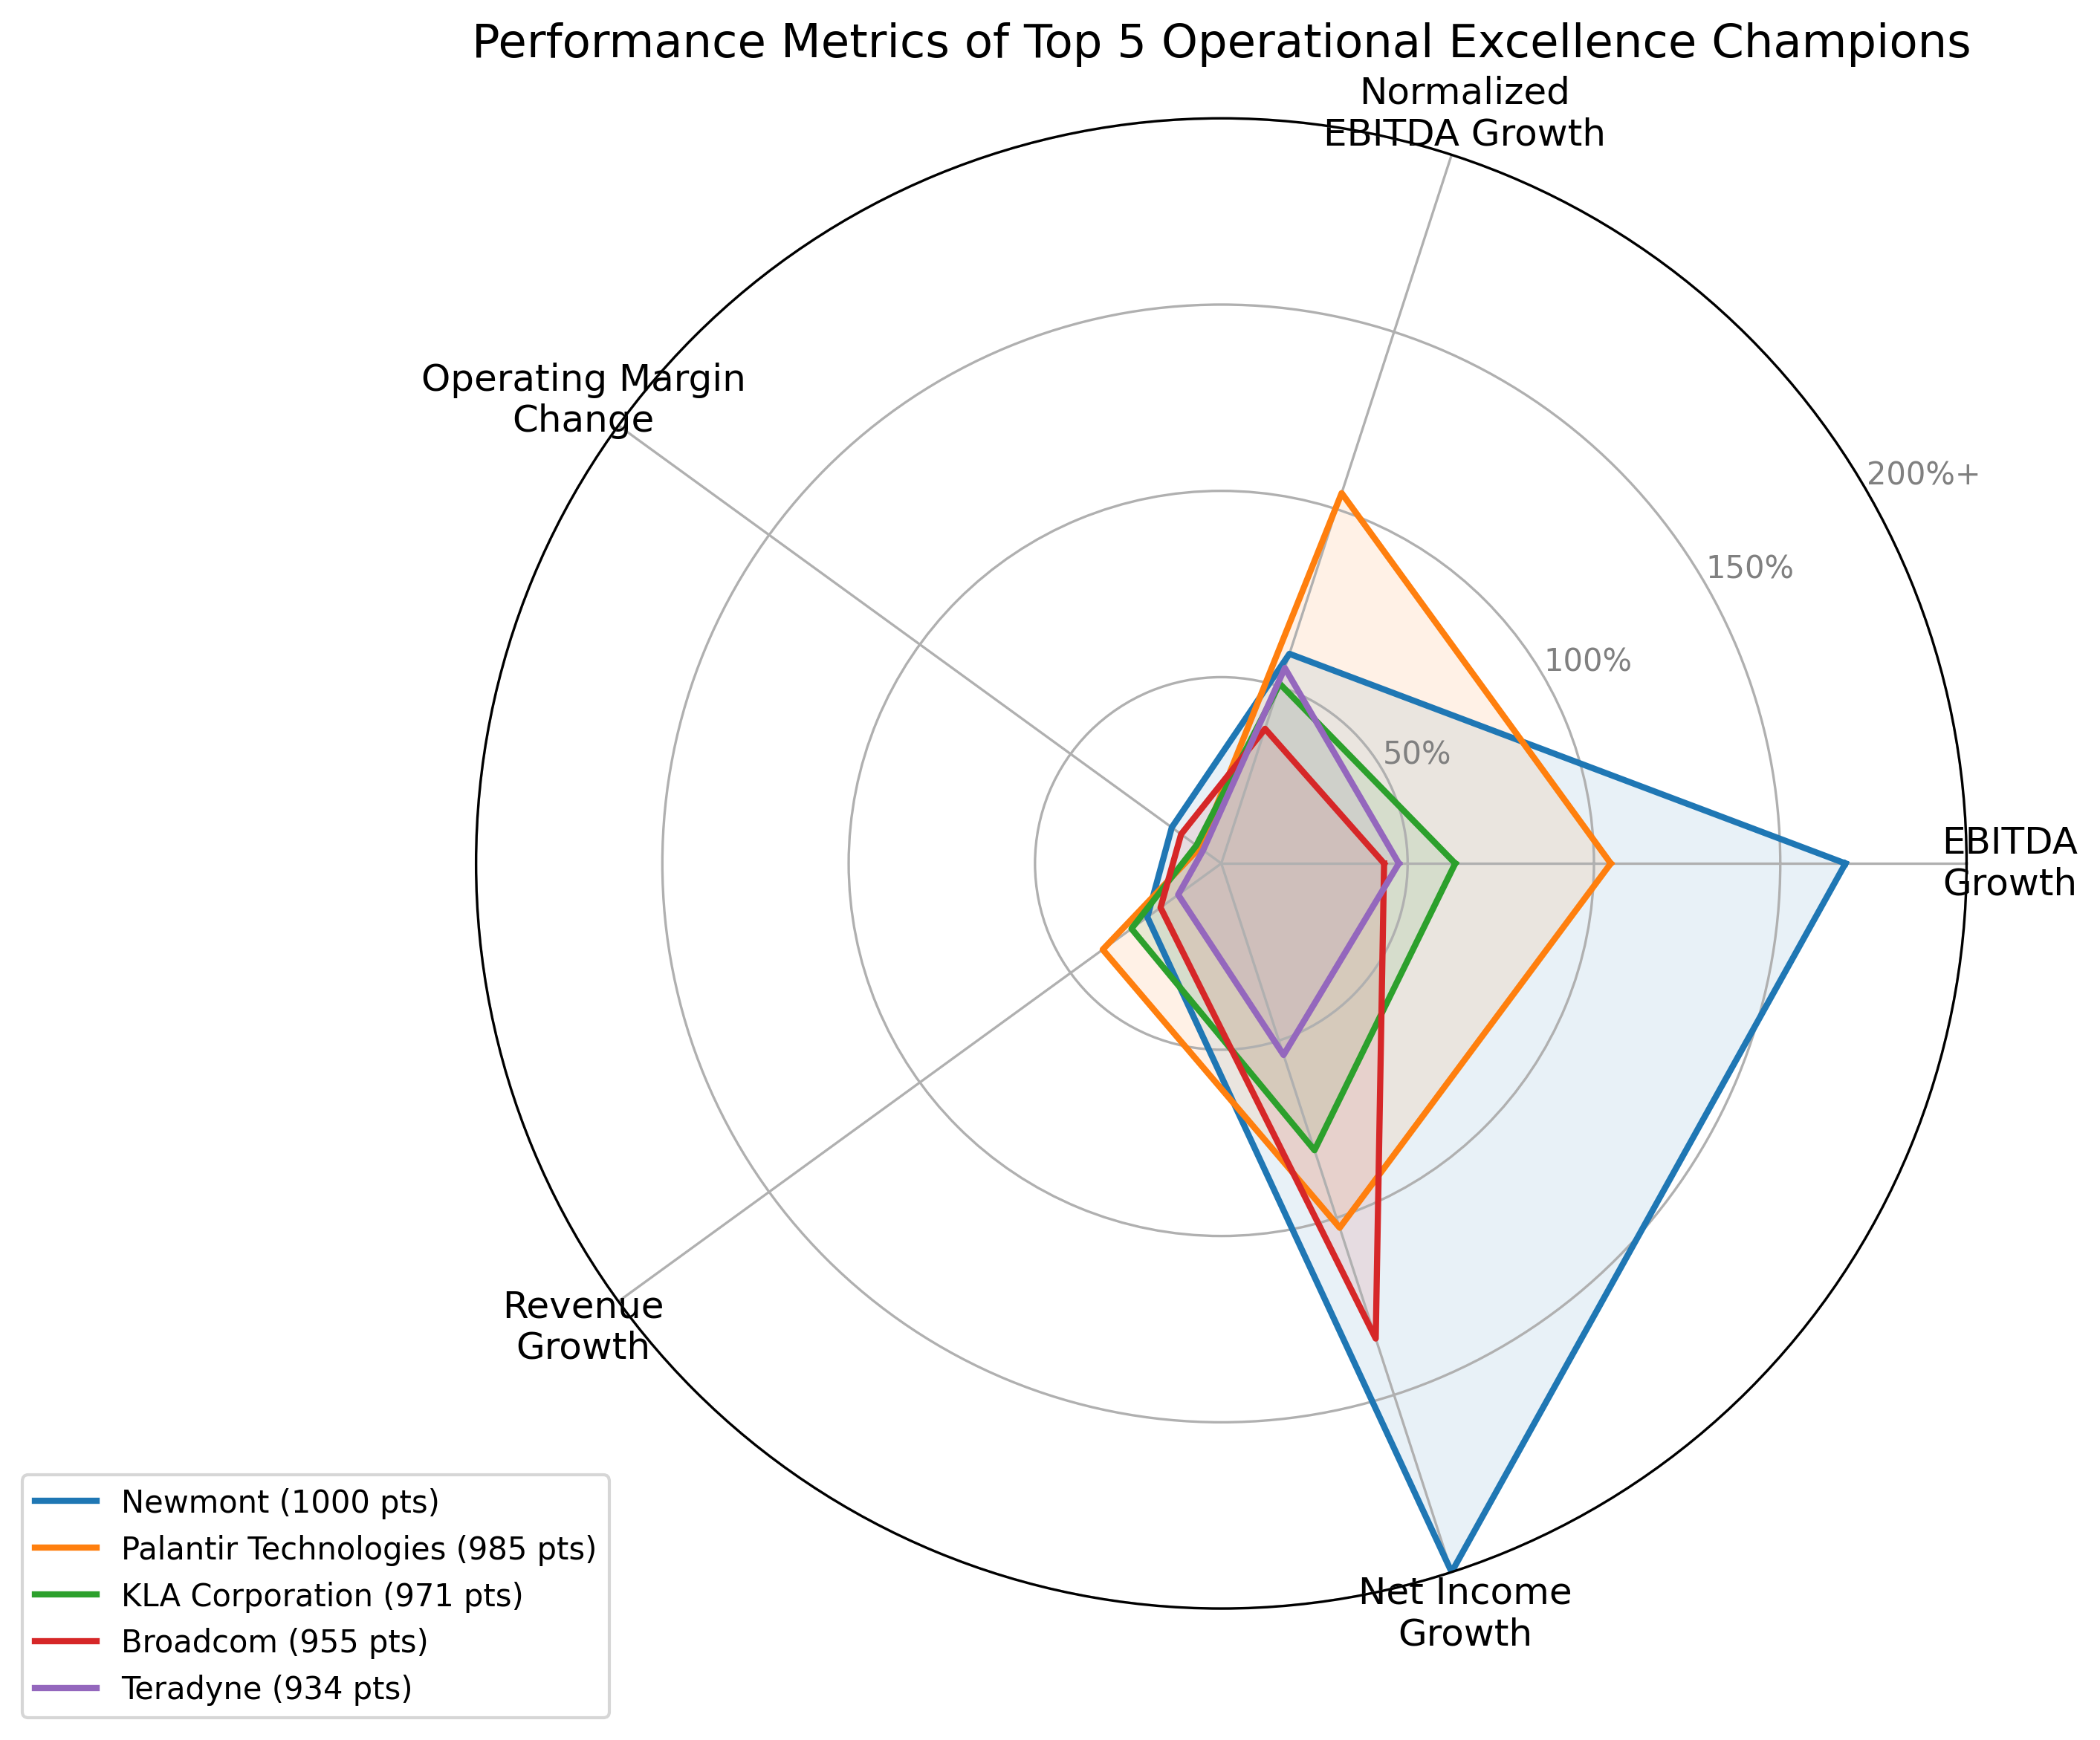
- Newmont (NEM): The top-ranked company achieved 167% EBITDA growth with just 25% revenue growth, showing exceptional operational improvement. Even more impressive is its 1,012% net income growth, demonstrating how operational improvements can dramatically impact bottom-line results.
- Palantir Technologies (PLTR): This data analytics company shows balanced growth across all metrics, with both EBITDA and normalized EBITDA growing at the same 105% rate—indicating high-quality, sustainable earnings improvement.
- Western Digital (WDC): Despite modest 17% EBITDA growth, its normalized EBITDA grew by 181%, suggesting that one-time costs affected the headline number but the underlying business is performing exceptionally well.
- Conagra Brands (CAG): Perhaps most impressive is this food company's ability to grow EBITDA by 293% despite a 4% revenue decline, demonstrating that operational excellence can drive profit growth even without sales growth.
The average operating margin improvement among the top 10 companies is 8.8 percentage points—a substantial increase that reflects their ability to generate more profit from each dollar of sales. These companies have achieved disproportionate profit growth relative to revenue growth, with EBITDA growth rates averaging 90% compared to revenue growth of 35%.
The Bigger Picture: What This Tells Us About Today's Business Environment
The 3-year period from August 2022 to August 2025 has presented unique challenges: post-pandemic recovery, rising interest rates, inflation, and rapid technology transformation. The companies at the top of this ranking have demonstrated exceptional operational excellence despite these challenges.
Looking at the industries represented in the top 10, we see several technology and semiconductor companies (Palantir, KLA, Broadcom, Teradyne, Western Digital), reflecting the ongoing digital transformation across the economy. However, the presence of companies from mining (Newmont), food (Conagra), financial services (Nasdaq), and packaging (Smurfit Westrock) shows that operational excellence is possible across diverse sectors.
The close alignment between EBITDA and normalized EBITDA growth rates for most top performers indicates high-quality, sustainable earnings improvements rather than one-time gains. This suggests these companies have made fundamental operational improvements that should continue to benefit them in the future.
Why This Ranking Matters for Financial Education
Understanding how companies convert revenue into profit is a fundamental financial literacy skill. This ranking provides insights into which companies excel at this crucial business function, offering a unique perspective that goes beyond simplistic growth metrics.
By examining these operational excellence champions, we can better appreciate the complex interplay between sales growth and cost management that drives sustainable business success. The most successful companies don't just grow—they grow efficiently, generating more profit from each additional dollar of revenue.
Comments (0)
No comments yet. Be the first to comment!