Introduction
In the high-stakes world of fintech, few stories capture the market's unforgiving nature better than Flywire's recent rollercoaster ride. After years of promising growth and a much-anticipated transition toward profitability, Flywire Corporation (NASDAQ: FLYW) found itself facing a brutal reality check when its stock plummeted following its Q4 2024 earnings announcement on February 26, 2025.
The numbers tell a paradoxical tale: revenue growth continued its upward trajectory, yet investors fled in droves, erasing nearly 40% of the company's market value overnight. What triggered such a dramatic response? Was it the current financial performance, or something more ominous lurking in the guidance?
In this data-driven analysis, we'll dissect Flywire's financial performance using comprehensive stock data from Tiingo API and financial metrics from yfinance to uncover the real story behind the crash. By examining both the numbers and the market's reaction, we'll reveal whether Flywire's profitability journey hit a temporary roadblock or a more fundamental obstacle.
Stock Price Analysis: Anatomy of a Crash
To understand the magnitude of Flywire's stock price collapse, we need to examine the data surrounding the February 26, 2025 earnings announcement. Using Tiingo API data, we can visualize exactly how dramatically the market reacted to the company's Q4 results.
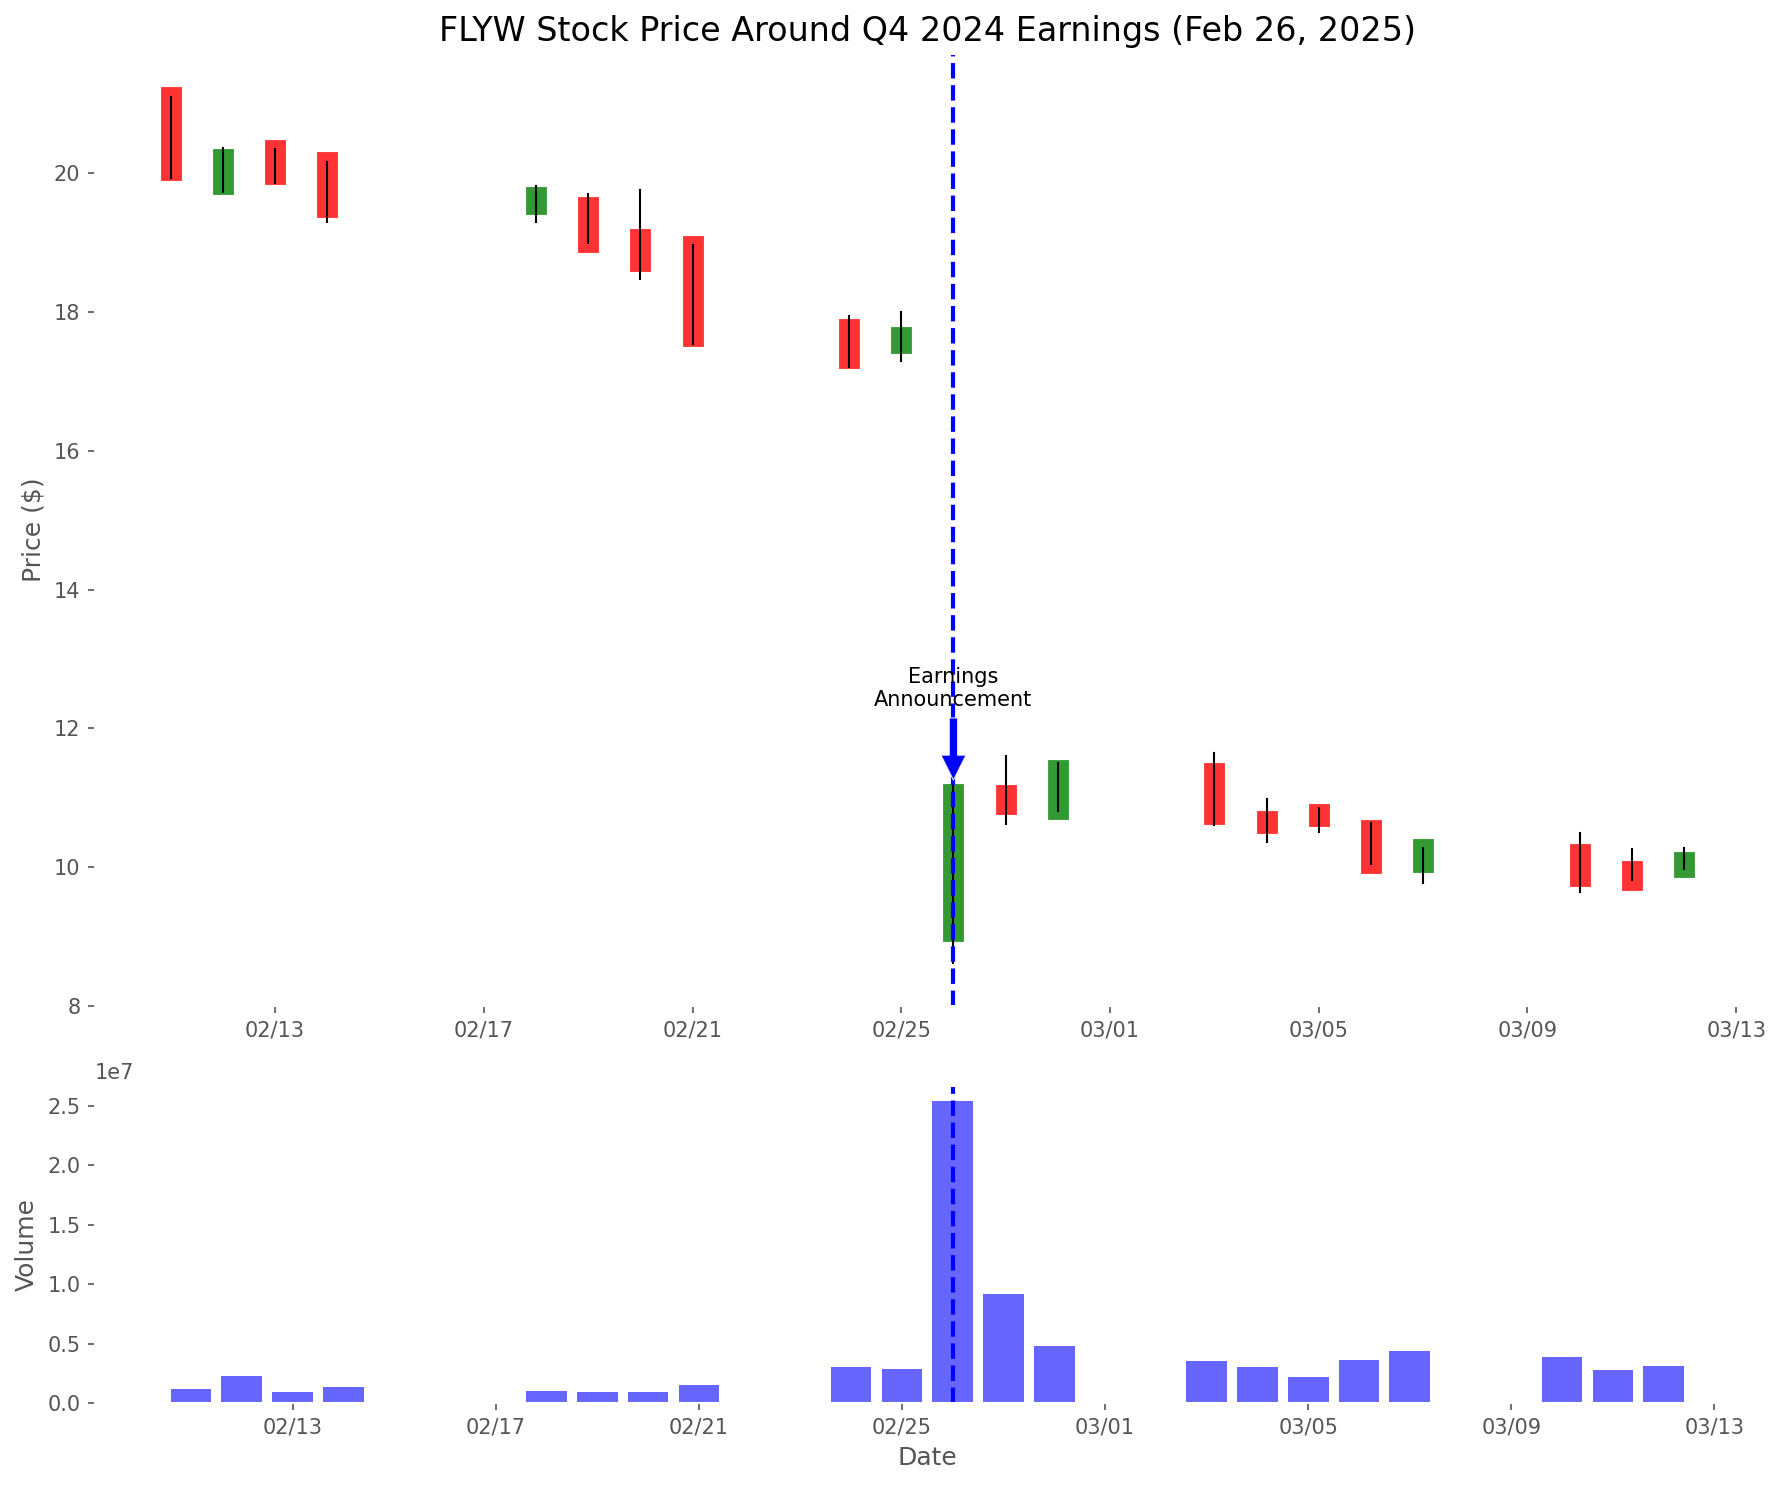
The chart above tells a sobering story. On February 25, 2025, Flywire closed at $17.64. The following day, after the earnings announcement, the stock plunged to $11.05—a staggering 37.36% single-day drop. But the pain didn't end there. Within five trading days, the stock hit a low of $8.62, representing a 51.13% collapse from pre-earnings levels.
This wasn't just a minor correction; it was a fundamental reassessment of Flywire's value proposition. Trading volume exploded by 549.45%, surging from a pre-earnings average daily volume of 1.42 million shares to 9.21 million shares, indicating a massive exodus of investors and entry of short-sellers.
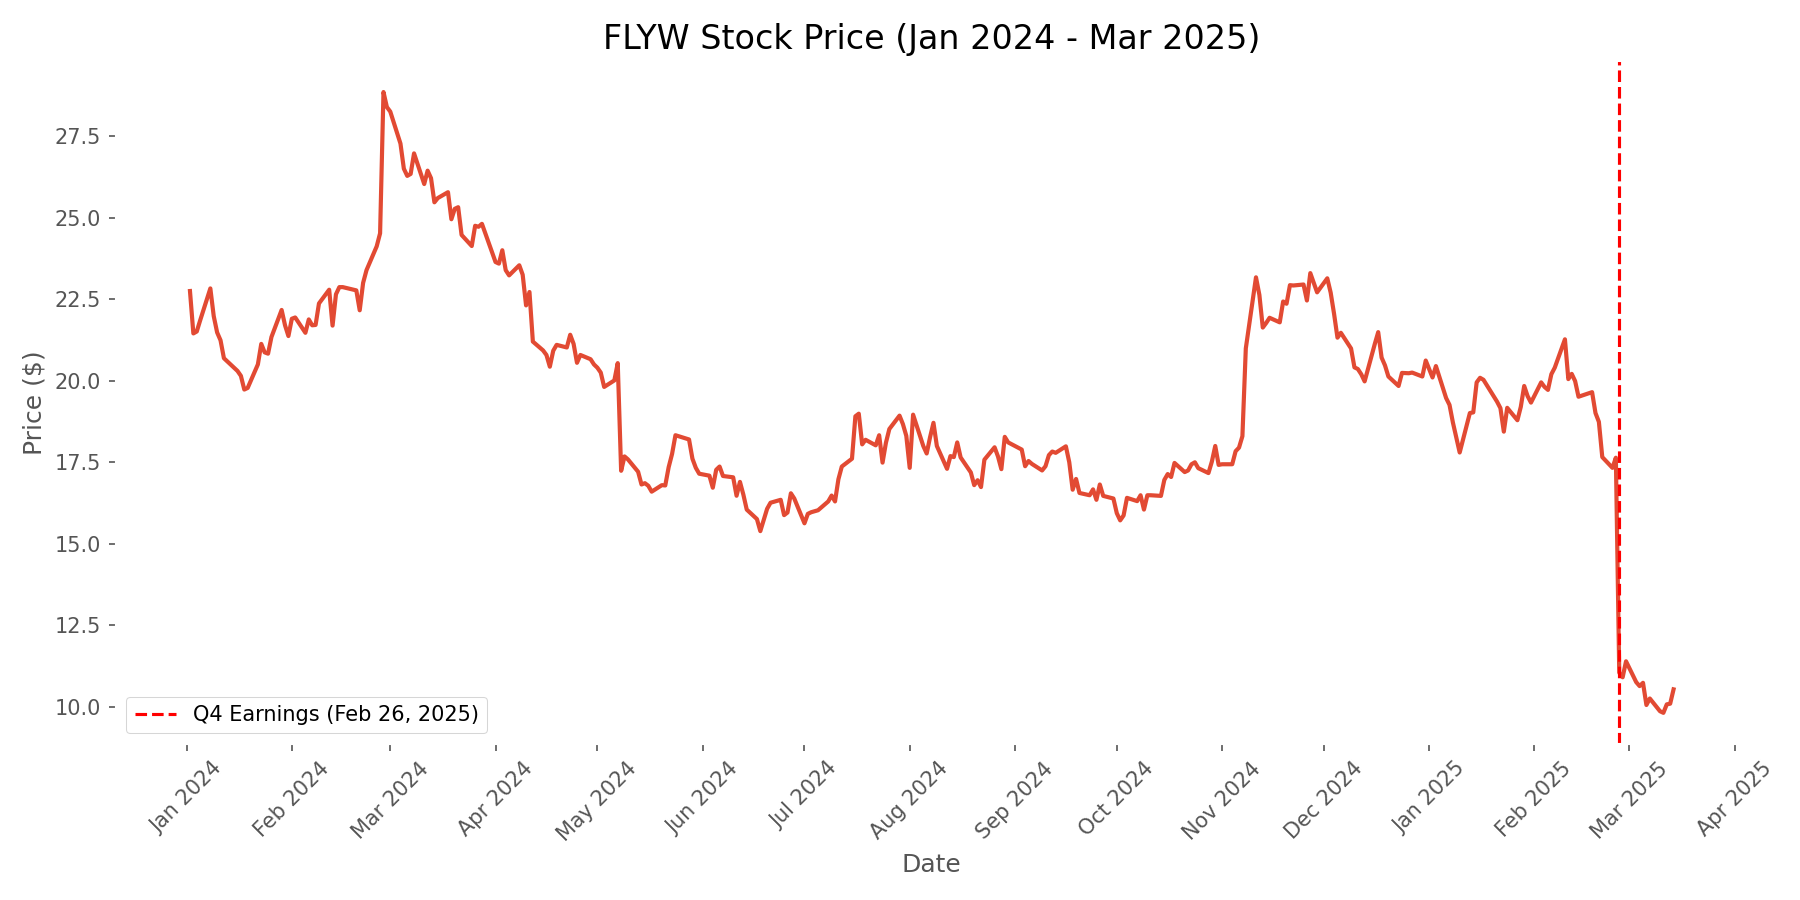
Looking at the broader context, the year-to-date chart above reveals that Flywire had been trading in a relatively stable range throughout early 2025, with investors seemingly confident in the company's trajectory. The February crash wasn't the culmination of a gradual decline—it was a sudden, violent reaction to new information that fundamentally changed the market's perception of Flywire's future.
Volatility metrics confirm the severity of the market's reaction. The Average True Range (ATR), a measure of market volatility, increased by 75.09% in the 10-day period following the earnings announcement compared to the pre-earnings period. This spike in volatility underscores the uncertainty and reassessment that gripped Flywire investors.
Financial Metrics: The Profitability Paradox
To understand why investors reacted so strongly, we need to examine Flywire's Q4 2024 financial performance. The data reveals a complex picture that goes beyond headline revenue numbers.
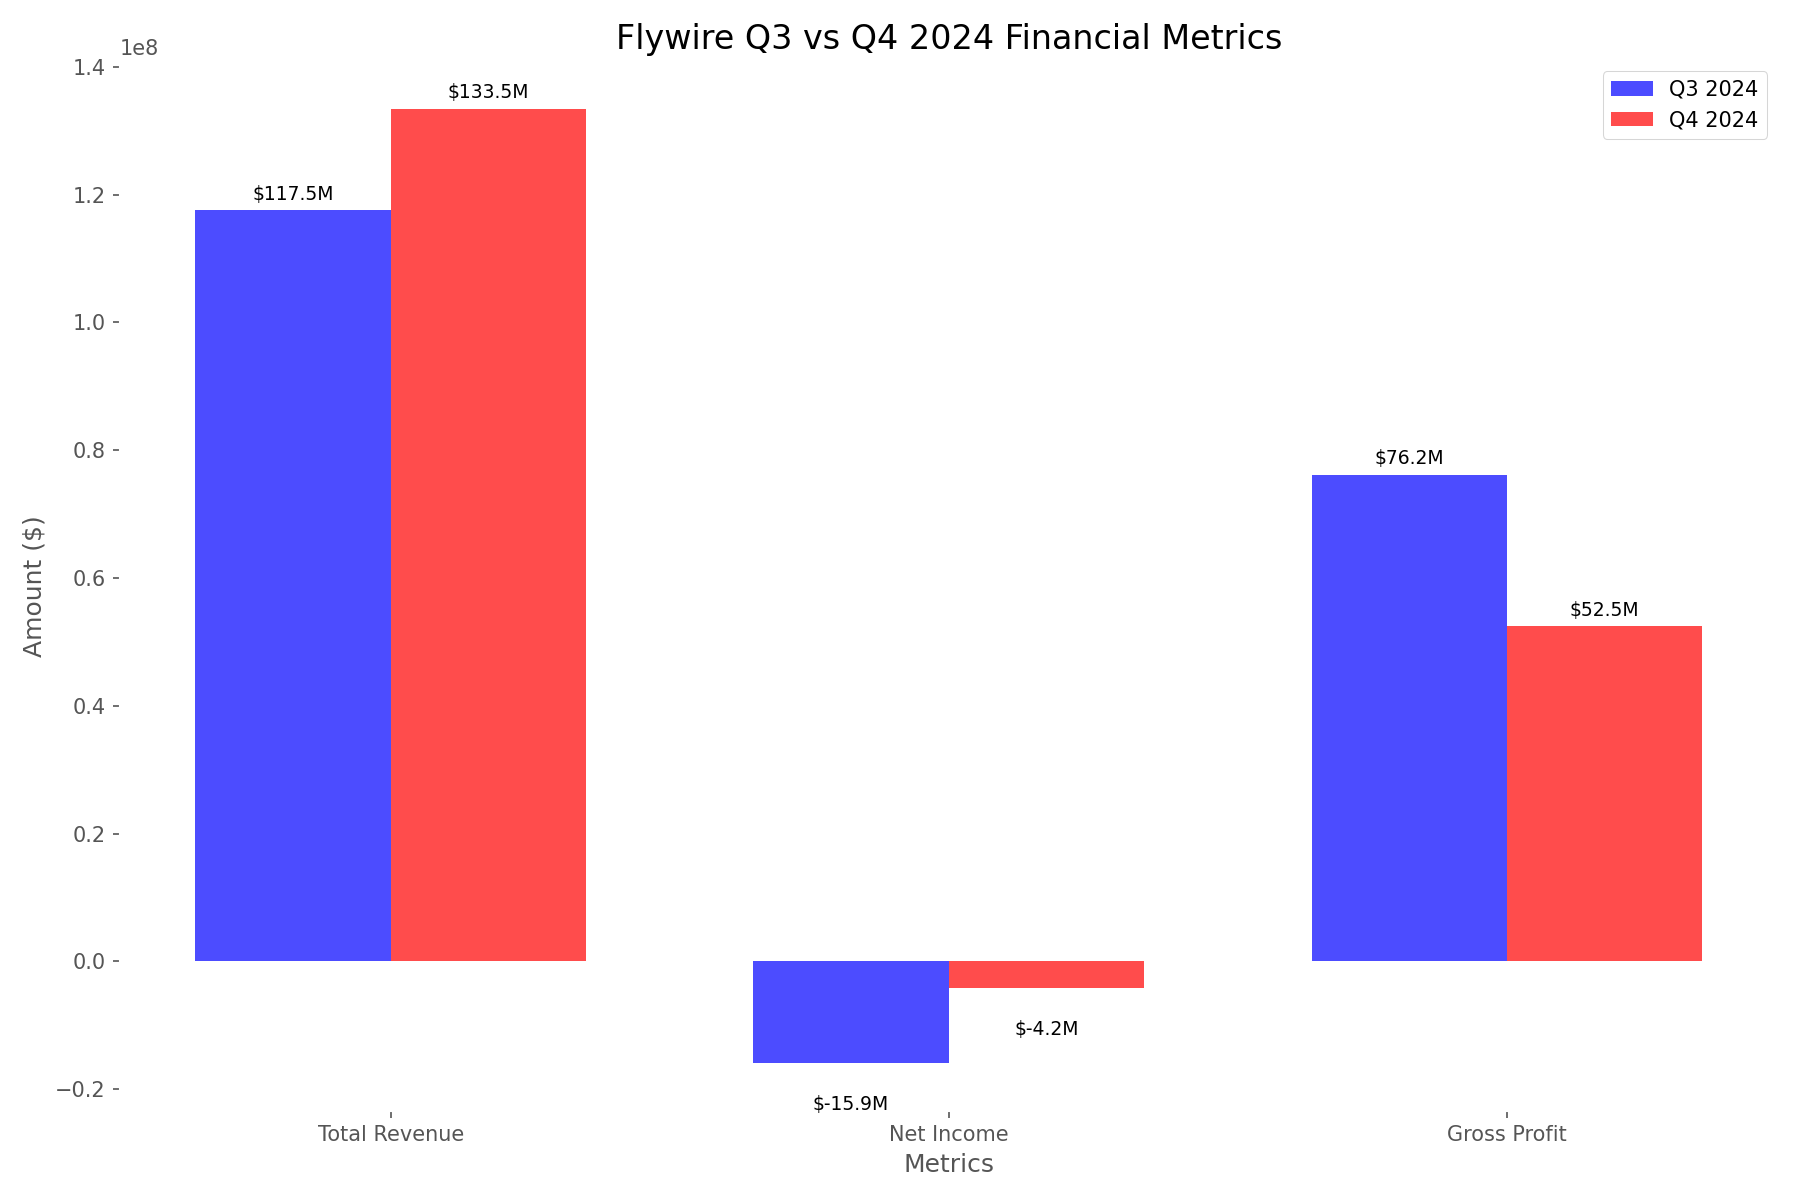
At first glance, Flywire's Q4 2024 results contained positive elements. Total revenue reached $133.45 million, representing a 13.53% increase quarter-over-quarter and a 16.96% increase year-over-year. In isolation, this continued revenue growth would typically be viewed favorably by the market.
However, digging deeper into the financial metrics reveals concerning trends in profitability. Net income, while still negative at -$4.16 million, showed a 73.83% deterioration compared to Q3 2024. Gross profit declined by 31.09%, falling from $76.17 million in Q3 to $52.49 million in Q4. Operating income also worsened, decreasing from -$5.78 million to -$10.99 million, a 90.27% decline.
These metrics paint a picture of a company struggling with profitability despite growing revenue—a classic sign of deteriorating operational efficiency. While EBITDA showed a 99.60% improvement, reaching $7.49 million in Q4, this positive indicator was overshadowed by the broader profitability concerns and what came next in the earnings call.
Market Context: Guidance Shock and Valuation Reset
While Q4's mixed results contributed to investor concern, the true catalyst for the stock crash appears to have been Flywire's 2025 guidance. The company's forward-looking projections sent shockwaves through the market, triggering a fundamental reassessment of Flywire's growth story.
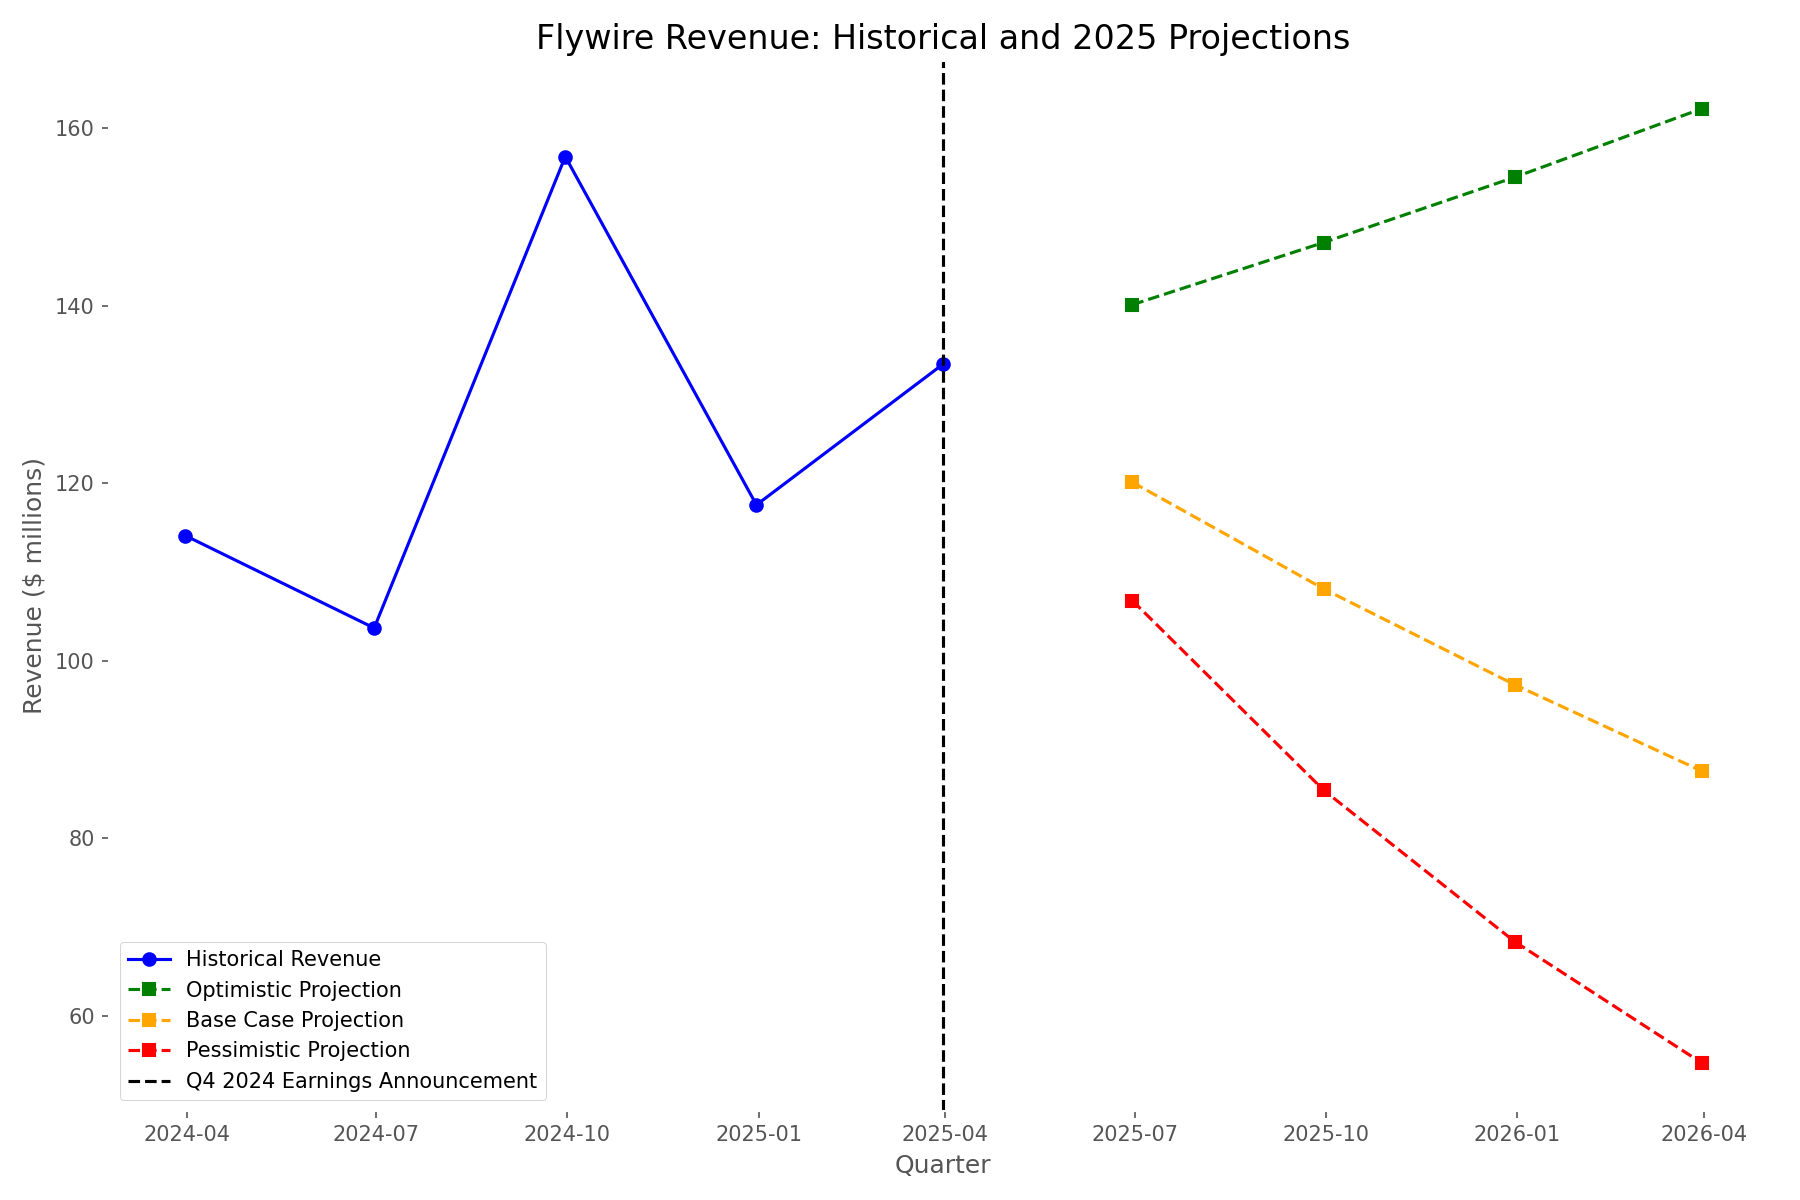
The data reveals that Flywire's management provided guidance suggesting a potential 10% revenue decline in 2025 (the base case scenario). This represents a dramatic reversal from the company's historical growth trajectory and the 16.96% year-over-year growth achieved in Q4 2024.
Even more concerning for investors, the pessimistic scenario projected a 20% revenue decline, which would reduce Flywire's trailing twelve-month revenue to just $266.06 million by Q4 2025—a significant contraction from current levels.
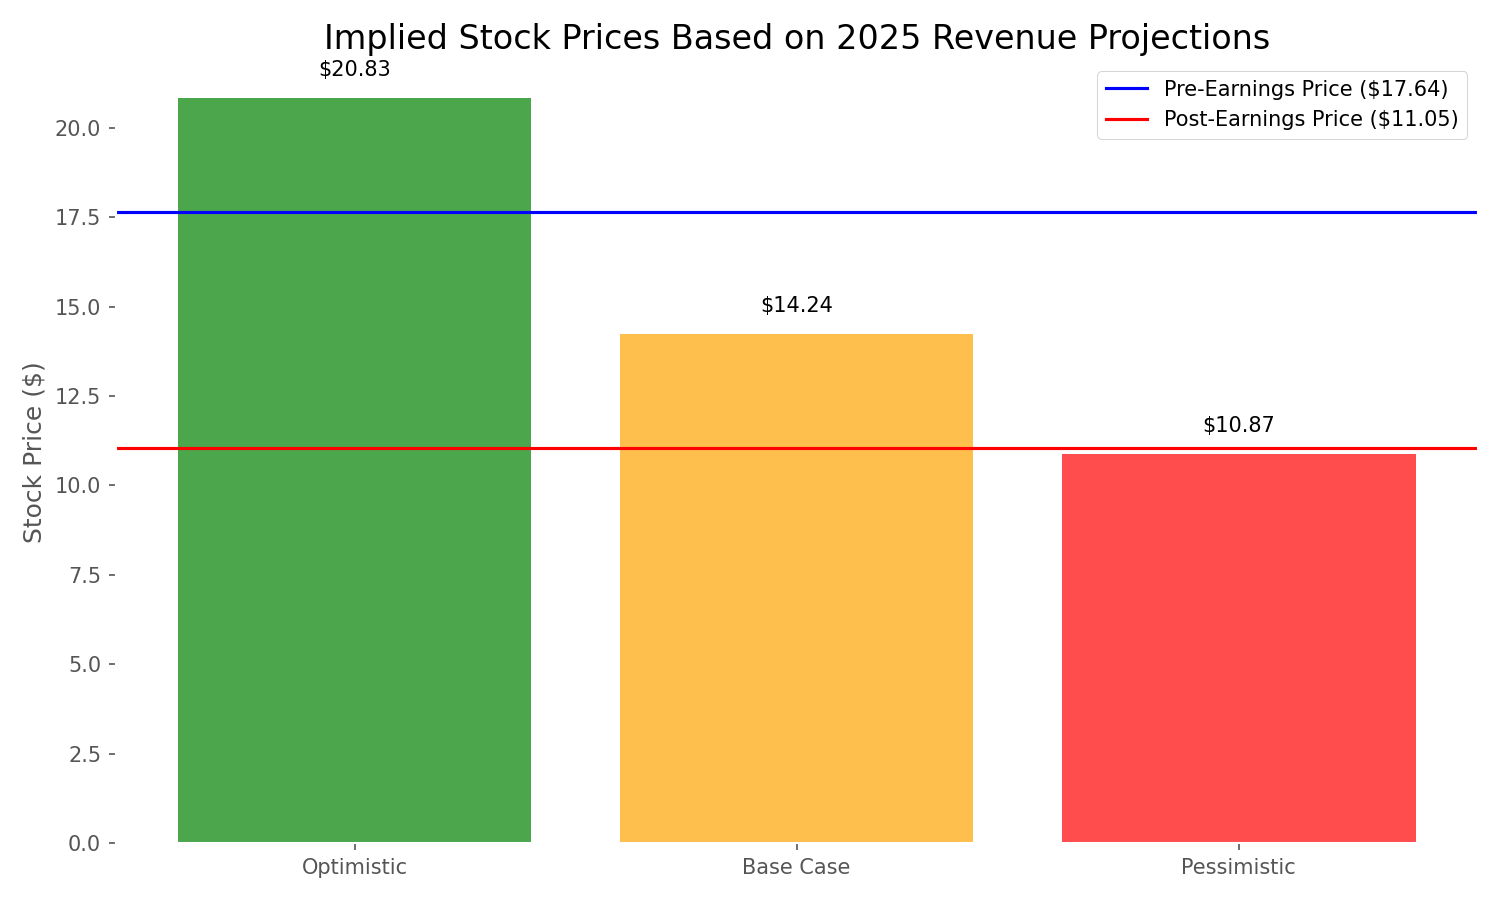
The market's reaction becomes clearer when we analyze the valuation implications of these projections. Prior to the earnings announcement, Flywire traded at a price-to-sales (P/S) ratio of 3.45. After the announcement, this multiple contracted to 2.16—a 37.36% reduction that mirrors the stock price decline.
Interestingly, the post-earnings stock price of $11.05 aligns closely with the implied valuation under the pessimistic scenario ($10.87), suggesting that investors immediately priced in significant revenue challenges for Flywire in 2025. This indicates that the market was primarily reacting to future expectations rather than current performance.
Conclusion: Lessons from Flywire's Fall
Flywire's dramatic stock crash following its Q4 2024 earnings announcement offers a powerful reminder of a fundamental market truth: in growth stocks, future expectations often matter more than current performance. Despite achieving revenue growth in Q4, Flywire's deteriorating profitability metrics and negative guidance for 2025 triggered a massive reassessment of the company's value proposition.
The data tells us that investors weren't simply reacting to a single quarter's results—they were repricing Flywire based on a fundamental shift in its growth narrative. The 37.36% single-day drop and subsequent decline to 51.13% below pre-earnings levels reflect the market's harsh judgment on companies that fail to maintain their growth trajectories.
For investors, Flywire's experience offers several valuable lessons. First, revenue growth alone isn't enough—profitability trends and operational efficiency matter. Second, guidance can often overshadow current results in determining stock performance. Finally, high-growth companies face asymmetric risks when they signal a potential slowdown, as their premium valuations depend on maintaining exceptional growth rates.
As Flywire navigates this challenging period, the key question becomes whether the company can regain investor confidence by demonstrating that its profitability journey remains intact despite the temporary setback. For now, the market has rendered its verdict, and Flywire must prove that its long-term growth story deserves a second look.
Comments (0)
No comments yet. Be the first to comment!