What Makes a Balanced Growth Champion?
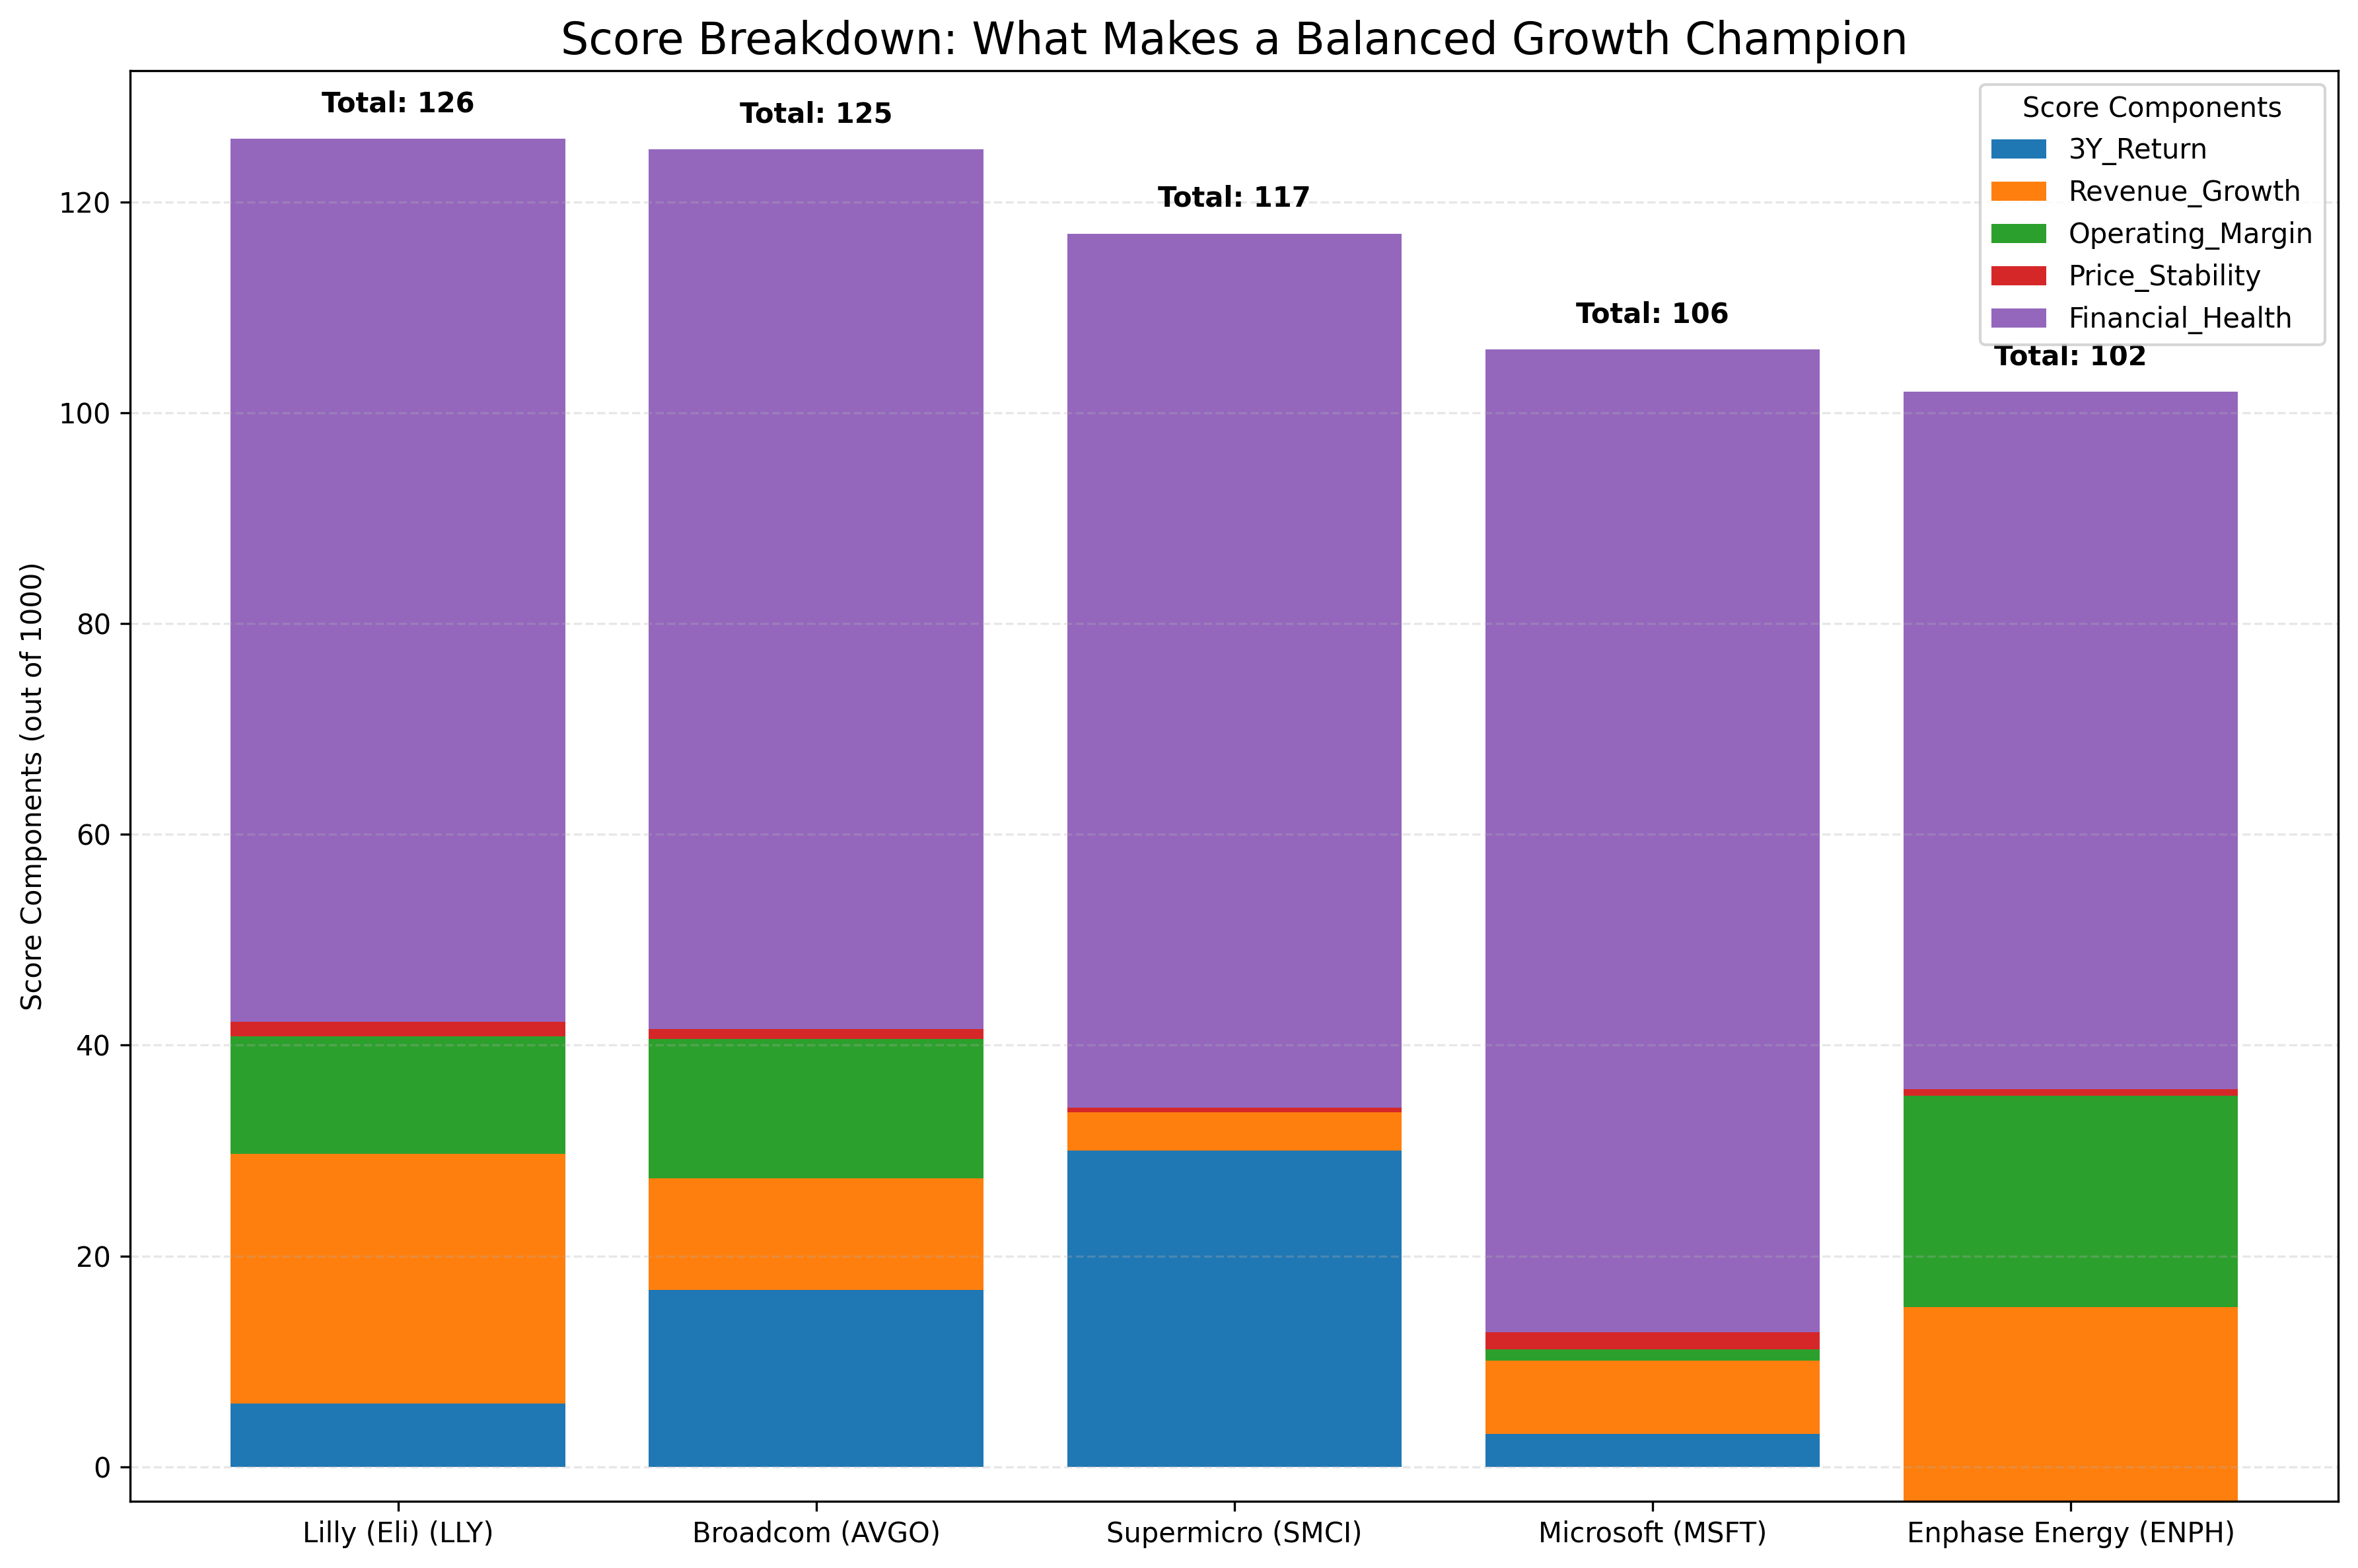
The Balanced Growth Champions ranking evaluates companies on their ability to deliver value across five key dimensions, not just stock price gains. Each company receives a score out of 1000 points based on their performance in these categories compared to other S&P 500 companies over the past three years (August 2022 to August 2025).
Understanding the Scoring Components
- **Stock Price Appreciation (30% of total score)**: Measures the 3-year total return percentage of the stock. This is calculated as ((Latest Close Price - Initial Close Price) / Initial Close Price) × 100.
- **Revenue Growth (25% of total score)**: Shows how much the company's top-line has expanded, calculated as the percentage increase in total revenue over three years.
- **Operating Margin Improvement (20% of total score)**: Reflects enhanced efficiency, measured in percentage points of change in operating margin (Operating Income divided by Total Revenue).
- **Price Stability (10% of total score)**: Rewards stocks with lower volatility, indicating more consistent returns. Measured using standard deviation of daily returns, with lower numbers receiving higher scores.
- **Financial Health (15% of total score)**: Combines metrics such as asset growth and improvements in debt-to-equity ratio to assess balance sheet strength.
Key Insights: What Sets the Top Companies Apart
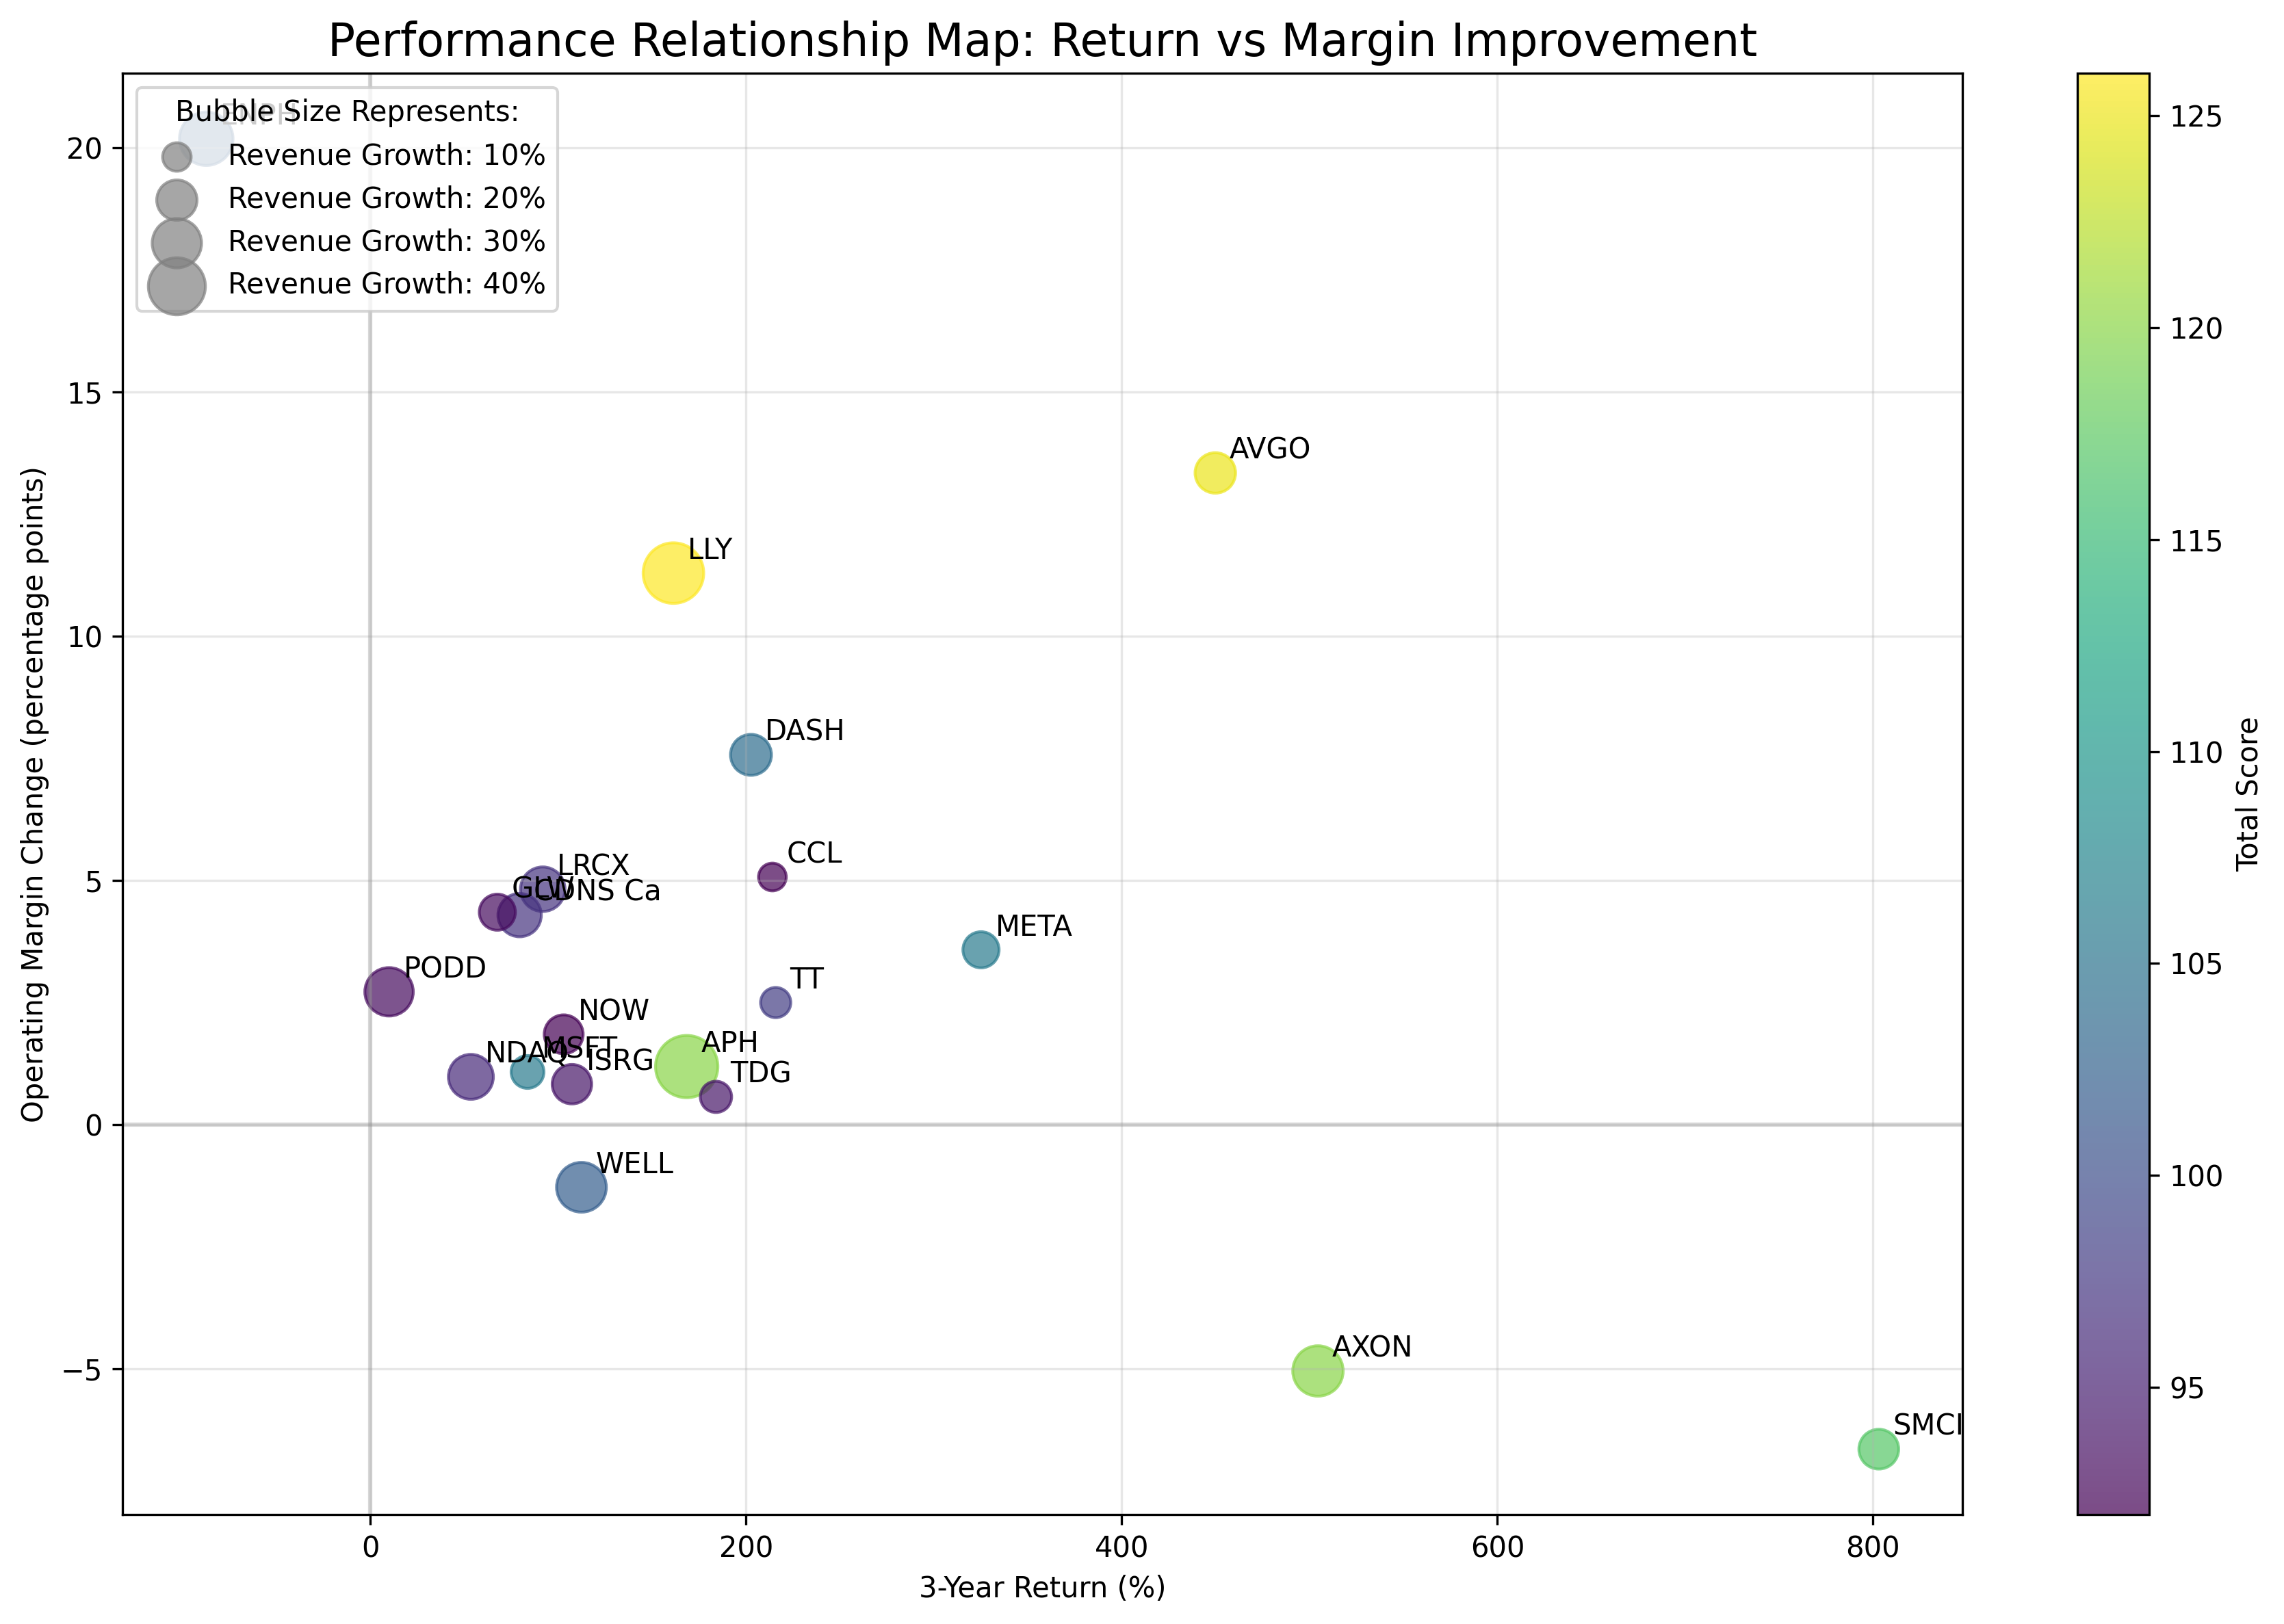
The data reveals fascinating stories behind company performance that typical stock rankings might miss. Some companies achieved balanced success through different paths, with strengths in various aspects of business performance.
Eli Lilly (LLY) tops our list with an impressive combination of strong stock returns (161%), significant revenue growth (45%), and substantial operating margin improvement (11.29 percentage points), all while maintaining relatively low volatility. This performance reflects Lilly's success in its diabetes and weight loss drug portfolio that has transformed the company's growth trajectory.
Broadcom (AVGO) takes second place with a remarkable 450% 3-year return coupled with a 13.34 percentage point improvement in operating margin. The company has successfully executed its strategy of expanding into software while maintaining its core semiconductor business.
Surprising Performers
Not all top-ranked companies followed the same pattern. Enphase Energy (ENPH) made the top 10 despite having a negative 3-year return (-87%). How? It achieved the highest operating margin improvement of any company (20.18 percentage points) while growing revenue by 35% during a challenging period for renewable energy stocks. This highlights how operational improvements can position a company for future success even when current stock performance lags.
Microsoft (MSFT) showcases another pathway to success, ranking high despite more modest stock returns (84%) compared to others in the top 10. Its strength comes from exceptionally low volatility (25.89%), steady revenue growth (13%), and consistent profitability improvement. This demonstrates how stability combined with steady growth can be just as valuable as dramatic price increases.
Why This Approach Matters for Investors
Traditional rankings that focus solely on stock price increases can miss companies that are building sustainable business foundations for long-term success. By examining multiple aspects of performance, this balanced approach highlights companies that are not just experiencing temporary stock surges but are improving fundamental business metrics that typically drive lasting value.
The data shows that exceptional performance can come from different combinations of strengths. Some companies excel through dramatic stock price increases despite moderate operational improvements, while others build value through significant business improvements that may lead to future stock price appreciation.
Understanding these patterns helps put market movements in proper context. When you see a stock making headlines for price gains, checking its performance across other dimensions can provide valuable perspective on whether that price increase is supported by fundamental business improvements.
Comments (0)
No comments yet. Be the first to comment!