Understanding the Financial Resilience Score
In today's unpredictable economy, some companies don't just survive—they thrive. Our Financial Resilience Score identifies these exceptional performers using a comprehensive 1000-point system that evaluates five key areas of financial health. Think of it as a financial report card where companies earn points for strong performance across different aspects of their business.
What Each Score Component Means (In Plain English)
- Revenue Growth (0-250 points): How much more money the company is making compared to last year. This measures if a business is expanding its customer base or selling more products/services. Companies with 30%+ growth earn the full 250 points.
- Operating Margin (0-200 points): What percentage of revenue becomes profit before accounting for interest and taxes. This shows how efficiently a company runs its core business—like a restaurant that keeps food costs low while charging good prices. Companies with 30%+ margins earn the full 200 points.
- Operating Income Growth (0-200 points): How much the company's profits have grown compared to last year. This combines revenue growth with cost management to show if a business is becoming more profitable over time. Companies with 40%+ growth earn the full 200 points.
- Debt Management (0-200 points): How much debt a company carries relative to its assets, and whether that debt is increasing or decreasing. Companies with low debt levels (under 20% of assets) and decreasing debt earn the most points.
- Working Capital (0-150 points): How easily a company can pay its short-term bills. This is calculated by dividing short-term assets (like cash and inventory) by short-term debts. The ideal ratio is around 1.5-2.0, earning the full 150 points.
How Scores Are Calculated
Each component uses a straightforward formula that converts financial metrics into points. For example, a company with 25% revenue growth would earn 225 points for that category ((25 + 20) / 50) × 250 = 225. The system rewards exceptional performance while penalizing poor results, creating a balanced view of financial health. All metrics use data comparing Q1 2025 with Q1 2024, providing a current snapshot of financial performance.
The Leaders: Who's Topping the Charts and Why
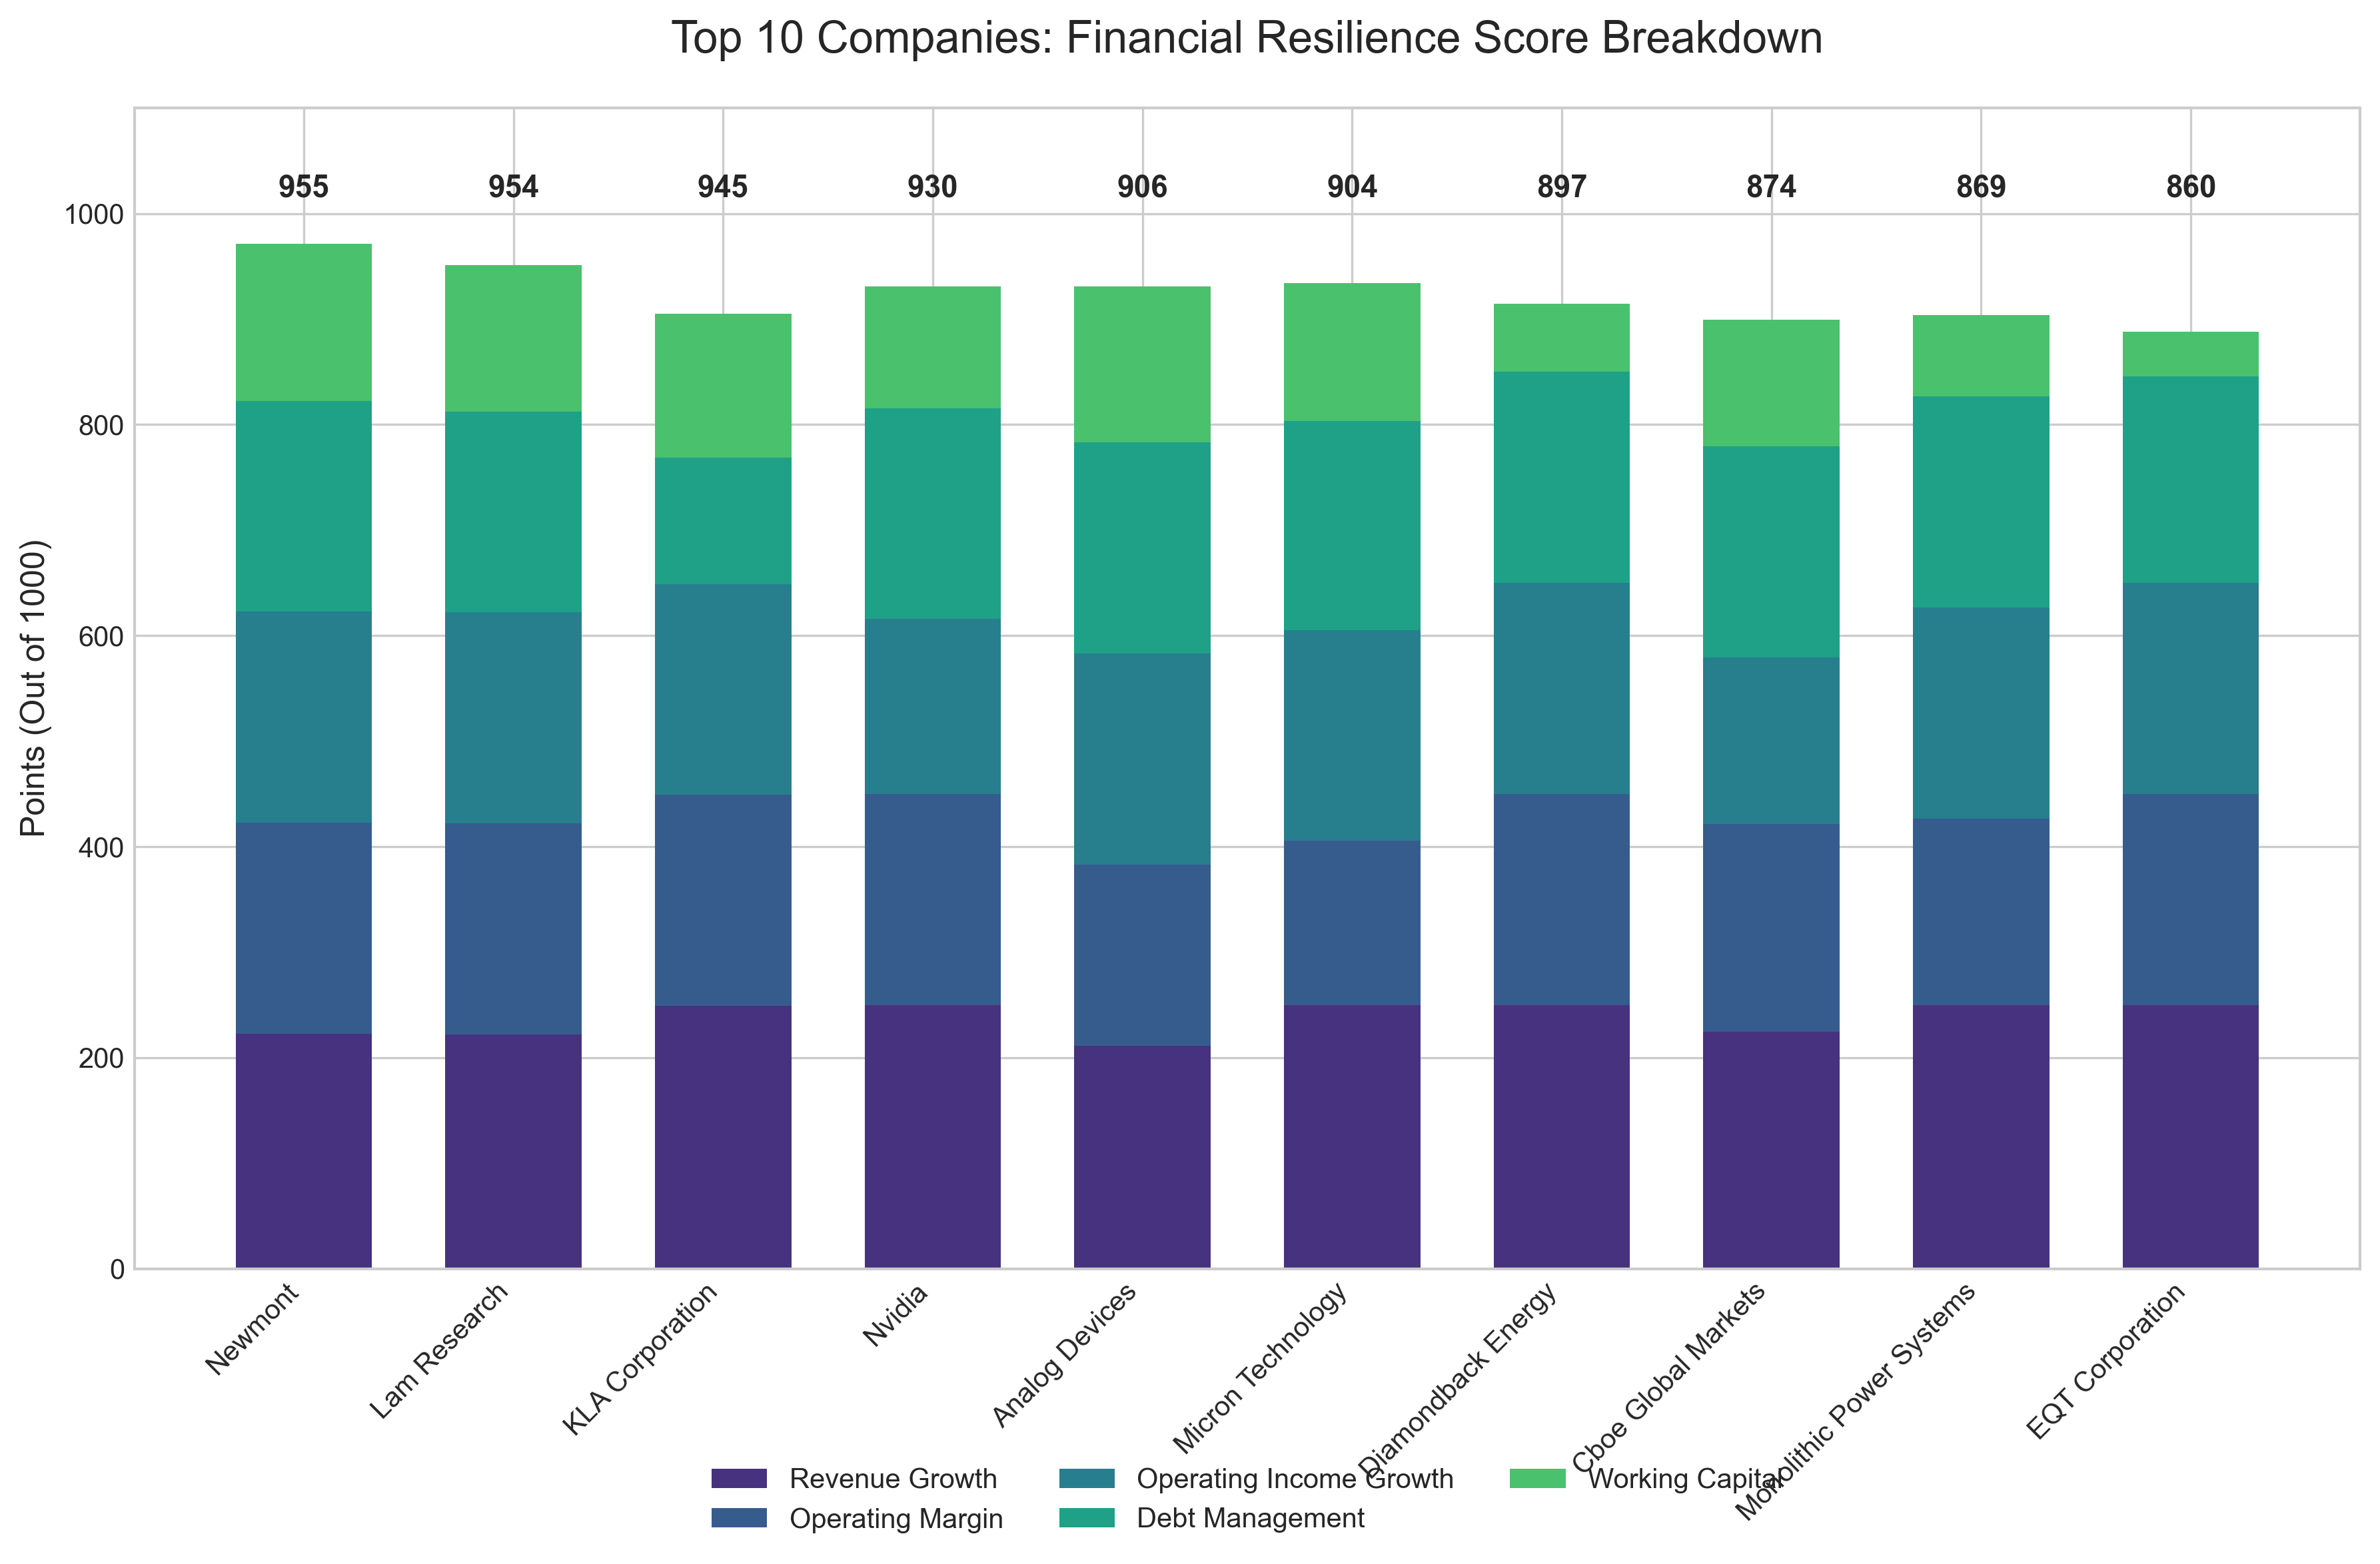
The top performers in our ranking show remarkable financial strength across multiple dimensions. Newmont (NEM), a mining company, secured the #1 spot with an impressive 955 points out of 1000. What makes Newmont stand out is its balanced excellence across all categories—strong 24.53% revenue growth combined with exceptional 40.24% operating margins and 110.44% operating income growth. This combination of expanding sales while maintaining high profitability demonstrates superior management and market positioning.
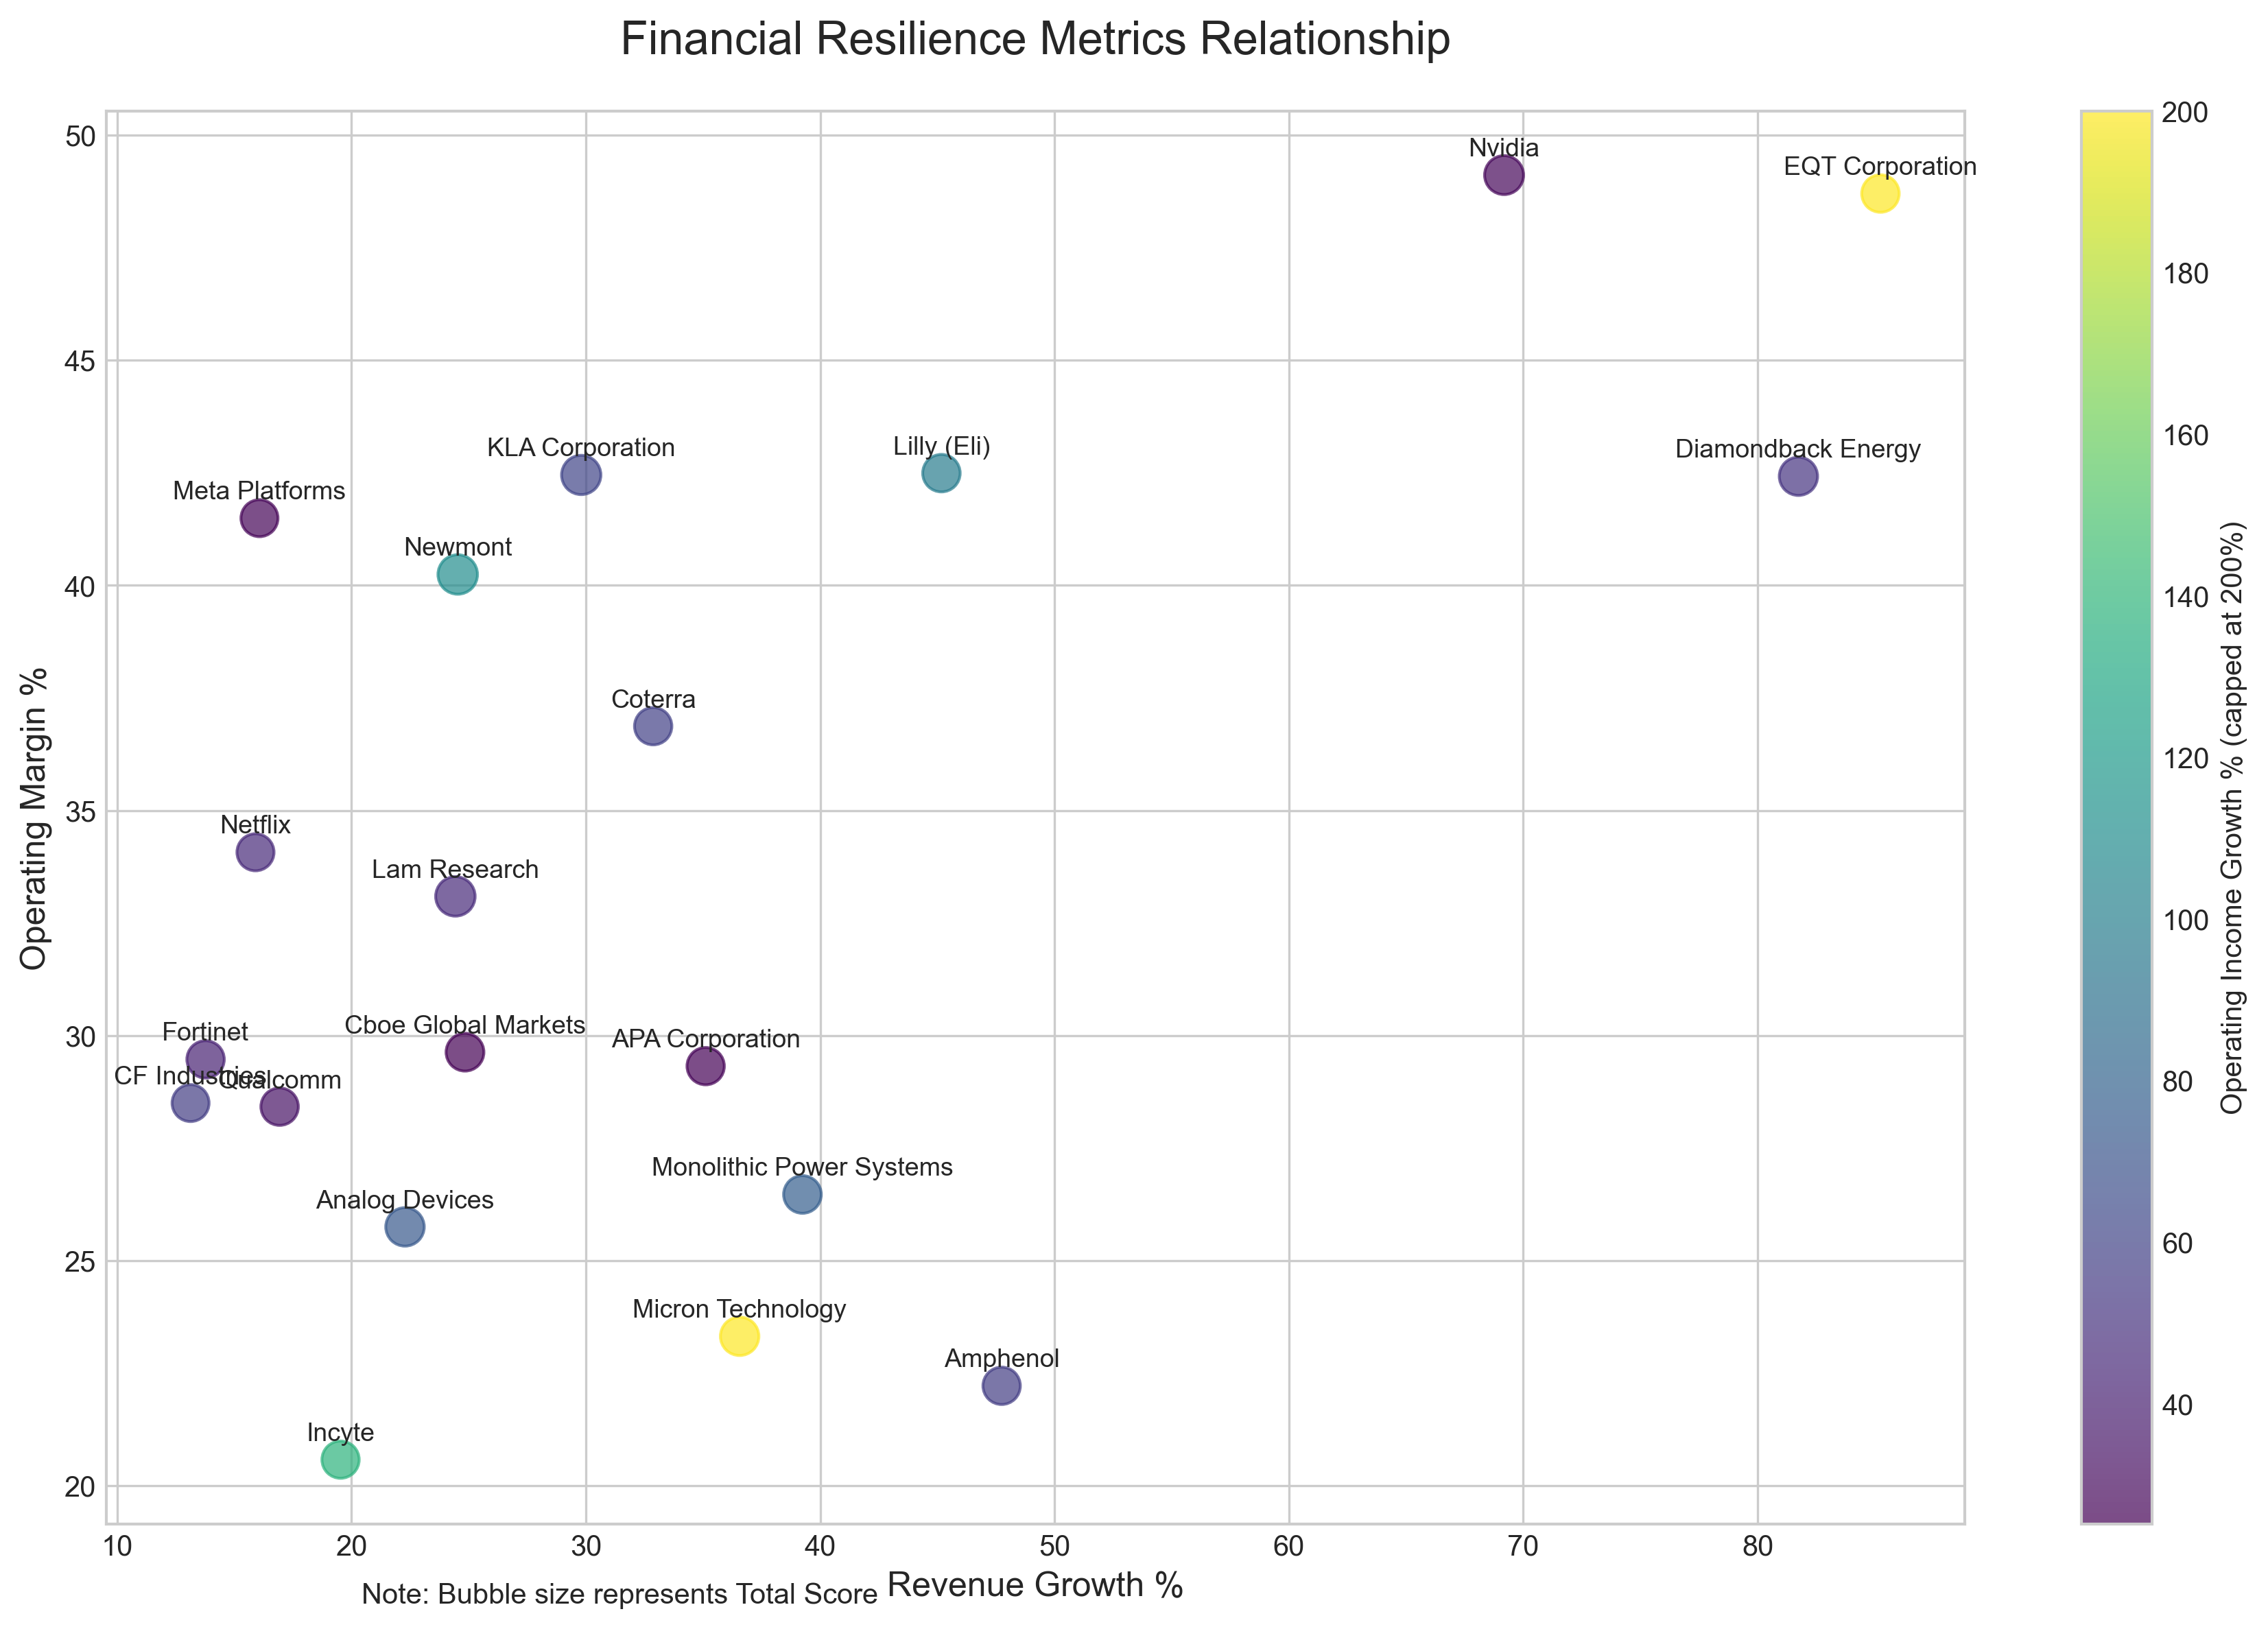
Tech companies dominate the list, with semiconductor firms like Lam Research (LRCX), KLA Corporation (KLAC), and Nvidia (NVDA) claiming spots in the top 5. Nvidia in particular shows extraordinary revenue growth at 69.18% with industry-leading 49.11% operating margins—a rare combination that signals both rapid expansion and excellent operational efficiency. Meanwhile, Micron Technology (MU) demonstrates the most dramatic profit improvement with 201.67% operating income growth.
Sector Insights: Tech Leads, Energy Recovers
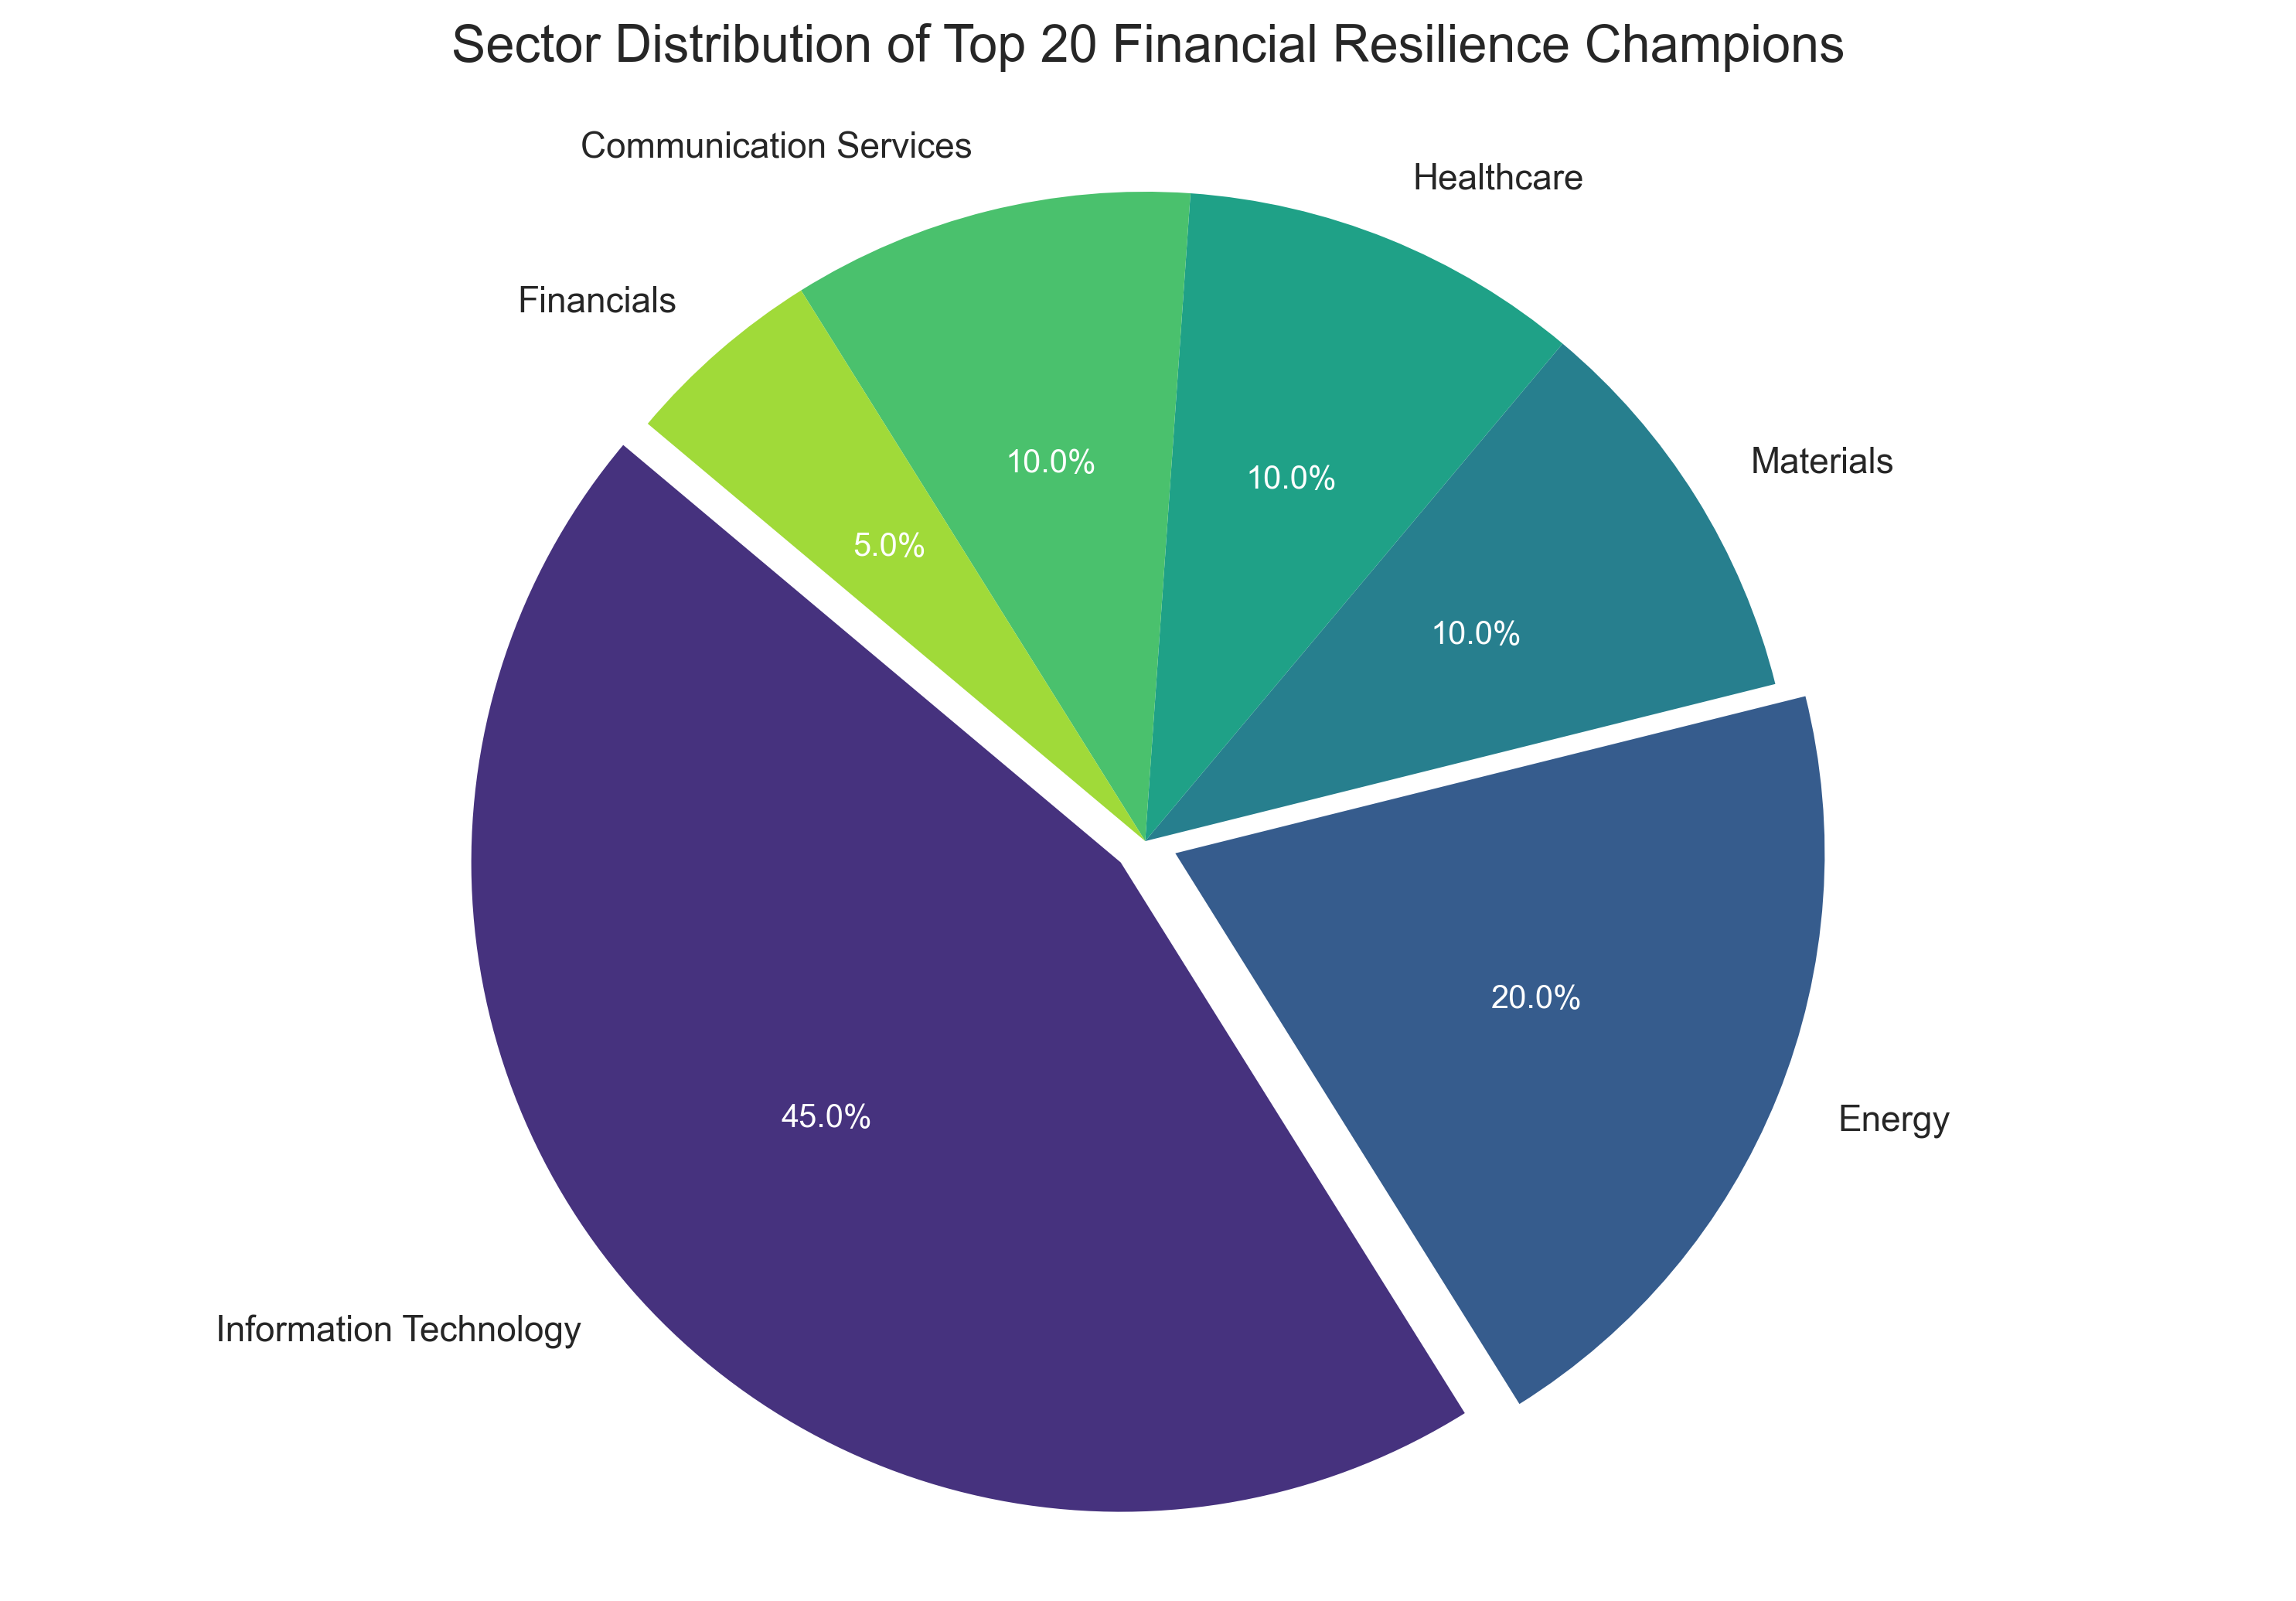
Looking at the big picture, Information Technology companies claim nearly half (45%) of the top 20 positions. This dominance reflects the tech sector's ability to combine high growth with strong profitability—especially among semiconductor companies benefiting from increased demand for advanced chips used in AI applications. These companies typically feature high operating margins and exceptional revenue growth.
Energy companies have made a remarkable comeback, representing 20% of the top performers. Firms like Diamondback Energy (FANG) and EQT Corporation (EQT) demonstrate some of the highest revenue growth rates in our analysis at 81.74% and 85.24% respectively. This performance signals a strong recovery in the energy sector, with companies maintaining impressive operating margins above 40% even during periods of price volatility.
Standout Financial Strategies
Beyond the rankings, we can identify distinctive financial strategies that set these companies apart. Some companies focus on maintaining extremely low debt levels—Monolithic Power Systems (MPWR) operates with virtually no debt at just 0.38% debt-to-assets ratio, while Incyte (INCY) maintains only 0.75%. This conservative approach provides flexibility and reduces financial risk.
Other companies excel at working capital management. Most top performers maintain working capital ratios between 1.5-3.0, balancing short-term liquidity with efficient capital use. Interestingly, energy companies typically operate with lower ratios (0.57-0.90) reflecting industry-specific practices, while Monolithic Power Systems demonstrates exceptional liquidity with a ratio of 4.92.
What This Means for Understanding Company Performance
These rankings offer valuable insights into what financial resilience really means in today's economy. The most successful companies demonstrate strength across multiple dimensions—they grow revenue while maintaining or expanding profit margins, manage debt conservatively, and maintain appropriate working capital levels for their industry. Rather than focusing on any single metric, this comprehensive approach provides a more complete picture of financial health.
For those interested in understanding company performance, these metrics offer a framework for evaluating financial statements. By examining how revenue translates to operating income, how debt levels compare to assets, and how effectively a company manages its short-term finances, you can gain deeper insights into organizational strength and stability. The historical comparison (Q1 2025 vs. Q1 2024) also helps identify meaningful trends rather than just static snapshots.
Understanding the Data Behind the Analysis
This analysis draws on quarterly financial statements from Q1 2025 compared with Q1 2024, focusing on year-over-year changes to identify meaningful trends. The metrics include 'Total Revenue' and 'Operating Income' from income statements, plus 'Total Debt', 'Total Assets', 'Current Assets', and 'Current Liabilities' from balance sheets. All calculations follow standard financial practices, with the scoring system designed to provide a comprehensive yet intuitive measure of financial resilience.
By examining these diverse metrics together rather than in isolation, we gain a more complete picture of which companies truly excel at navigating economic challenges while maintaining strong financial foundations. This analysis highlights not just who's performing well, but also the different strategies companies employ to achieve financial resilience in their respective industries.
Comments (0)
No comments yet. Be the first to comment!