Introduction
When interest rates rise, bond prices fall. This fundamental relationship is taught in every finance class, but how does it actually play out in the real world of bond ETFs? As an investor navigating today's volatile interest rate environment, understanding this relationship isn't just academic—it's essential for protecting your portfolio.
In this data-driven exploration, we'll examine how bond ETF prices and yields respond to interest rate changes using historical data from 2008 to 2024. Rather than making predictions, we'll focus on understanding the mechanics through rigorous analysis of two popular Treasury bond ETFs: TLT (iShares 20+ Year Treasury Bond ETF) and IEF (iShares 7-10 Year Treasury Bond ETF).
Our analysis leverages ETF price data alongside interest rate data from the Federal Reserve Economic Data (FRED), specifically the 10-Year Treasury Constant Maturity Rate (DGS10) and the Effective Federal Funds Rate (FEDFUNDS). Through visualizations and statistical analysis, we'll uncover patterns that can help investors make more informed decisions about bond ETF investments.
Conceptual Background
What is a Bond ETF?
A bond ETF (Exchange-Traded Fund) is an investment vehicle that holds a portfolio of bonds while trading on exchanges like stocks. Unlike individual bonds, which typically require holding until maturity, bond ETFs offer liquidity, diversification, and accessibility to retail investors. Popular Treasury bond ETFs include TLT, which holds U.S. Treasury bonds with maturities of 20+ years, and IEF, which holds those with 7-10 year maturities.
The Interest Rate-Price-Yield Relationship
Three key concepts govern bond ETF behavior:
- When interest rates rise, bond prices fall (and vice versa)
- Longer-duration bonds are more sensitive to interest rate changes
- Bond yield = Coupon payments / Price (simplified)
This inverse relationship occurs because existing bonds with lower coupon rates become less attractive when new bonds offer higher rates. To compensate, the market price of existing bonds must fall until their yield (coupon/price) becomes competitive with newly issued bonds.
Duration measures a bond's price sensitivity to interest rate changes. Longer-duration bonds (like those in TLT) experience larger price movements for a given interest rate change compared to shorter-duration bonds (like those in IEF).
Dataset and Methodology
Our analysis uses the following data sources:
- TLT and IEF price data (2008-2024)
- 10-Year Treasury Constant Maturity Rate (DGS10) from FRED
- Effective Federal Funds Rate (FEDFUNDS) from FRED
We processed this data by resampling to monthly frequency for consistent comparison, calculating key metrics including returns, correlations, and price sensitivities, and analyzing patterns across different market regimes. The dataset spans multiple interest rate cycles, including the 2008 financial crisis, the zero-interest-rate policy era, the 2016-2019 rate hike cycle, the COVID-19 pandemic, and the 2022-2023 rate hike cycle.
Historical Analysis
TLT Price vs. 10-Year Treasury Rate (2008-2024)
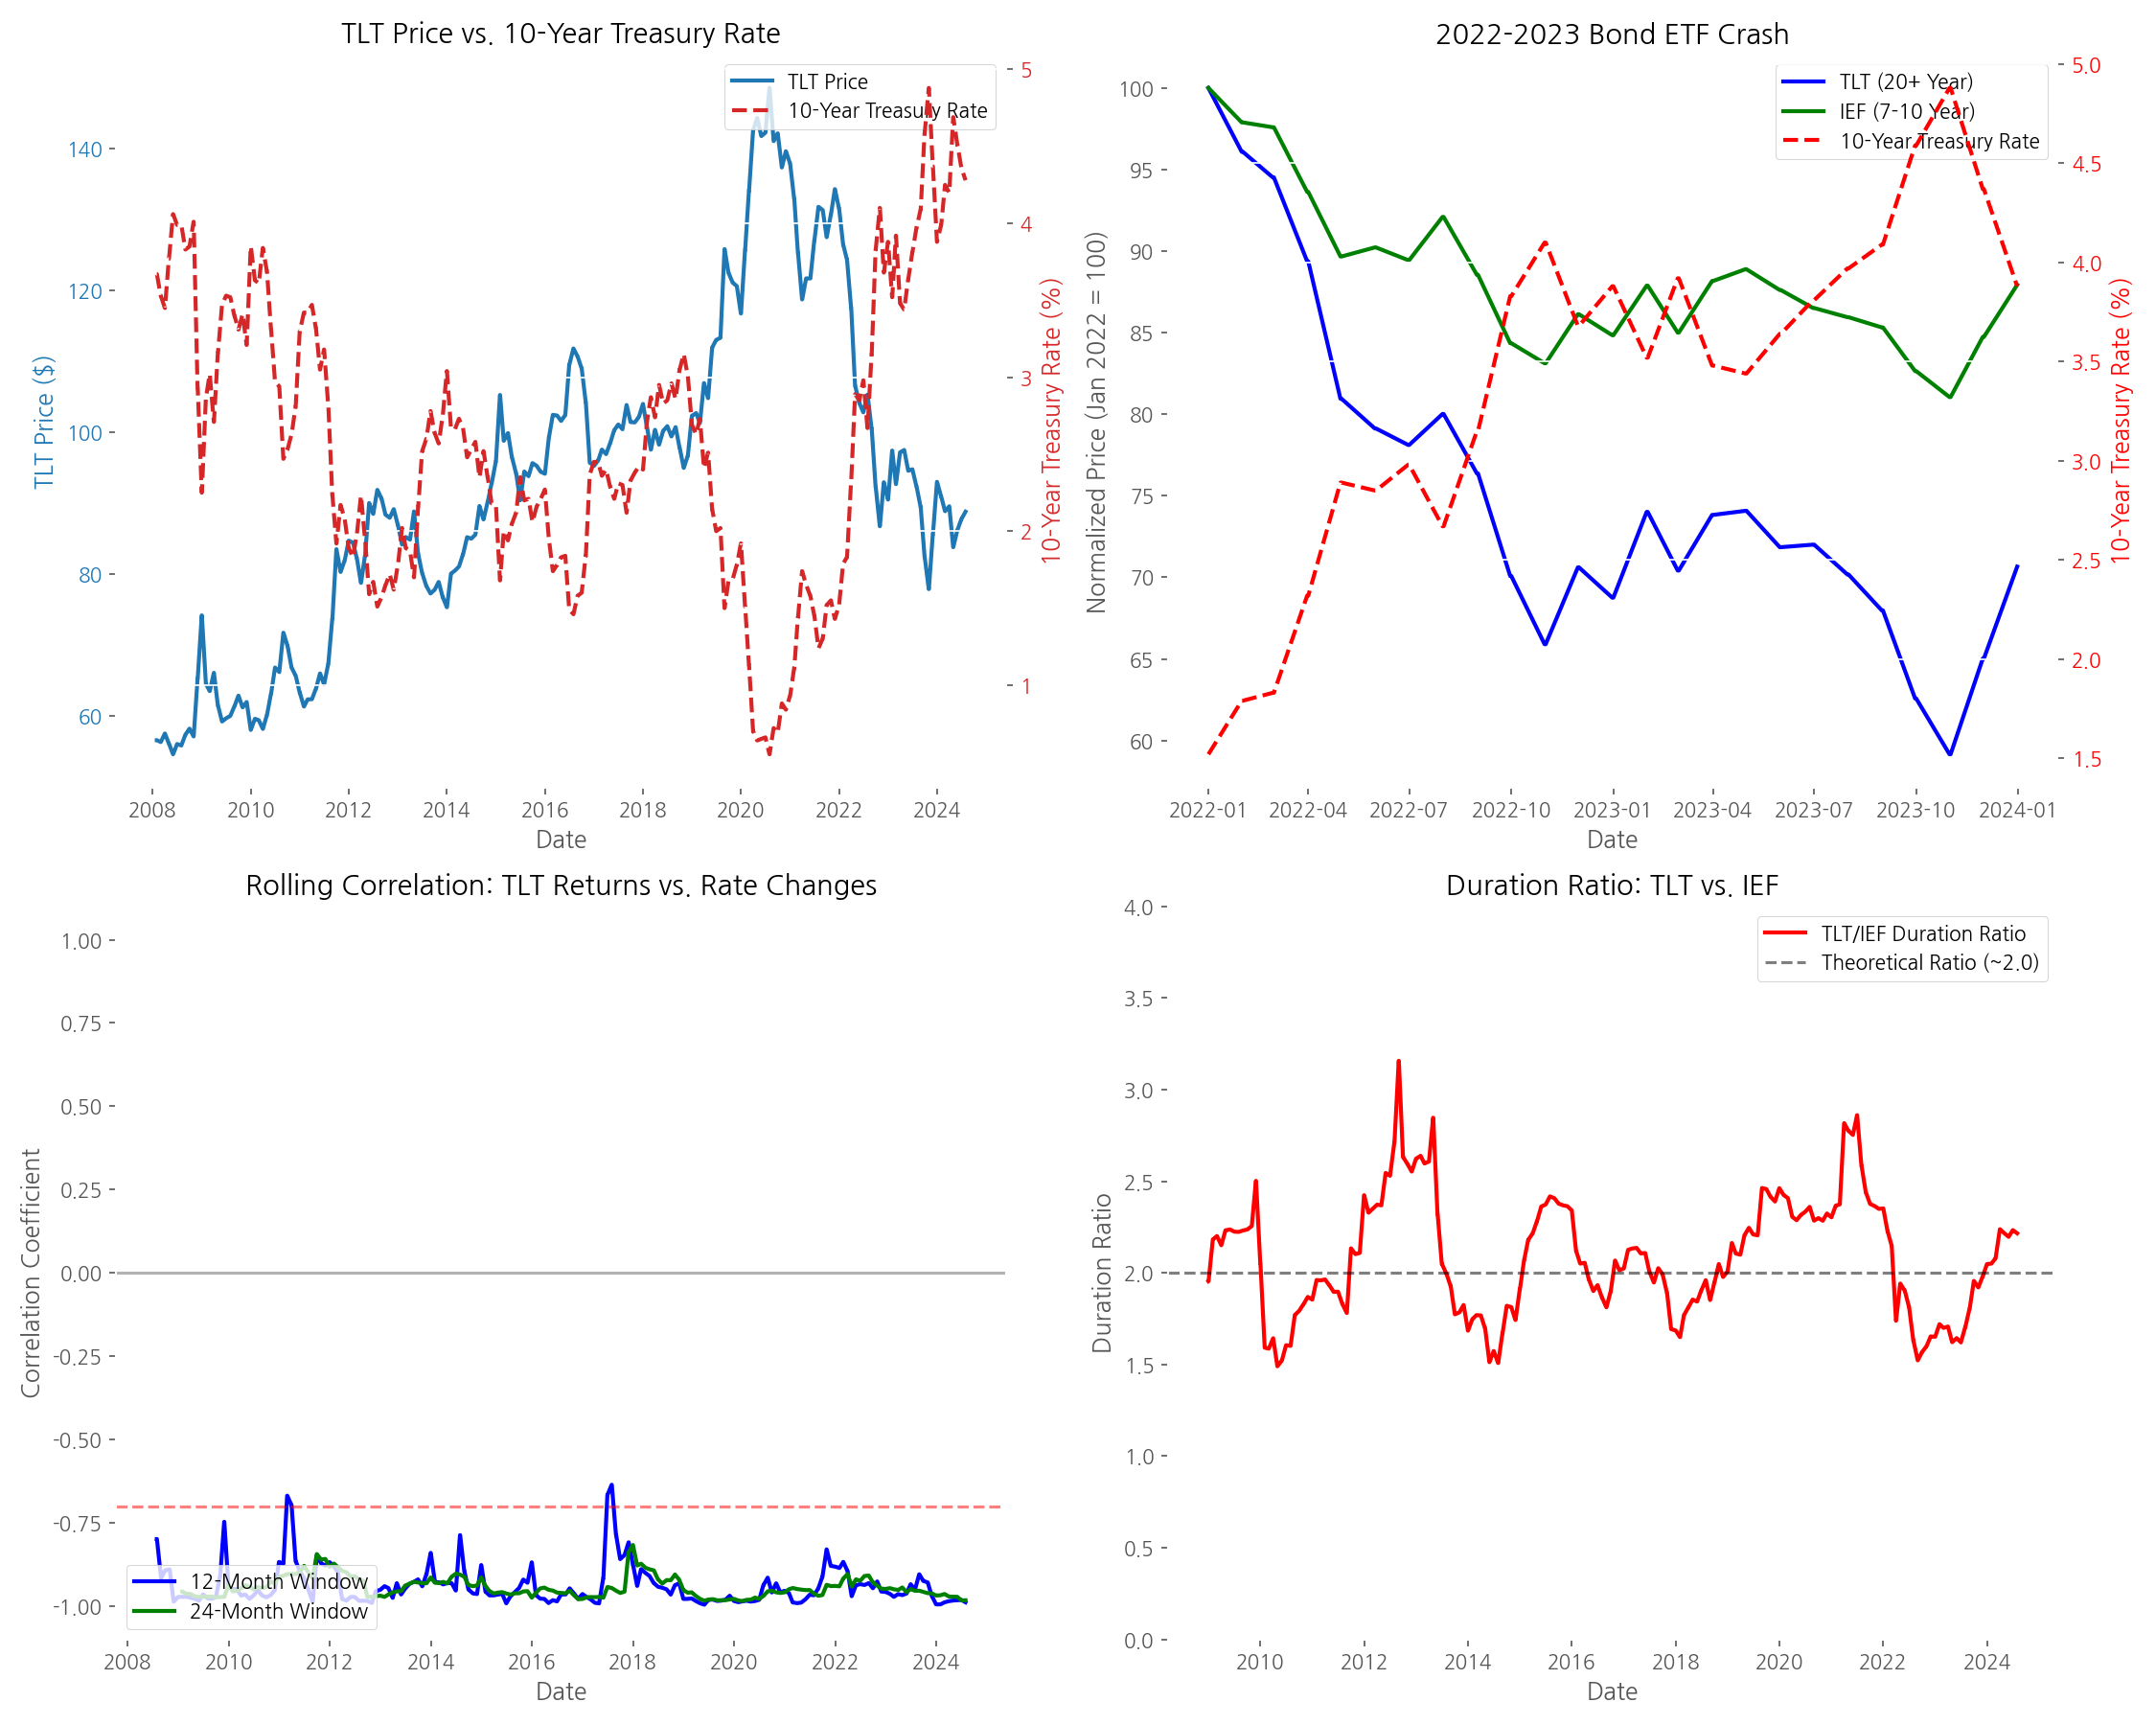
Our first visualization examines the long-term relationship between TLT (20+ year Treasury bonds) and the 10-Year Treasury rate from 2008 to 2024.
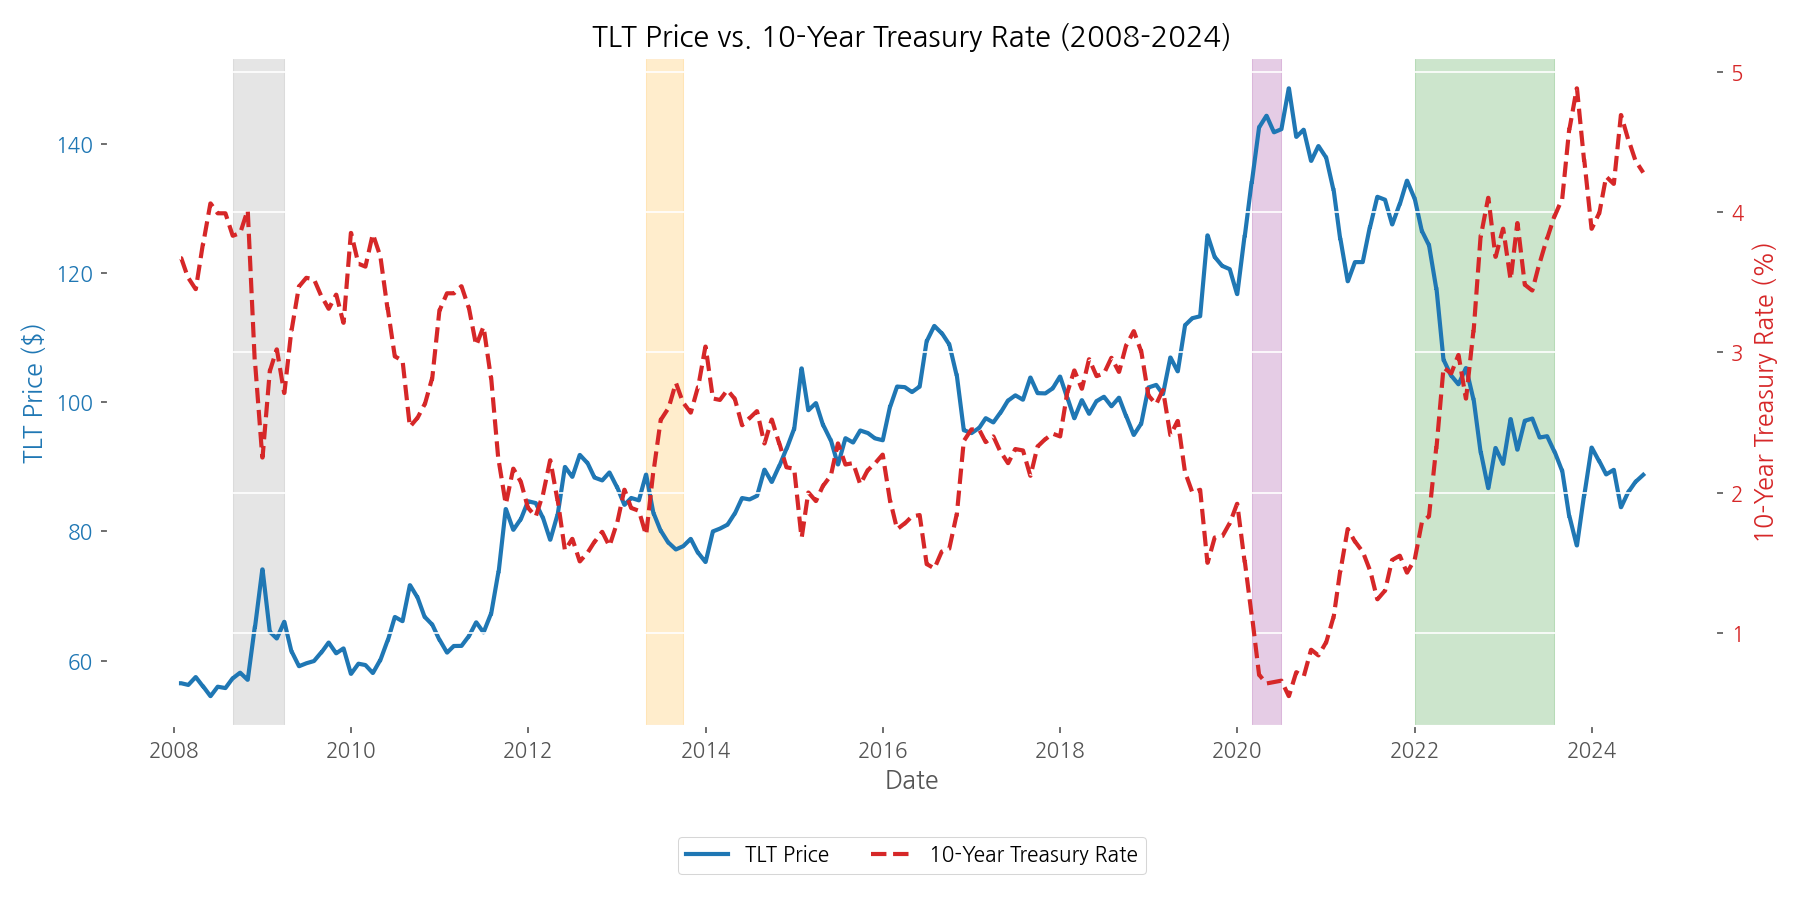
The visualization reveals several key patterns:
- During the 2008 financial crisis, as rates fell from ~4% to ~2%, TLT rose from ~$90 to ~$120
- During the 2013 'Taper Tantrum' when the Fed announced plans to reduce bond purchases, TLT fell sharply as rates spiked
- In the 2020 COVID-19 crisis, as rates plummeted to historic lows (~0.5%), TLT reached all-time highs (~$170)
- During the 2022-2023 rate hike cycle, TLT experienced one of its worst drawdowns as rates rose rapidly
The data shows a strong negative correlation of -0.94 between TLT prices and 10-Year Treasury rates over the entire period, confirming the fundamental inverse relationship between bond prices and interest rates.
IEF Price vs. Fed Funds Rate During 2016-2019 Rate Hike Cycle
Our second visualization focuses on how intermediate-term Treasury bonds (IEF) responded during the 2016-2019 rate hike cycle, when the Federal Reserve gradually raised rates nine times.
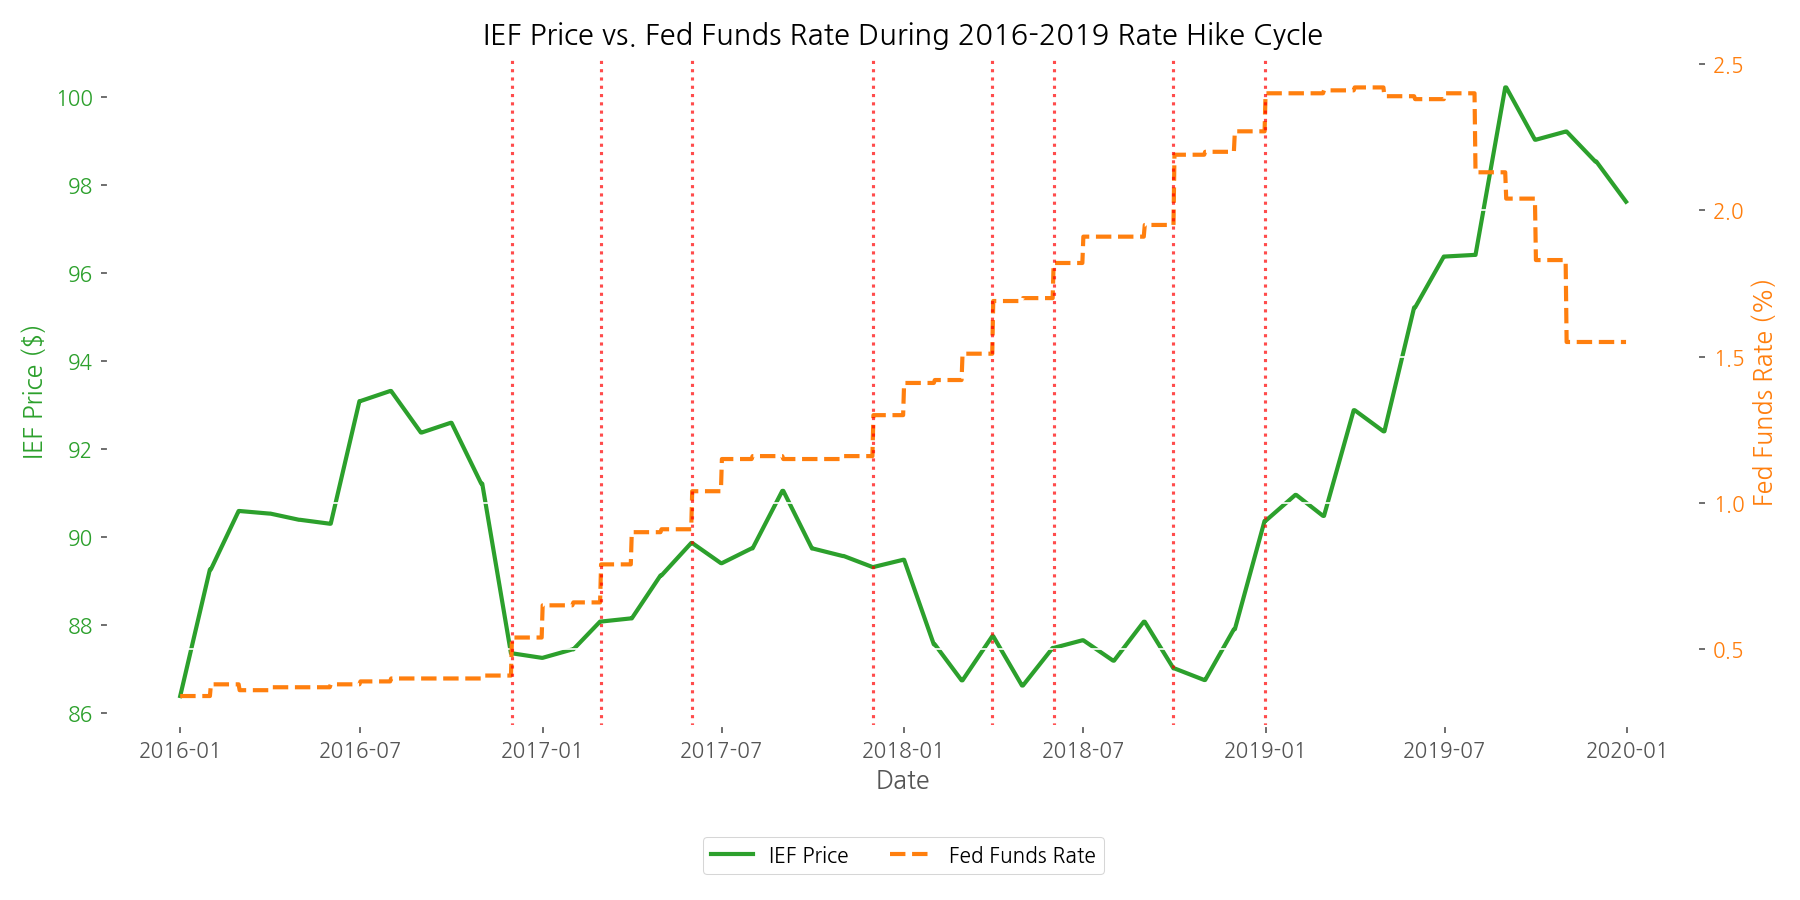
This period provides valuable insights:
- The Fed raised rates from near-zero to 2.25-2.50%, a total increase of 1.21 percentage points
- IEF price declined from $86.39 to $97.63, a total price change of 13.01%
- The price decline was gradual and orderly, reflecting the Fed's telegraphed approach to rate hikes
- IEF's price often anticipated rate changes, demonstrating the forward-looking nature of bond markets
This visualization highlights how bond ETFs can react not just to current interest rate changes but to expected future changes as well.
Rolling Correlation Between TLT and 10-Year Treasury Rate
While the overall correlation between bond ETF prices and interest rates is negative, the strength of this relationship can vary over time. Our third visualization examines the rolling correlation between TLT returns and changes in the 10-Year Treasury rate.
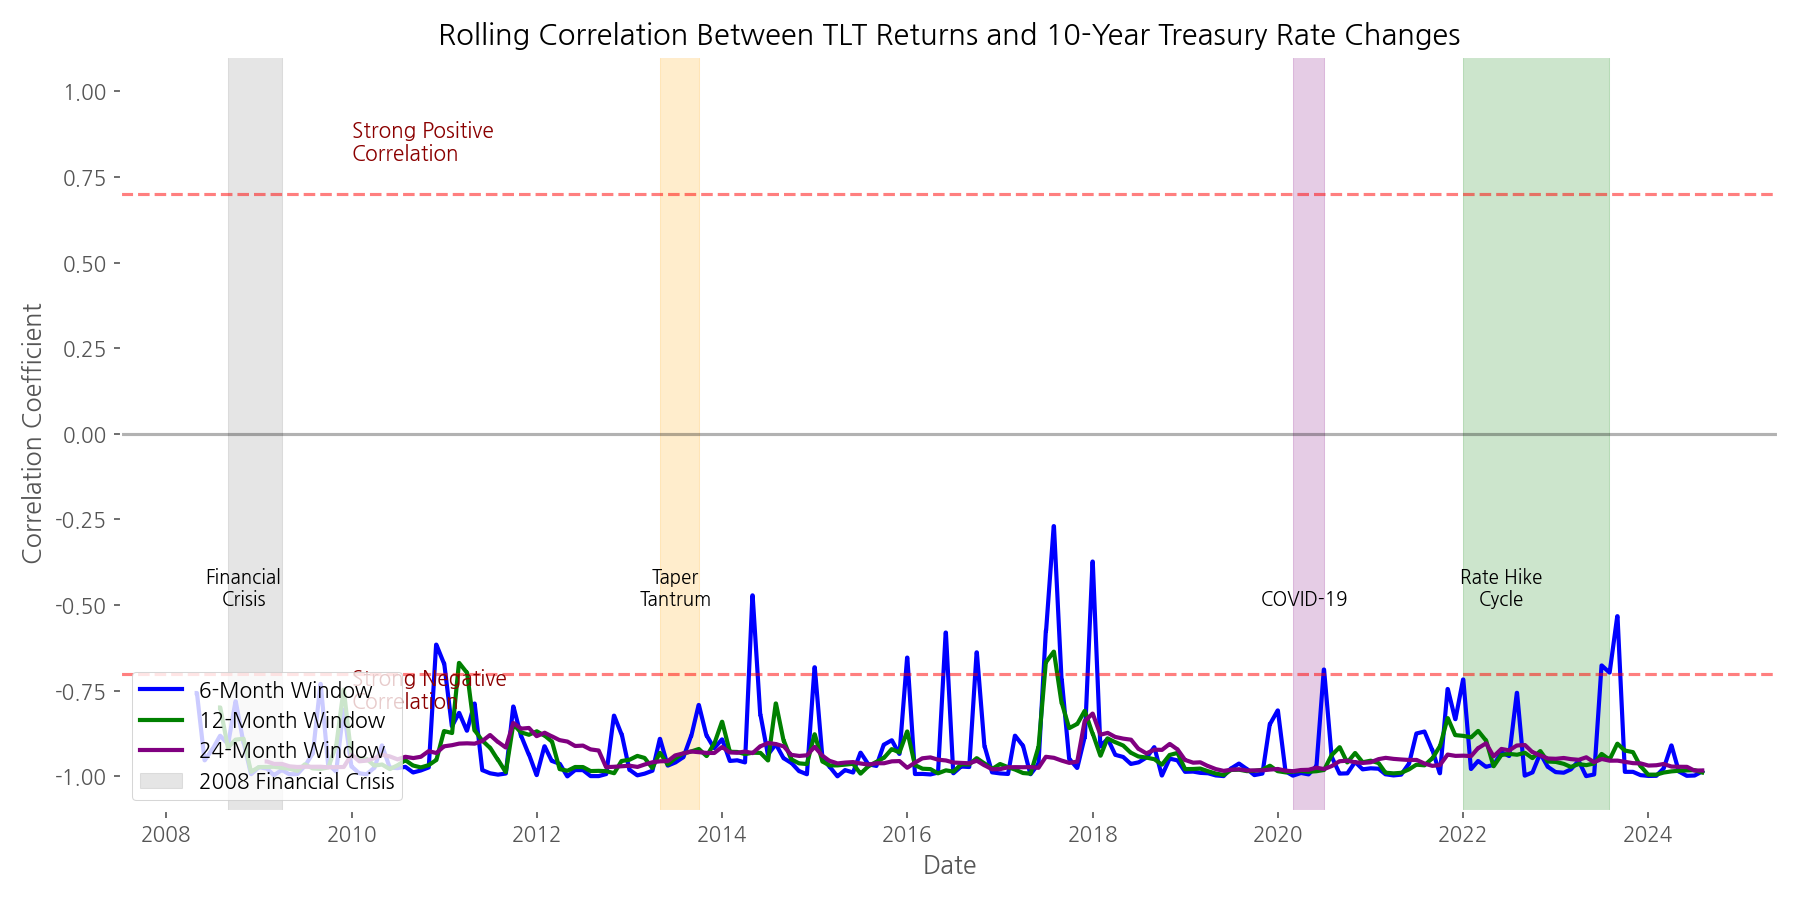
The visualization reveals important patterns in the bond-rate relationship:
- The correlation is predominantly negative, frequently exceeding -0.7
- Shorter windows (6-month) show more volatility in correlation, while longer windows (24-month) show more stability
- Correlation strengthens during crisis periods (Financial Crisis: -0.97, COVID Crisis: -0.96)
- Brief periods of positive correlation are rare and typically short-lived
This analysis demonstrates that while the inverse relationship between bond prices and interest rates is consistent, its strength can vary based on market conditions and time horizons.
2022-2023 Bond ETF Crash: TLT vs. IEF vs. 10-Year Treasury Rate
The 2022-2023 period saw one of the worst bond market crashes in recent history as the Federal Reserve aggressively raised rates to combat inflation. Our fourth visualization compares how long-term (TLT) and intermediate-term (IEF) Treasury ETFs performed during this challenging period.
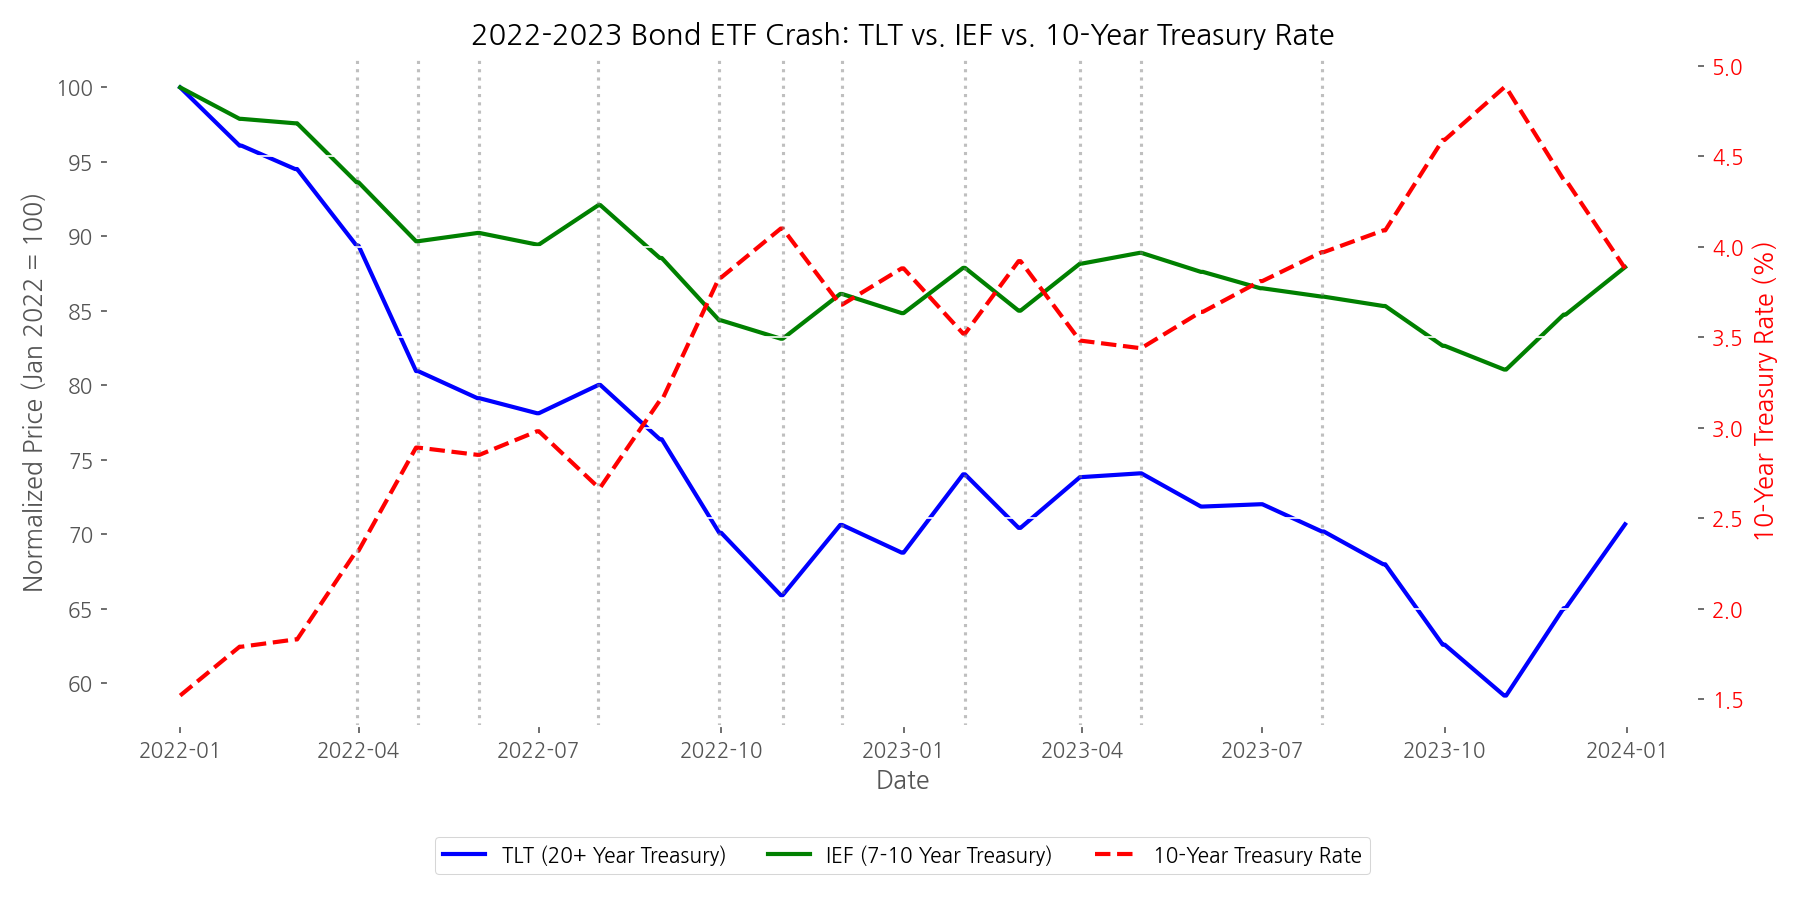
The data reveals the dramatic impact of duration during rapid rate increases:
- TLT (20+ year Treasury) experienced a maximum drawdown of -40.85%
- IEF (7-10 year Treasury) experienced a maximum drawdown of -18.95%
- The TLT/IEF drawdown ratio was 2.16x, closely matching their duration ratio
- 10-Year Treasury rates increased by 3.36 percentage points (from ~1.5% to ~4.5%)
This period provides a stark illustration of how duration affects bond ETF price sensitivity. Longer-duration bonds (TLT) fell more than twice as much as intermediate-duration bonds (IEF) for the same interest rate increase.
Duration Impact: Price Sensitivity Analysis
To further quantify the impact of duration, we analyzed the price sensitivity of TLT and IEF to interest rate changes over time.
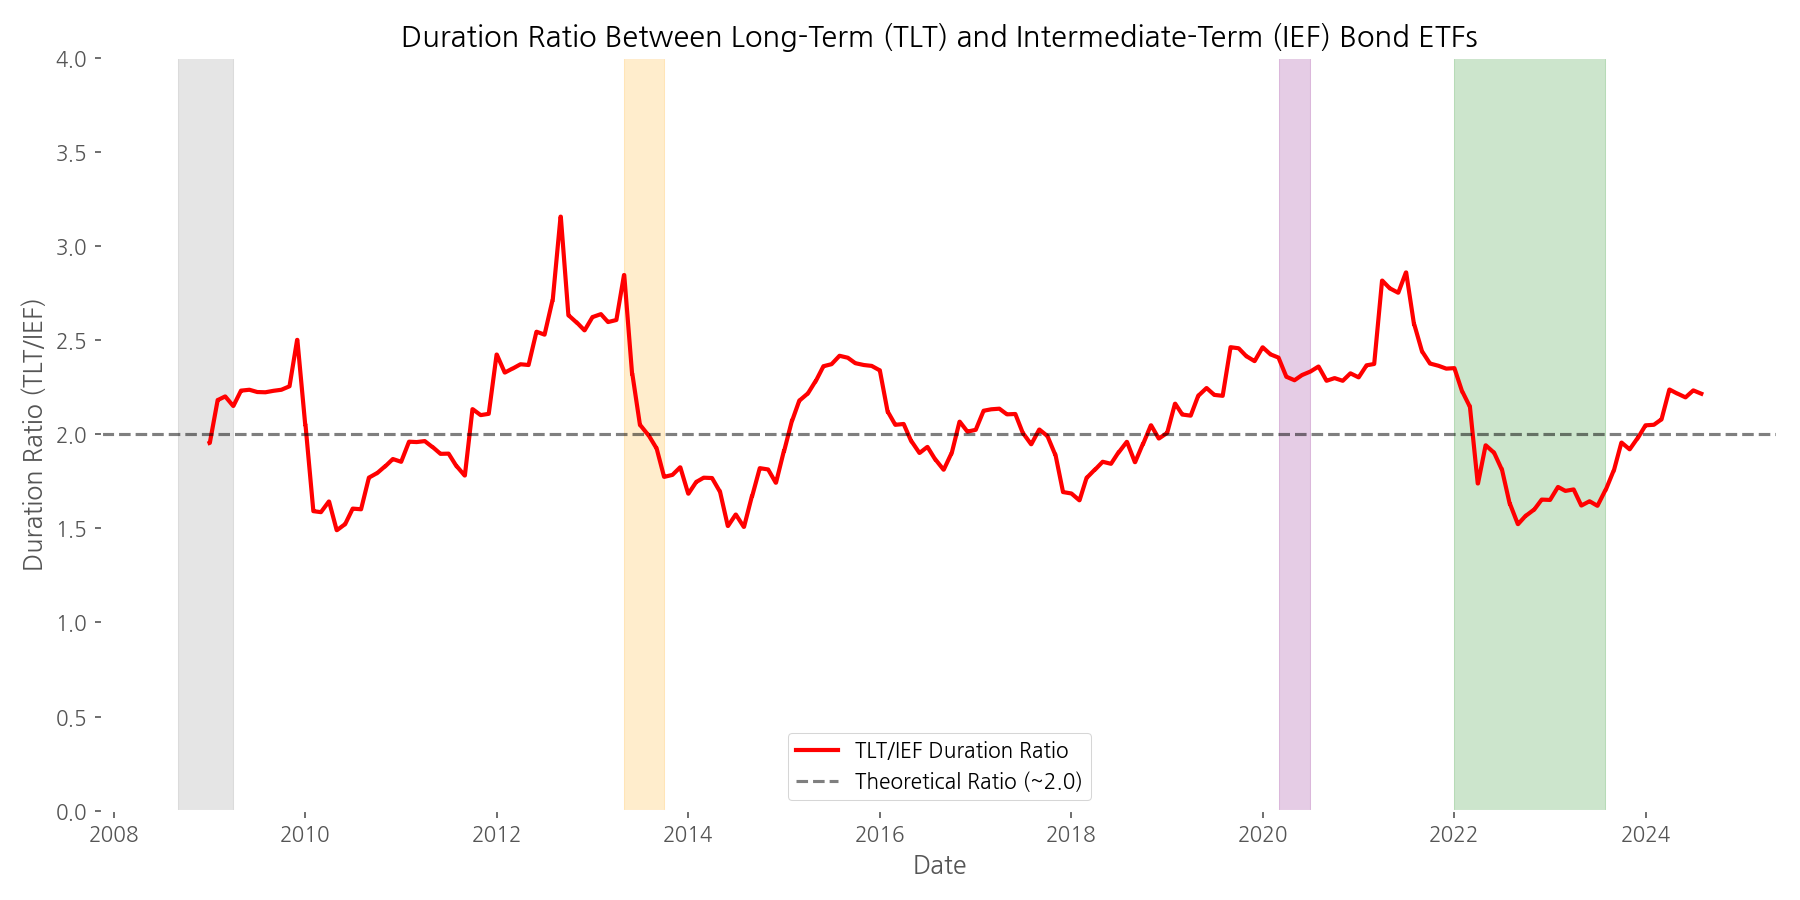
Our analysis found:
- Current TLT price sensitivity: -0.17% per 100bps rate change
- Current IEF price sensitivity: -0.08% per 100bps rate change
- Current TLT/IEF duration ratio: 2.22x
- Average TLT/IEF duration ratio over the study period: 2.08x (standard deviation: 0.32)
This consistent relationship allows investors to estimate how much a bond ETF might fall for a given interest rate increase based on its duration.
Key Takeaways
Our data-driven analysis reveals several important insights for bond ETF investors:
- The inverse relationship between bond ETF prices and interest rates is strong and persistent across different market regimes
- Bond ETFs with higher duration (e.g., TLT) consistently show approximately twice the price sensitivity of those with lower duration (e.g., IEF)
- The 2022-2023 bond market crash demonstrated the real-world impact of duration, with TLT falling 40.85% while IEF fell 18.95%
- Bond ETF prices often anticipate interest rate changes, reflecting the market's forward-looking nature
- Correlation between bond ETF returns and interest rate changes strengthens during crisis periods
Educational Use: Practical Applications for Investors
Based on our analysis, bond ETF investors should consider the following factors when making investment decisions:
Duration Management
Duration is the primary driver of bond ETF price sensitivity. Our data shows that TLT (with longer duration) consistently experiences about twice the price movement of IEF for the same interest rate change. Investors can manage interest rate risk by adjusting their allocation between long-duration and short-duration bond ETFs based on their interest rate outlook.
Interest Rate Regime Awareness
Different interest rate regimes call for different bond ETF strategies. In a rising rate environment (like 2022-2023), shorter-duration bond ETFs tend to outperform. In a falling rate environment (like 2008 or 2020), longer-duration bond ETFs typically outperform. Understanding the current regime and Fed policy direction is crucial for bond ETF investors.
Yield vs. Price Risk Trade-off
Bond ETFs offer a trade-off between yield and price risk. Our data shows that TLT currently offers a higher yield (approximately 5.14%) compared to IEF (approximately 3.85%), but comes with significantly higher price volatility. Investors must balance their need for income with their tolerance for price fluctuations.
By understanding these relationships and applying the insights from our data-driven analysis, investors can make more informed decisions about bond ETF investments in various interest rate environments.
Comments (0)
No comments yet. Be the first to comment!