Introduction
In the unpredictable world of investing, finding a strategy that can weather any economic storm has been the holy grail for investors. Enter Ray Dalio's All-Weather Portfolio—a diversified investment approach designed to perform reasonably well across different economic environments, from growth to recession, inflation to deflation. But does this strategy actually deliver on its promise?
Rather than relying on theory or short-term examples, I've conducted a comprehensive simulation spanning nearly two decades (2006-2025) to put the All-Weather Portfolio to the test. Using real market data across multiple economic cycles—including the 2008 Financial Crisis, the 2020 COVID crash, and the 2022 inflation shock—this analysis reveals whether this balanced approach truly offers the stability and protection it promises, and what trade-offs investors might face.
In this data-driven exploration, we'll examine the portfolio's composition, simulate its performance with quarterly rebalancing, analyze key metrics against a simple S&P 500 index strategy, and extract practical insights for investors considering this approach for their own portfolios.
Portfolio Composition and Strategy Logic
The All-Weather Portfolio isn't just another arbitrary asset allocation—it's built on the principle that different asset classes perform differently under varying economic conditions. By diversifying across these assets, the portfolio aims to maintain stability regardless of the economic environment.
Our simulation uses the classic All-Weather allocation:
- 30% US Stocks (SPY) — Growth assets that perform well during economic expansion
- 40% Long-Term US Treasury Bonds (TLT) — Defensive assets that typically shine during economic contraction
- 15% Intermediate-Term US Treasury Bonds (IEF) — Provide stability with moderate duration exposure
- 7.5% Gold (GLD) — Traditional inflation hedge and crisis insurance
- 7.5% Commodities (DBC) — Additional inflation protection with economic sensitivity
This allocation isn't random—it's designed to balance exposure to growth and inflation, the two primary economic drivers affecting asset prices. The strategy assumes that we can't predict which economic environment will dominate in the future, so it prepares for all possibilities.
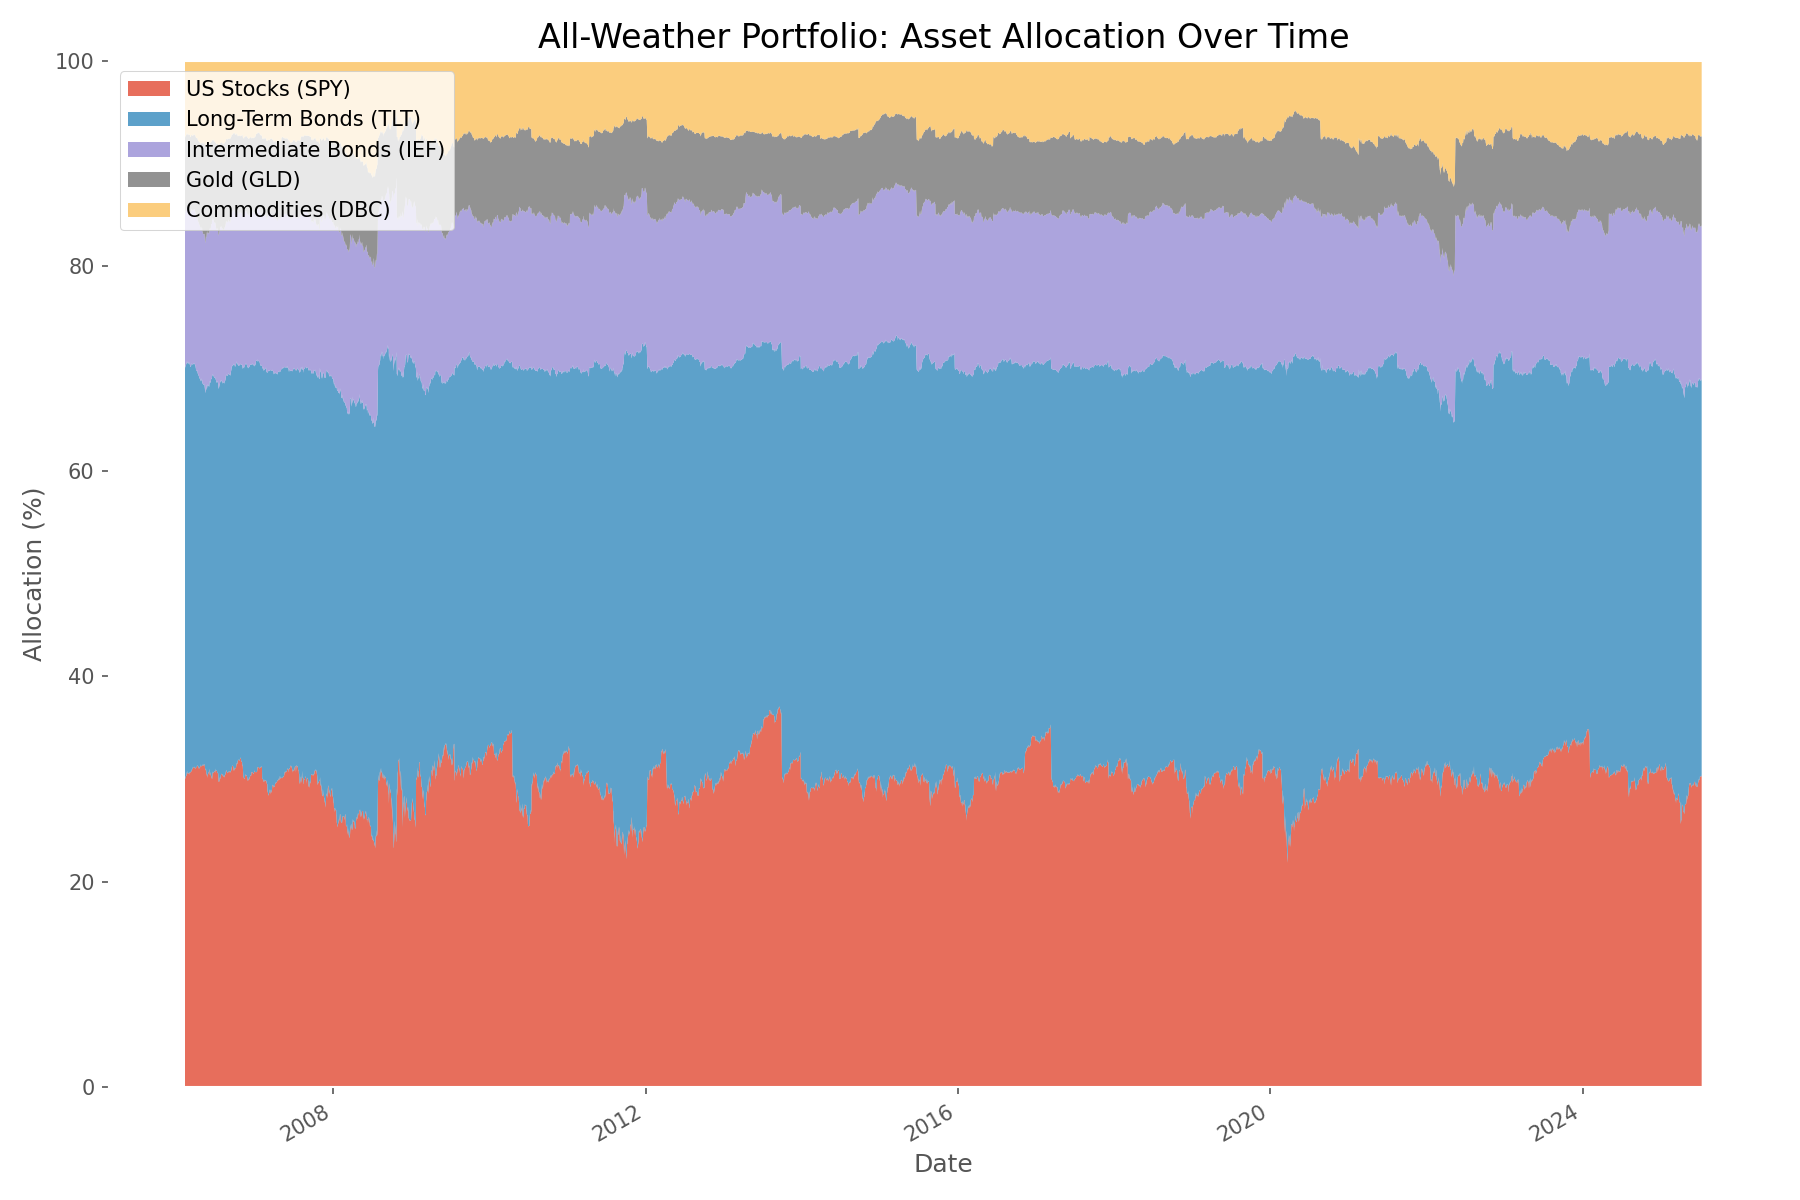
For our simulation, we implemented quarterly rebalancing to maintain these target allocations. This disciplined approach forces the portfolio to systematically sell assets that have appreciated and buy those that have declined—essentially implementing a "buy low, sell high" strategy without emotion or market timing.
Simulation Setup and Methodology
To ensure our analysis reflects real-world conditions, we used historical price data for all assets from February 2006 through July 2025, obtained through the Tiingo API. This period encompasses multiple market cycles, including several significant crises and recovery periods.
The simulation parameters included:
- Initial capital: $100,000
- Time period: February 6, 2006 to July 11, 2025
- Rebalancing frequency: Quarterly (54 rebalancing events)
- Benchmark: S&P 500 (SPY) buy-and-hold strategy
- No leverage or shorting
- ETFs used as asset proxies
Throughout the simulation, we tracked daily portfolio values, asset allocations, and key performance metrics including total return, compound annual growth rate (CAGR), volatility, Sharpe ratio, and maximum drawdown. This allowed us to evaluate not just the final outcome but the journey along the way—an important consideration for real-world investors who experience the psychological impact of market fluctuations.
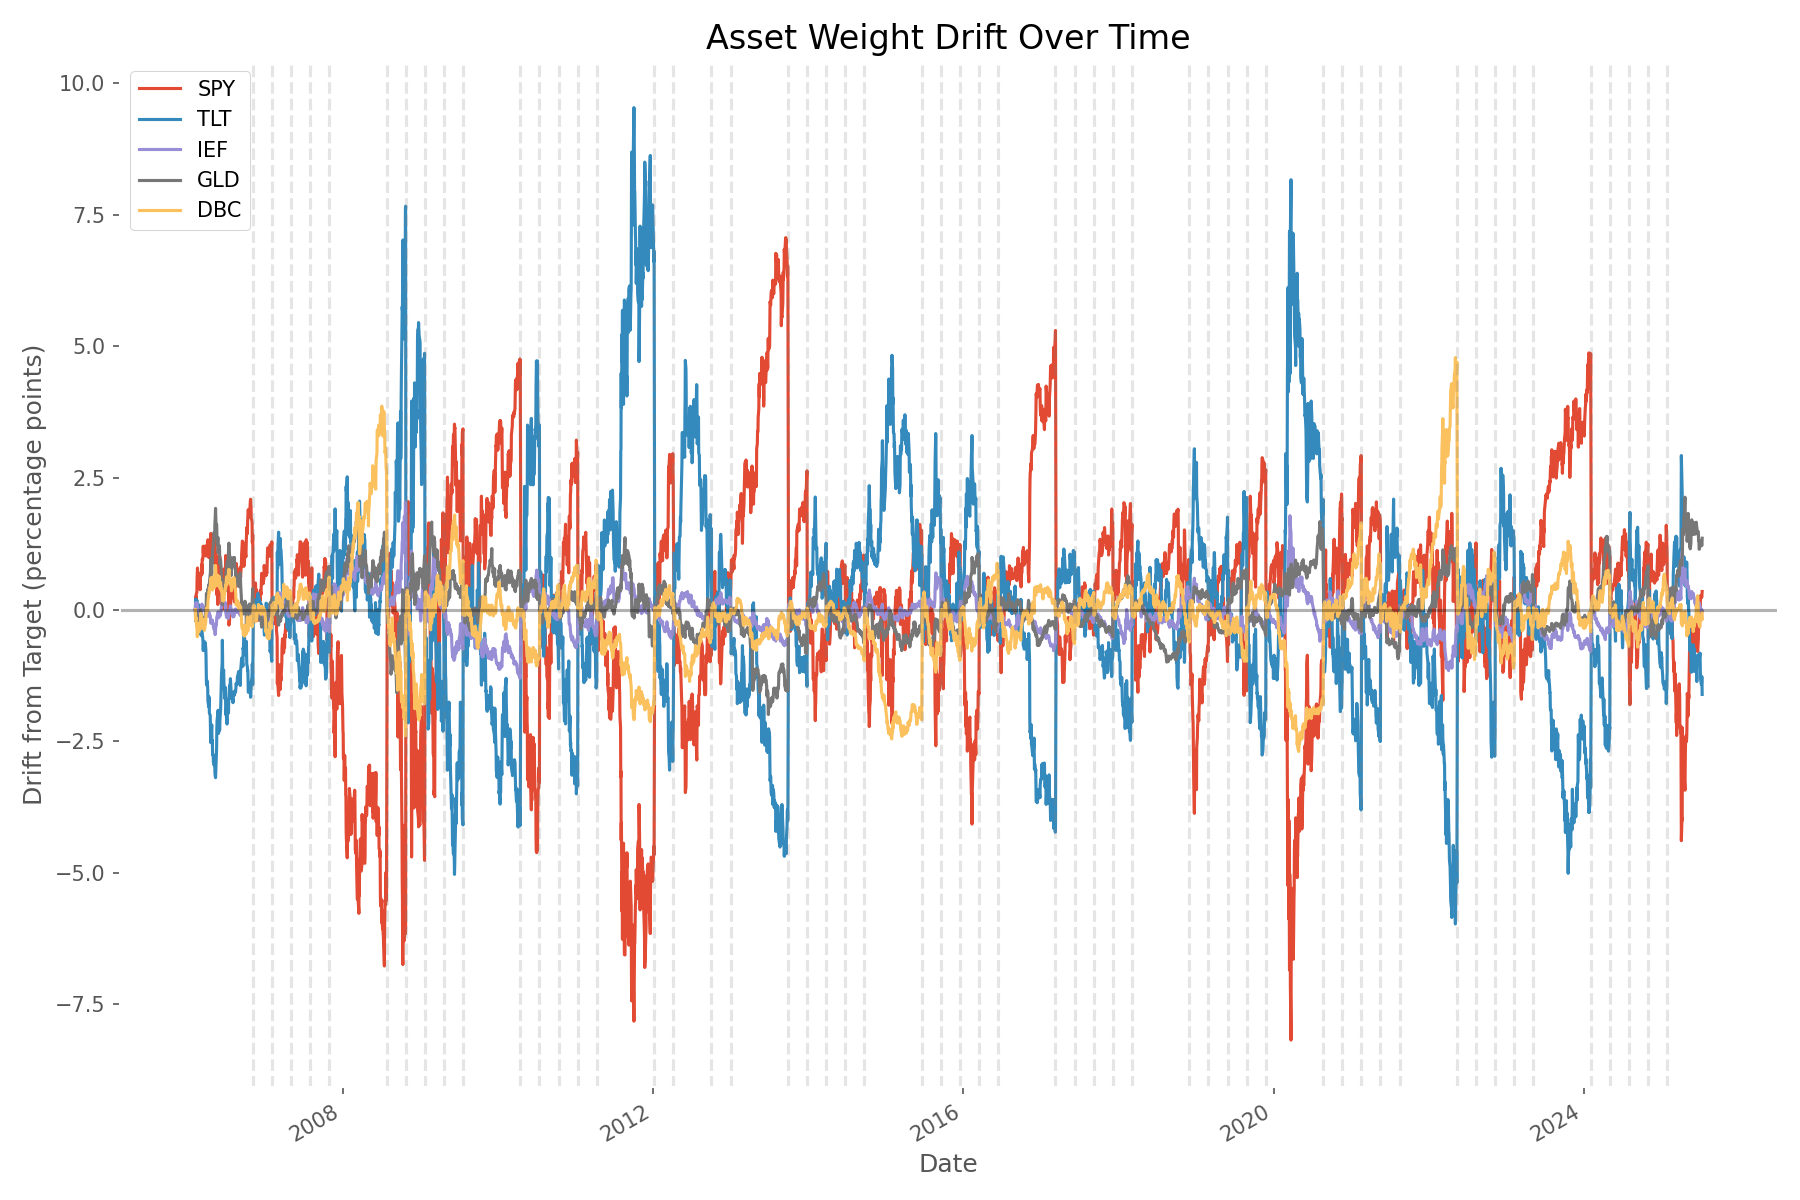
The chart above illustrates how asset weights naturally drift between rebalancing periods as different assets outperform or underperform. This drift highlights the importance of regular rebalancing to maintain the intended risk exposure of the portfolio.
Performance Evaluation and Visualization
After running our nearly 20-year simulation, the results reveal a fascinating story about the trade-offs between growth and stability in investment portfolios.
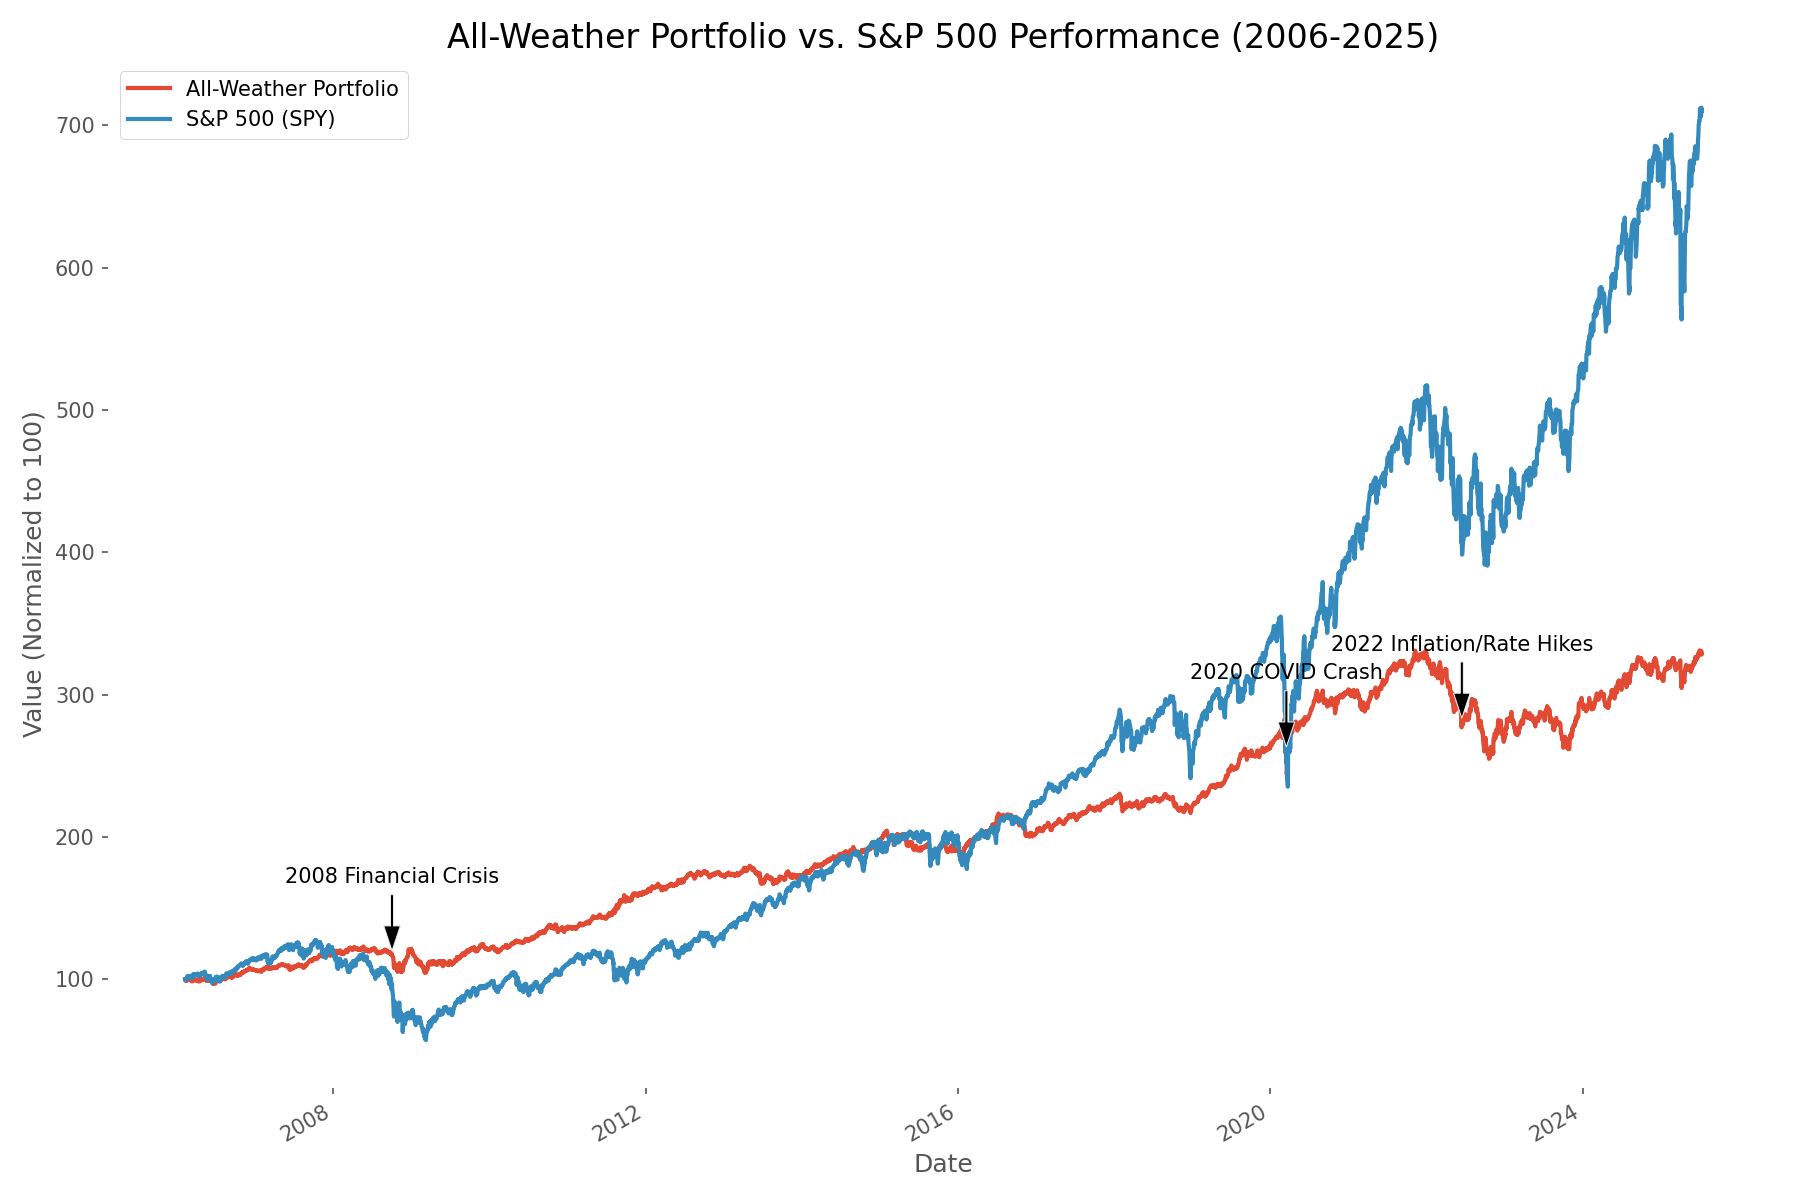
The performance chart tells a clear story: the S&P 500 significantly outperformed the All-Weather Portfolio in terms of total return. A $100,000 investment in the All-Weather Portfolio grew to $328,751 (a 228.75% return), while the same amount invested in the S&P 500 would have reached $709,983 (a 609.98% return).
However, this substantial difference in returns doesn't tell the complete story. Let's examine the key performance metrics:
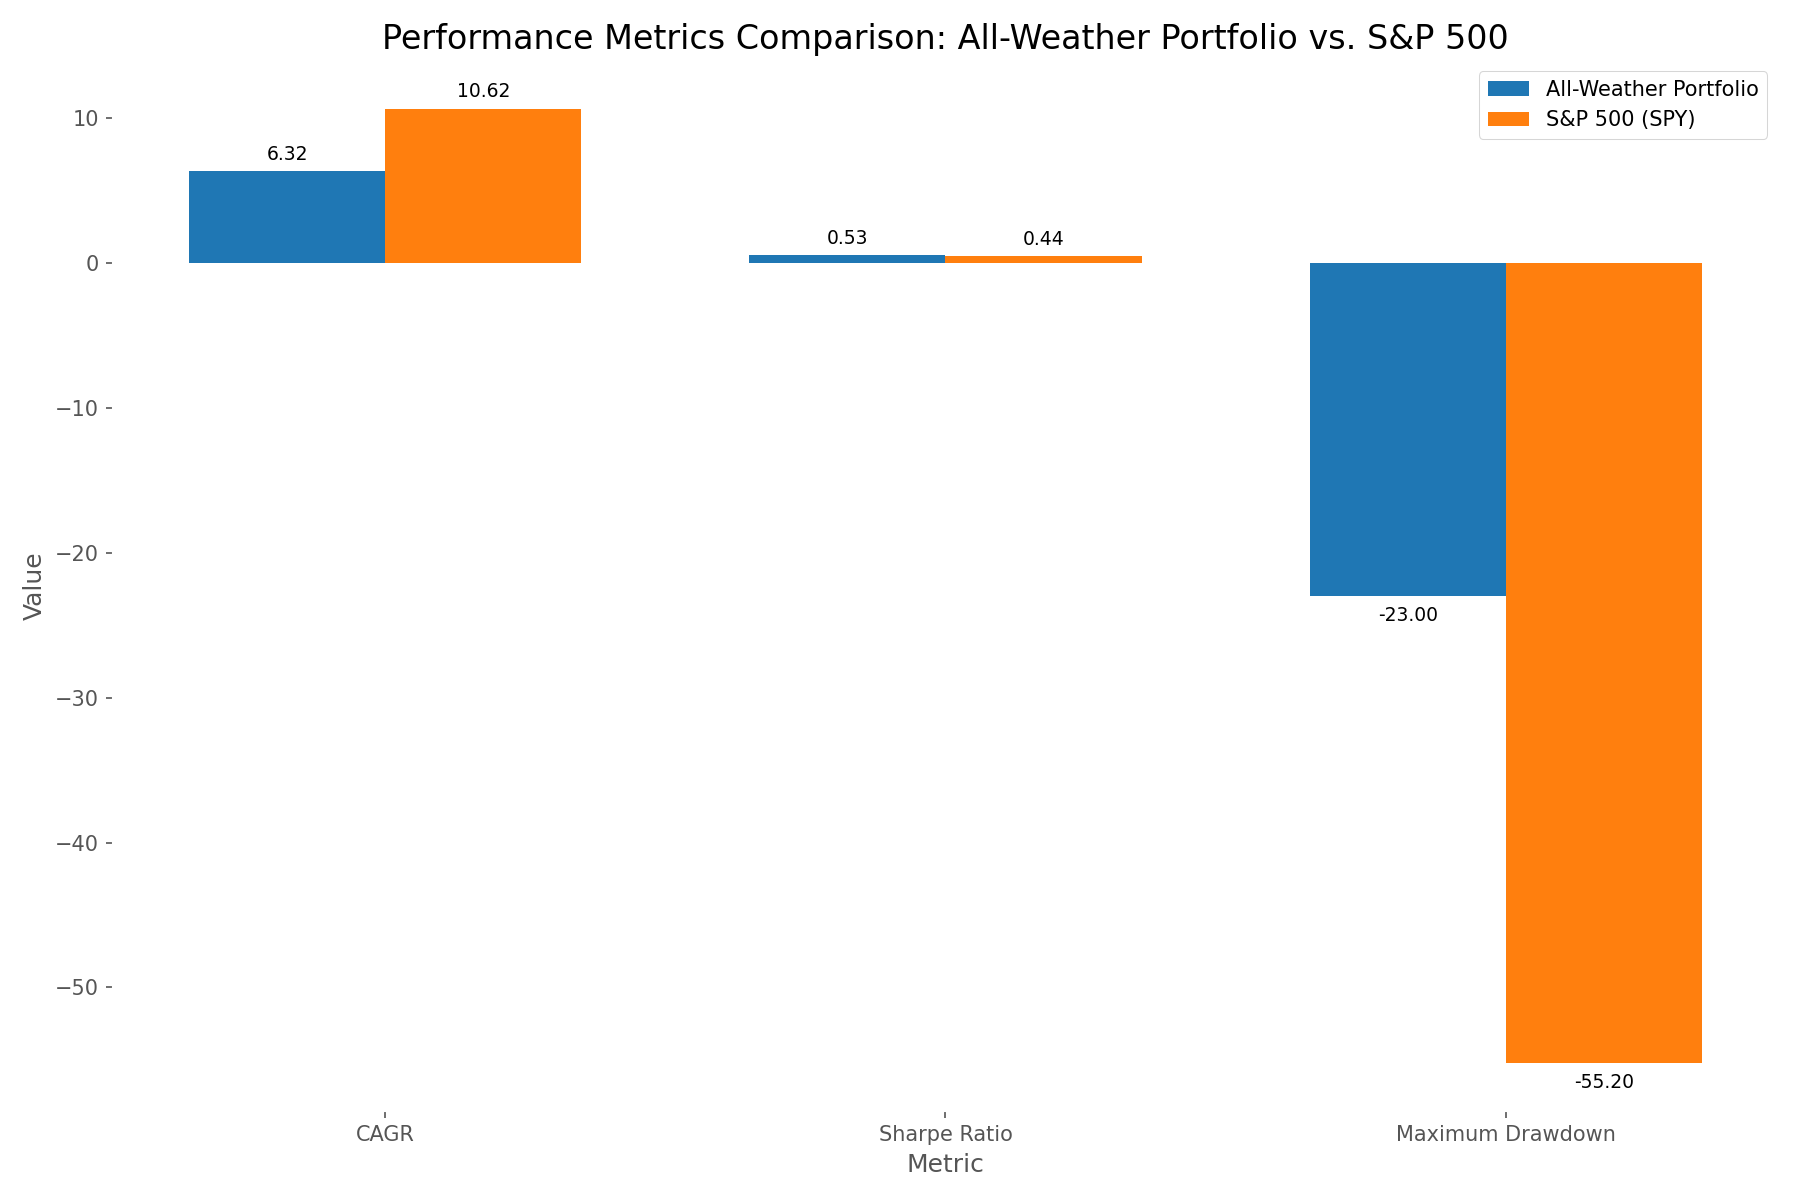
While the S&P 500 delivered a higher CAGR (10.62% vs. 6.32%), the All-Weather Portfolio demonstrated significantly better risk metrics. The portfolio's volatility was less than half that of the S&P 500 (8.21% vs. 19.58%), and its maximum drawdown was dramatically lower (-23.00% vs. -55.20%). This means that during the worst market periods, the All-Weather Portfolio preserved capital much more effectively.
Perhaps most importantly, the All-Weather Portfolio achieved a higher Sharpe ratio (0.53 vs. 0.44), indicating better risk-adjusted returns. This metric is crucial for investors who care not just about total returns but about the efficiency of their risk-taking.
Performance During Key Market Events
The true test of the All-Weather Portfolio comes during market crises. Let's examine how it performed during three significant market events:
| Event | Period | All-Weather Return | All-Weather Max Drawdown | S&P 500 Return | S&P 500 Max Drawdown |
|---|---|---|---|---|---|
| 2008 Financial Crisis | Sep 2008 - Mar 2009 | -7.44% | -15.02% | -36.55% | -55.20% |
| 2020 COVID Crash | Feb 2020 - Apr 2020 | 1.21% | -13.66% | -17.01% | -33.70% |
| 2022 Inflation/Rate Hikes | Jan 2022 - Dec 2022 | -17.73% | -23.00% | -18.64% | -24.50% |
During the 2008 Financial Crisis, the All-Weather Portfolio demonstrated remarkable resilience, losing only 7.44% compared to the S&P 500's devastating 36.55% decline. Even more impressively, during the COVID crash of 2020, the portfolio actually gained 1.21% while the S&P 500 fell 17.01%.
Interestingly, the 2022 inflation shock and rate hike environment proved challenging for both strategies, with the All-Weather Portfolio slightly underperforming the S&P 500. This highlights that no strategy is perfect for all scenarios, and the All-Weather approach may struggle during periods of simultaneous equity decline and bond market stress.
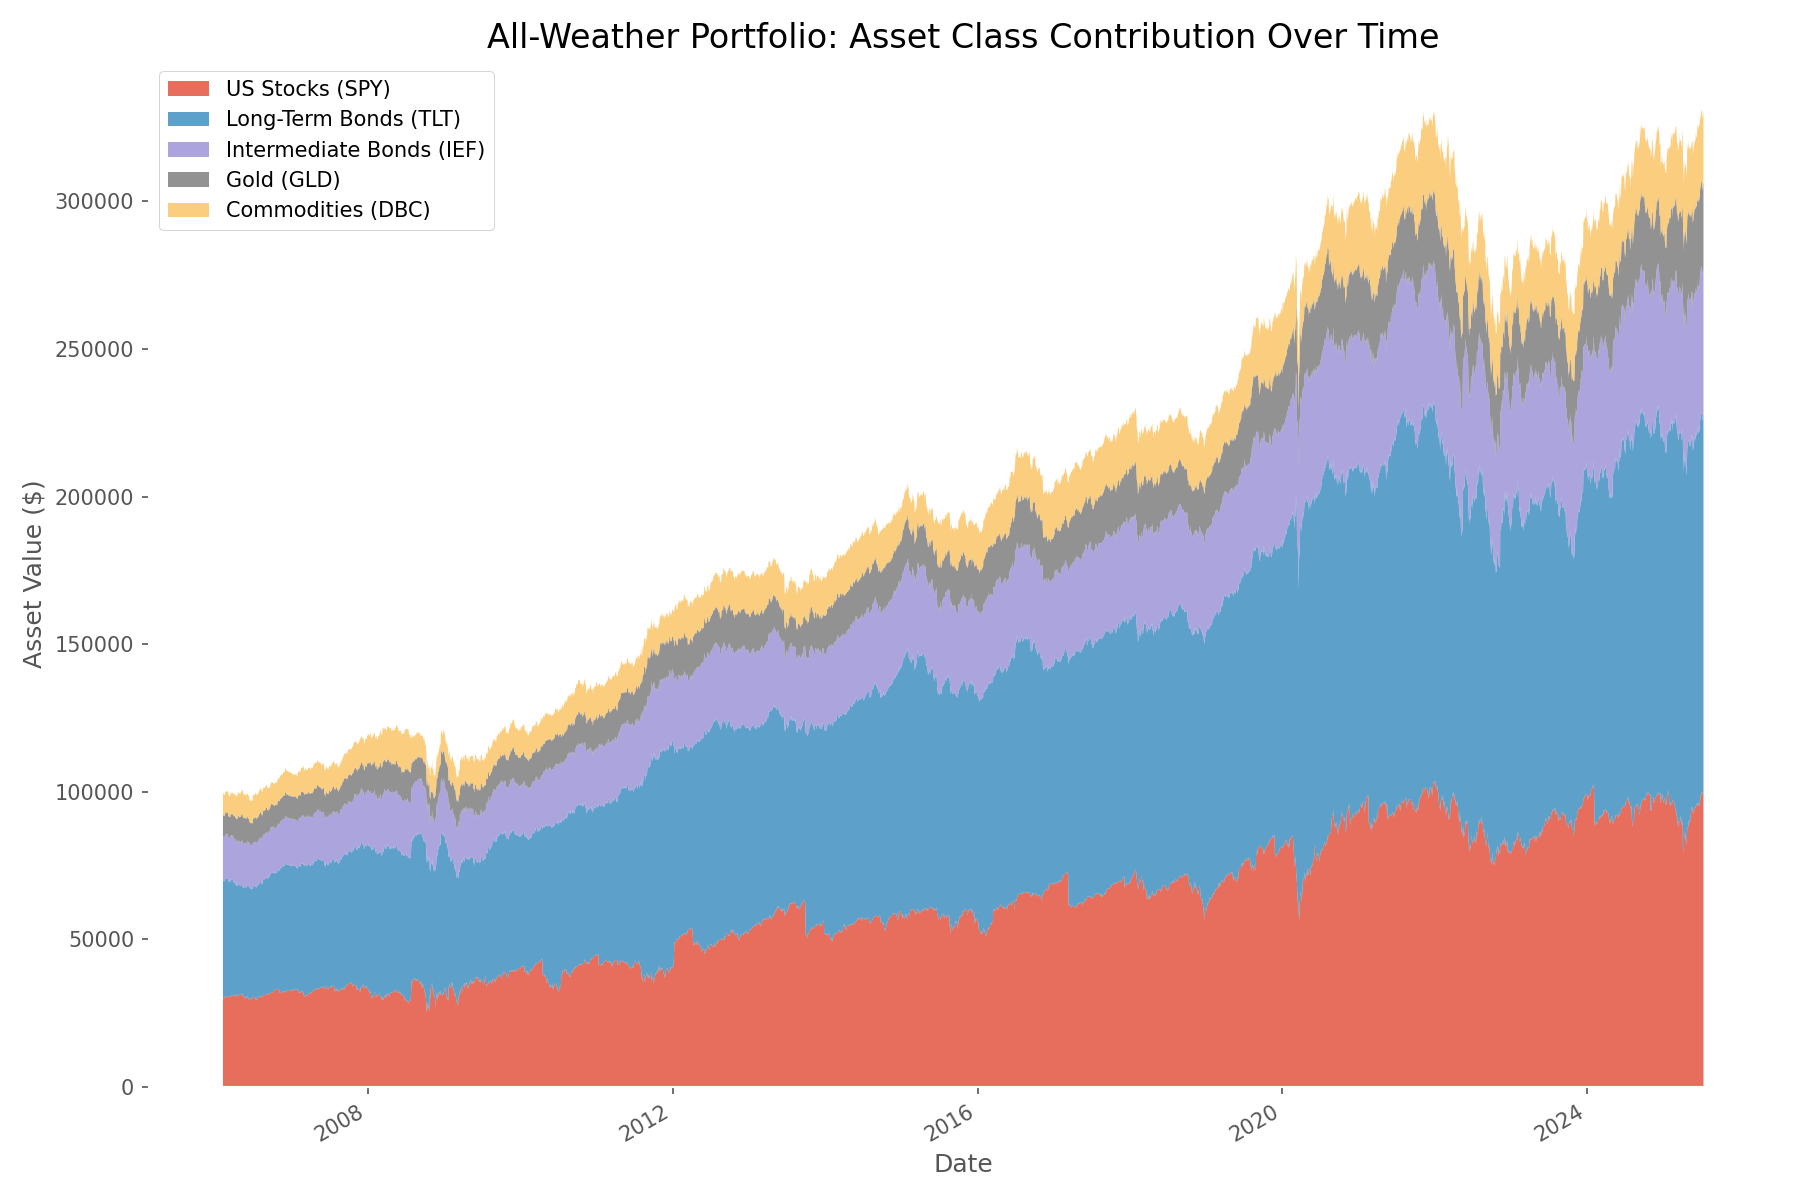
The asset contribution chart reveals how different components of the portfolio performed over time. US stocks (SPY) and long-term bonds (TLT) were the largest contributors to portfolio growth, while gold (GLD) and commodities (DBC) provided valuable diversification during specific market environments.
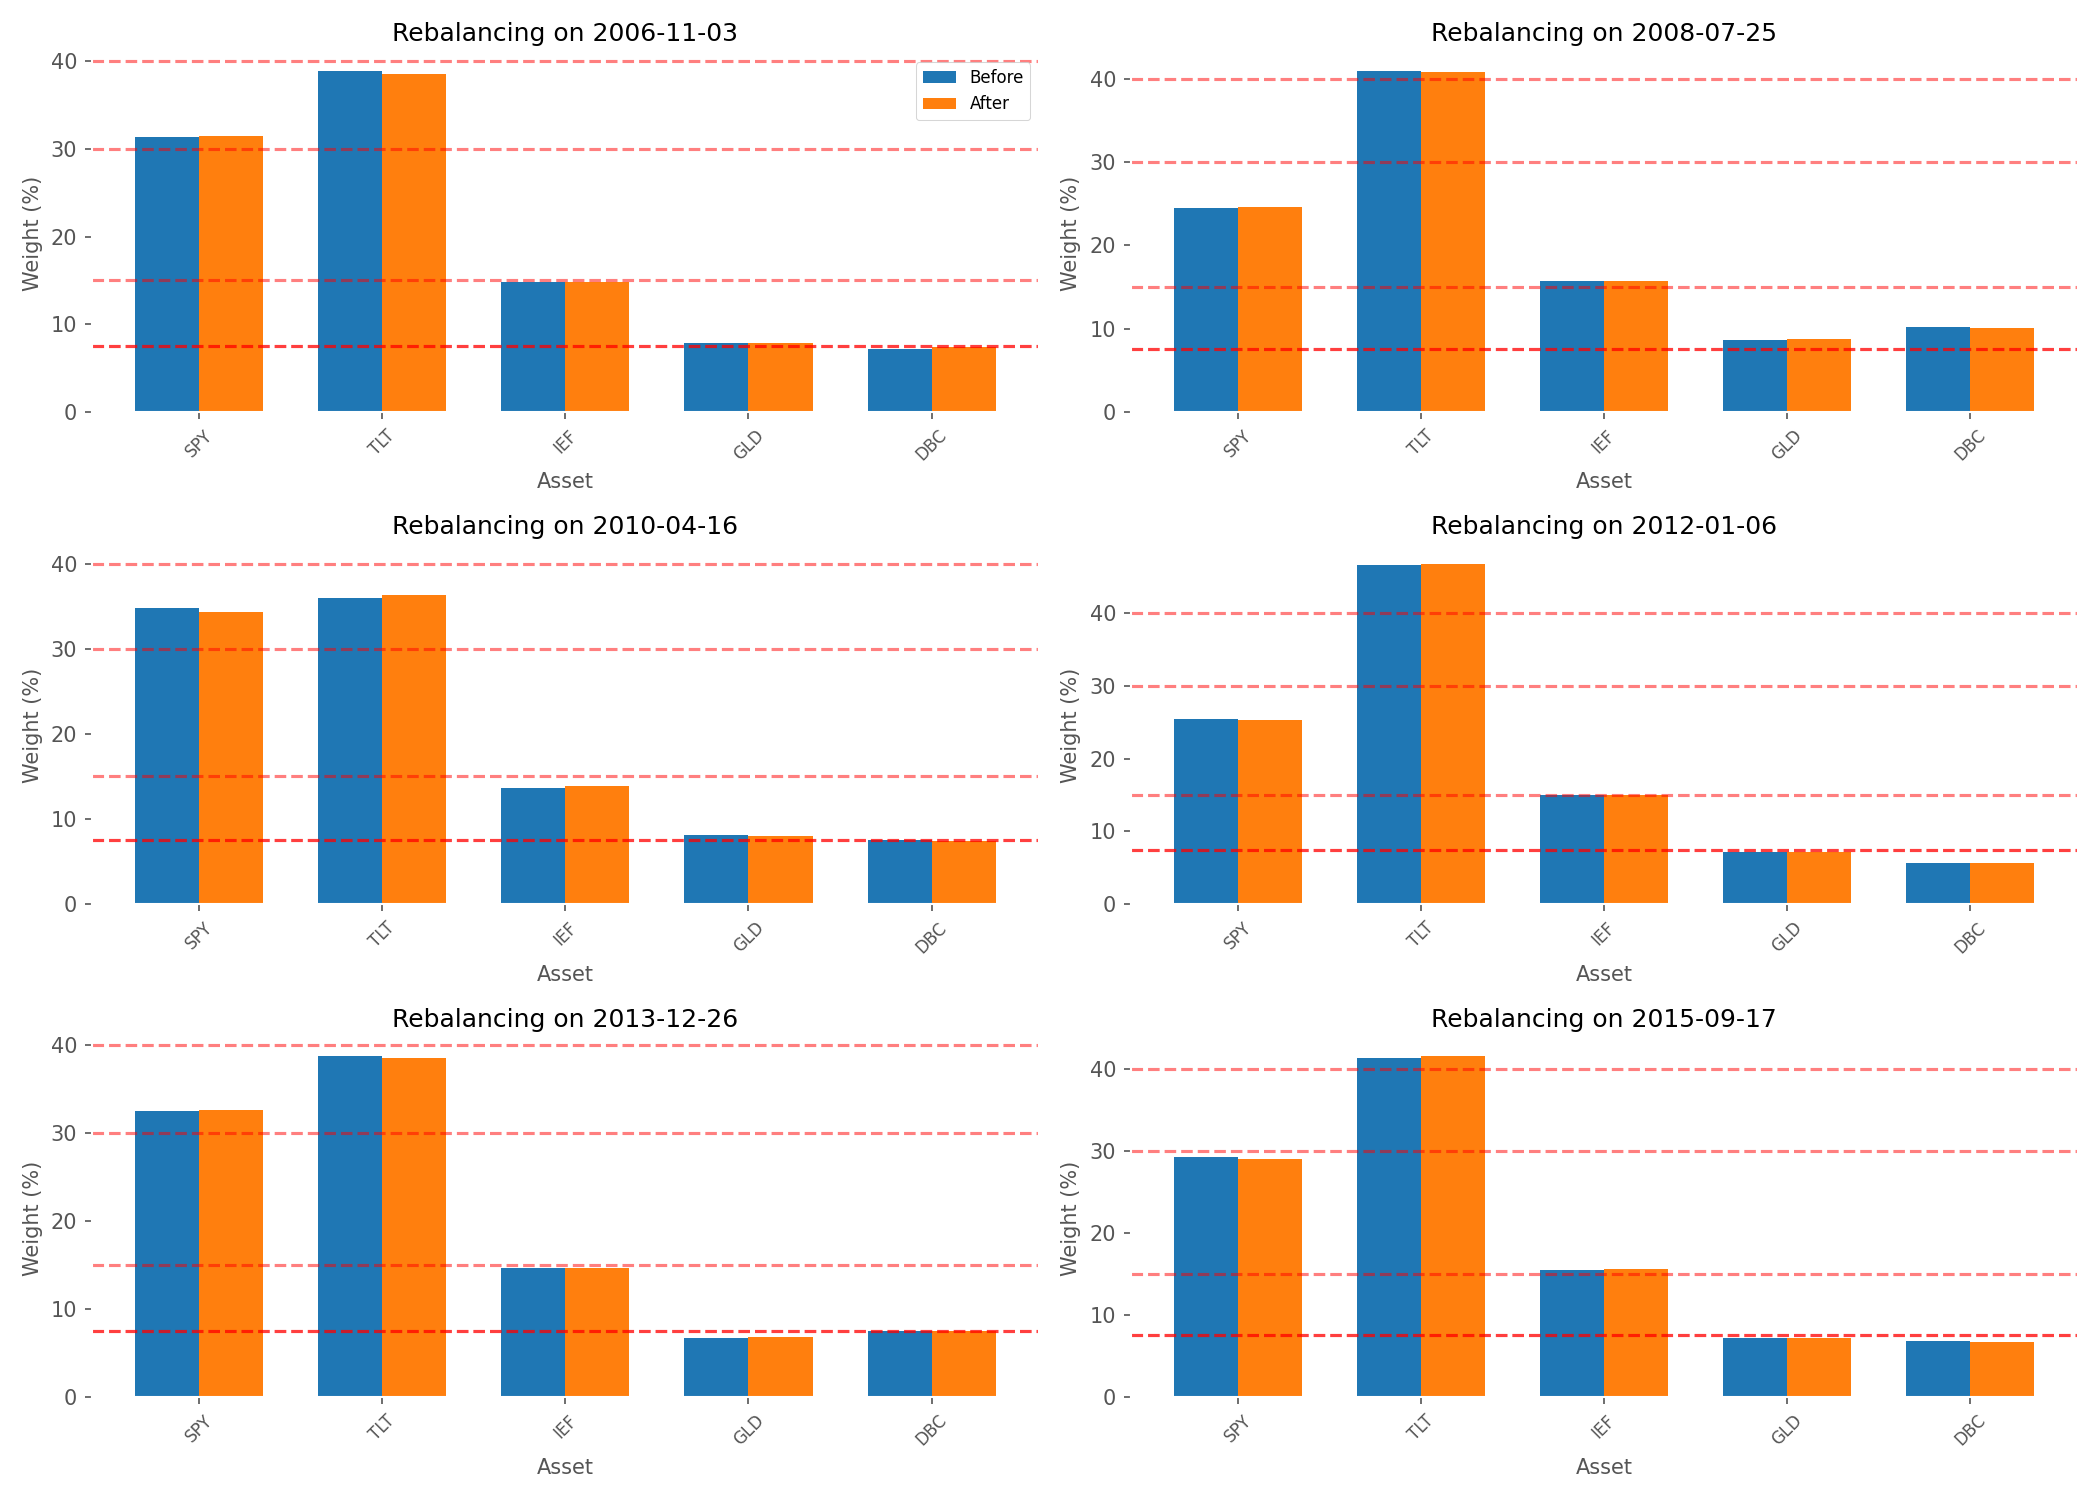
The rebalancing effect visualization demonstrates how the quarterly rebalancing discipline helped maintain the portfolio's risk profile over time. Without rebalancing, the portfolio would have gradually drifted toward higher-performing assets, potentially increasing risk exposure.
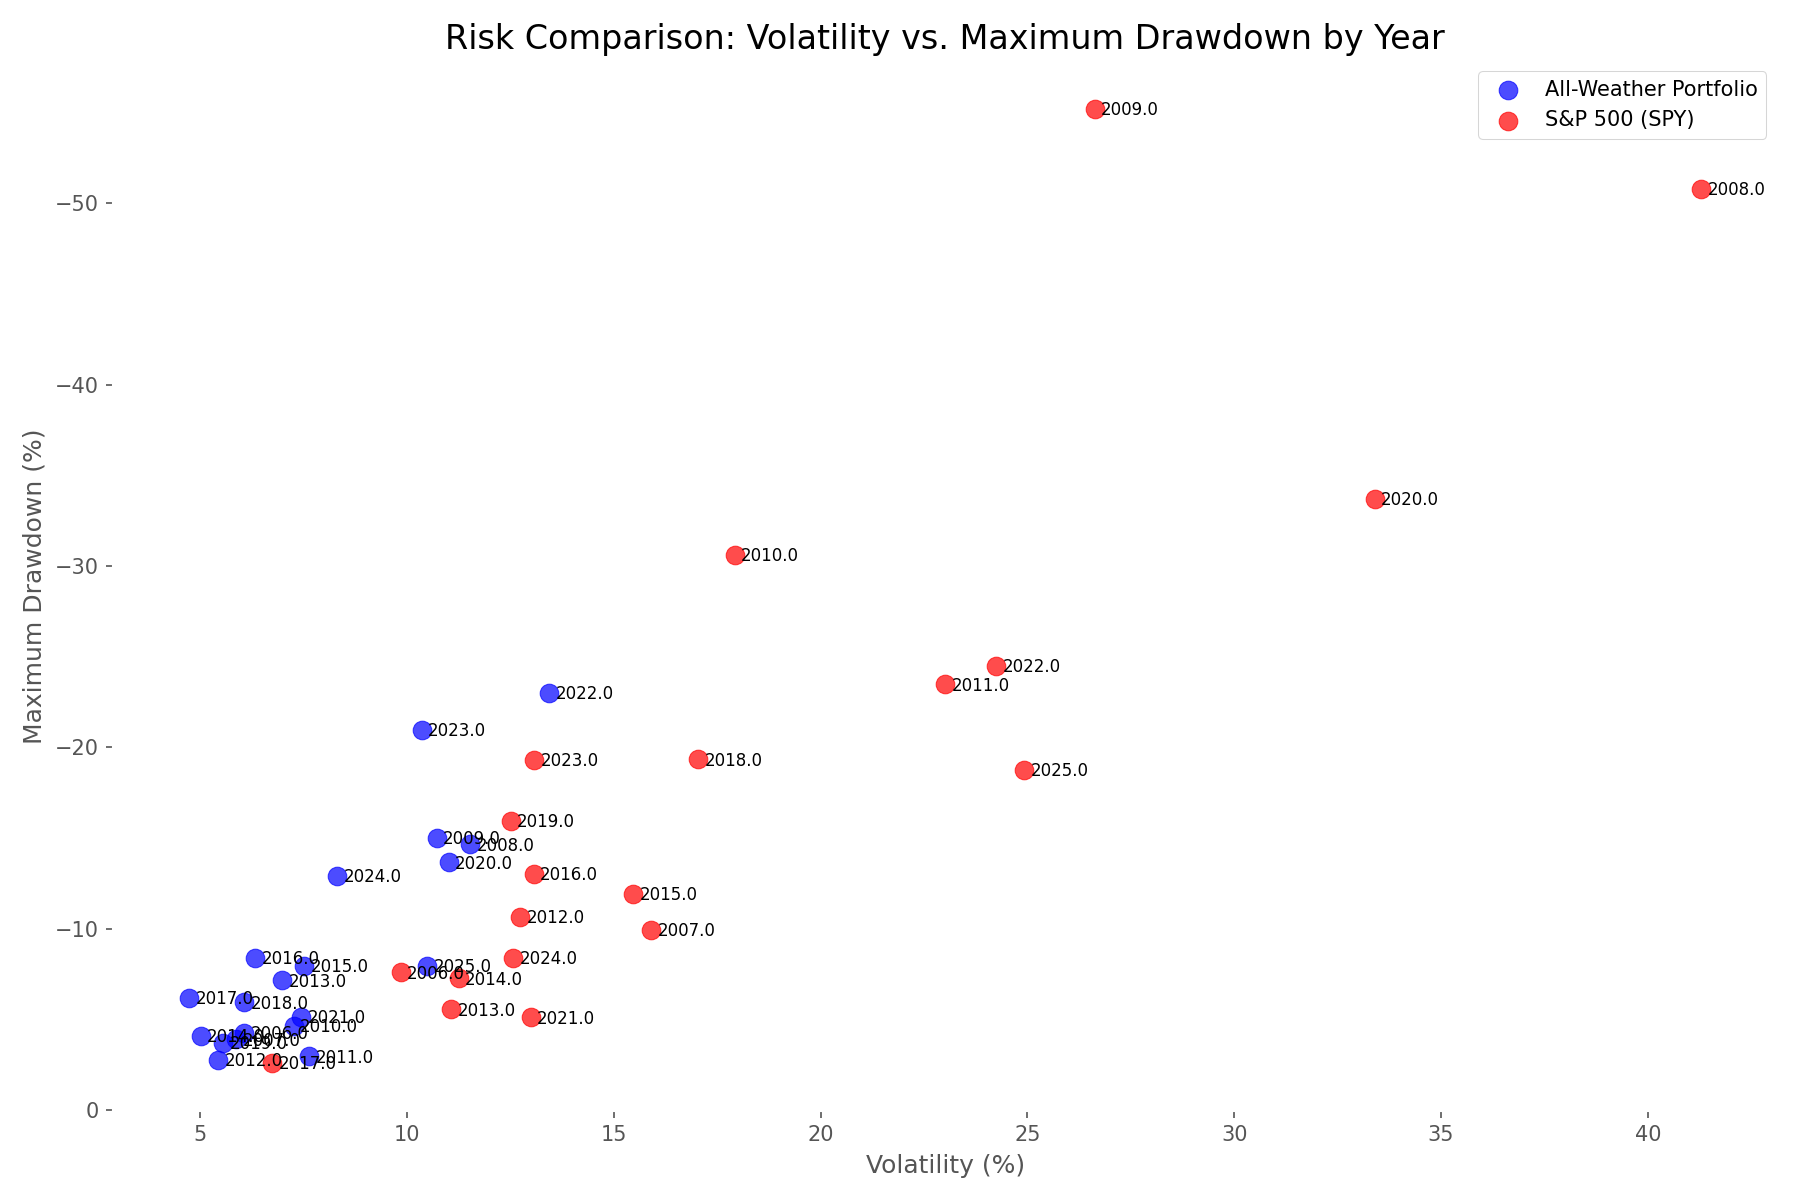
The risk analysis scatter plot above shows the relationship between drawdown and volatility for each year in our simulation period. The All-Weather Portfolio consistently clusters in the lower-left quadrant (lower risk), while the S&P 500 experiences much higher volatility and drawdowns, particularly during crisis years.
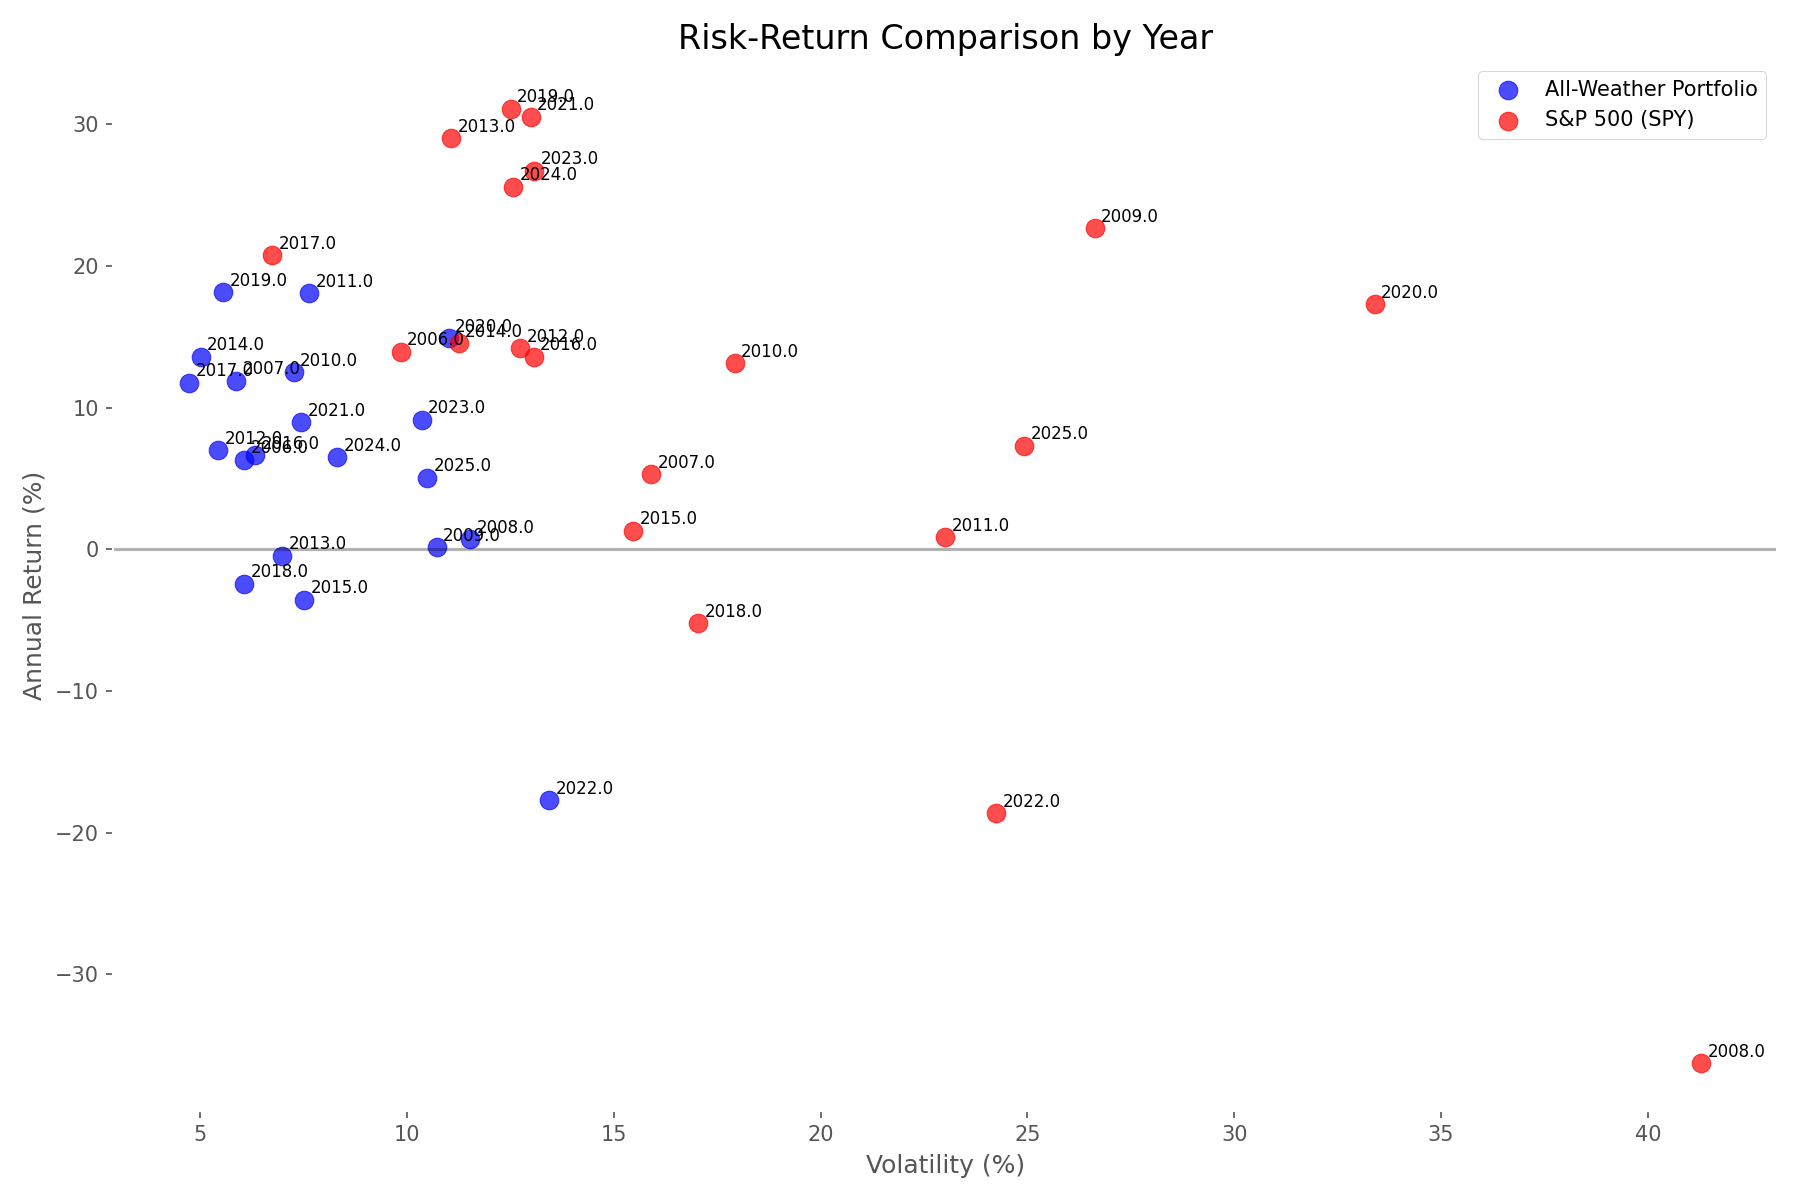
The return vs. volatility scatter plot further illustrates the risk-return trade-off between the two strategies. While the S&P 500 achieves higher returns in many years, it does so with substantially higher volatility. The All-Weather Portfolio delivers more consistent, moderate returns with much lower volatility.
Conclusion & Practical Takeaways
Our comprehensive simulation confirms that the All-Weather Portfolio largely delivers on its promise: it provides a smoother investment journey with significantly reduced drawdowns compared to an all-equity approach. However, this protection comes at a substantial cost in terms of total returns, particularly during the strong bull market that dominated much of our simulation period.
The key takeaways for investors considering this strategy include:
- The All-Weather Portfolio excels at capital preservation during market crises, making it potentially suitable for risk-averse investors or those nearing retirement
- The strategy's higher Sharpe ratio indicates more efficient risk-taking, even with lower absolute returns
- Regular rebalancing is crucial to maintaining the risk management benefits of the portfolio
- The approach may struggle during simultaneous equity and bond market stress, as seen in 2022
- Younger investors with longer time horizons might consider higher equity allocations to capture more growth potential
Perhaps the most important insight is that there's no perfect investment strategy—only strategies that align better or worse with your personal financial goals, time horizon, and risk tolerance. The All-Weather Portfolio offers a compelling option for investors who prioritize stability and are willing to accept moderate returns in exchange for a smoother journey.
As Ray Dalio himself has noted, the goal isn't to maximize returns but to create a portfolio that can survive and perform reasonably well across all economic environments. By that measure, our simulation suggests the All-Weather Portfolio largely succeeds—it may not capture all the upside during bull markets, but it provides valuable protection when economic storms arrive.
Comments (0)
No comments yet. Be the first to comment!