Introduction
In the ever-evolving landscape of investment management, the integration of macroeconomic indicators into portfolio decisions remains an underutilized approach for many investors. While markets often react dramatically to economic announcements, fewer investors systematically incorporate this data into their allocation strategies. What if the signals were hiding in plain sight all along?
This article explores four distinct portfolio management strategies that leverage economic indicators from the Federal Reserve Economic Data (FRED) database. Rather than relying on gut feelings or market timing, we'll examine data-driven approaches that adjust asset allocations based on observable economic trends. Each strategy has been rigorously backtested against market data from Tiingo and yfinance, with no assumptions made prior to analysis.
The question we're exploring is straightforward but powerful: Can economic indicators provide meaningful signals for portfolio management that improve risk-adjusted returns? Let's dive into the data and find out.
Section 1: Allocating Based on Interest Rate Trends
Central bank policy rates are among the most watched economic indicators globally. When the Federal Reserve adjusts interest rates, markets react—but can we use these signals systematically for portfolio management?
Our first strategy is elegantly simple: when the Federal Funds Rate is increasing, we allocate 70% to bonds and 30% to equities, adopting a more defensive posture. Conversely, when rates are decreasing, we shift to 70% equities and 30% bonds, embracing a more growth-oriented approach.
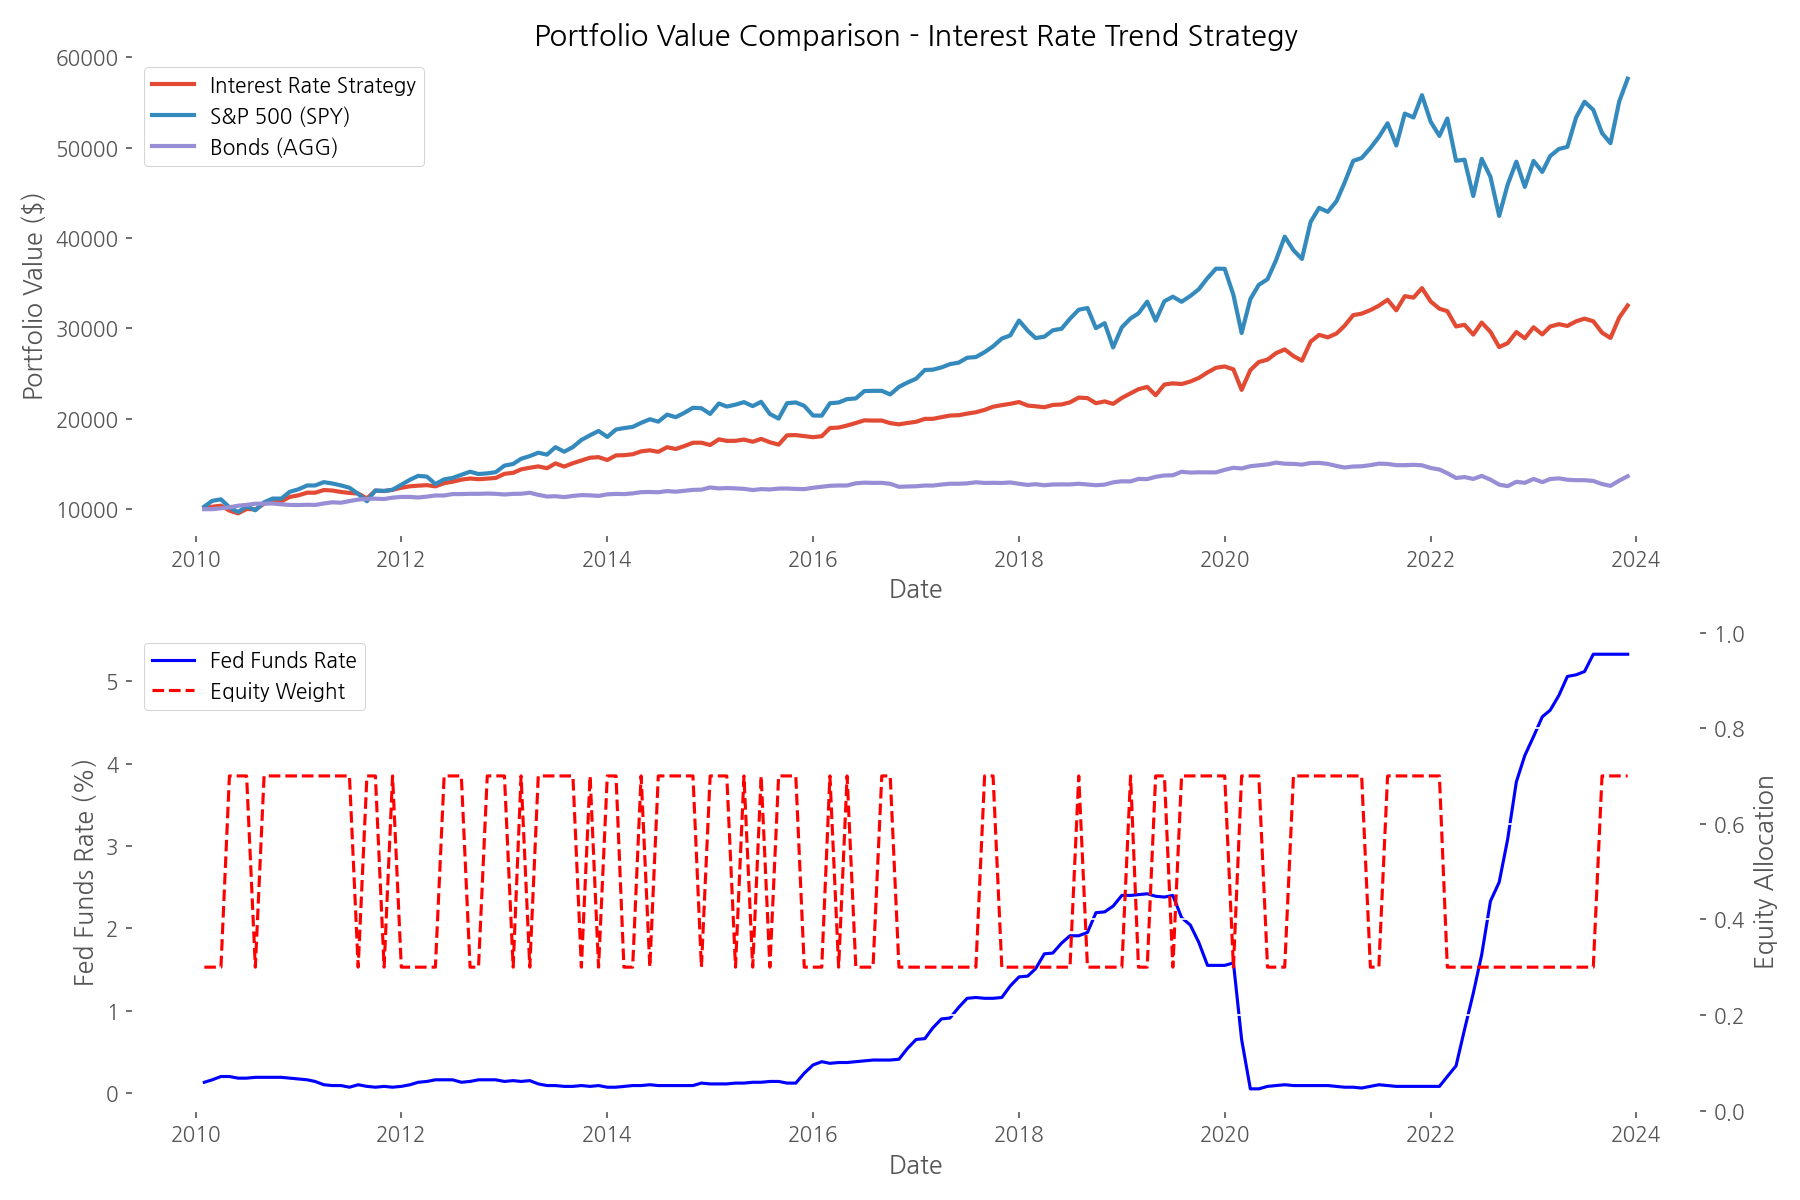
The results are compelling. While the S&P 500 delivered higher absolute returns (476.17% vs. 225.45%), our Interest Rate Strategy achieved a superior Sharpe ratio of 0.98 compared to the S&P 500's 0.91. This means better risk-adjusted returns. The strategy also significantly reduced volatility (9.01% vs. 14.79%) and limited maximum drawdown to -18.90% compared to the S&P 500's -23.93%.
What makes this approach particularly attractive is its simplicity. By following a clear rule based on observable interest rate trends, investors can potentially achieve smoother returns without attempting to predict market tops and bottoms. The strategy essentially automates the old adage 'don't fight the Fed' into a systematic allocation approach.
Section 2: Portfolio Volatility Adjustment Using Inflation Volatility
Inflation is often called the silent portfolio killer. But beyond the absolute level of inflation, the volatility or uncertainty in inflation readings can signal economic instability that affects market performance. Our second strategy explores this relationship by adjusting equity exposure inversely to inflation volatility.
The approach is intuitive: when inflation becomes more volatile and unpredictable (measured using the Consumer Price Index), we reduce equity exposure to protect capital. When inflation stabilizes, we increase equity allocation to capture growth opportunities. The strategy constrains equity weights between 20% and 80% to maintain diversification while still allowing meaningful tactical shifts.
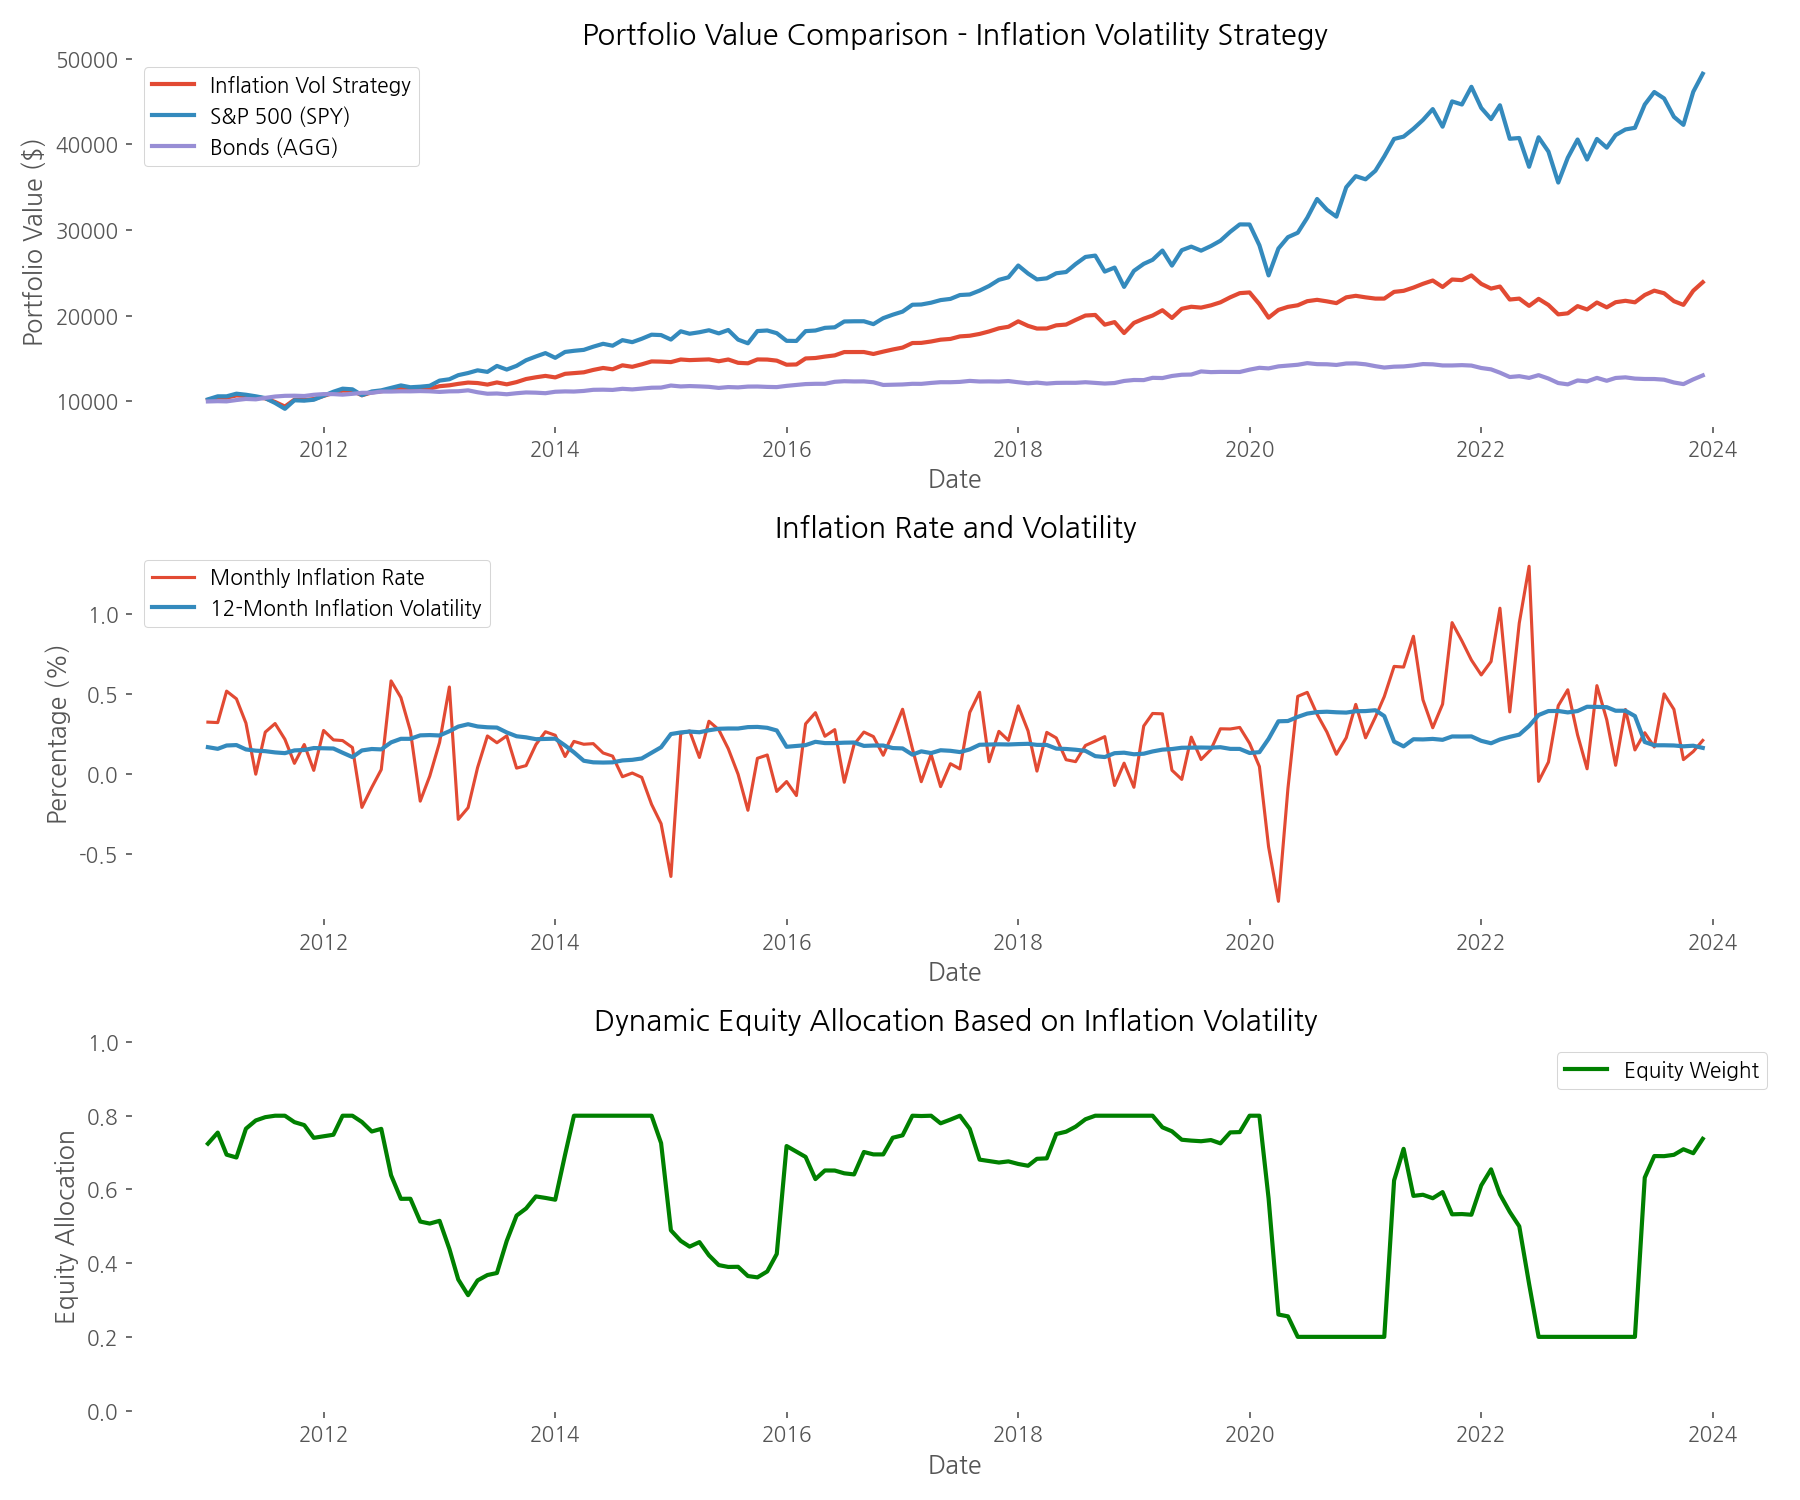
The data shows this strategy achieved a total return of 139.13% with an annualized return of 6.94%. While this underperformed the S&P 500's 382.57% total return, it did so with significantly lower volatility (9.15% vs. 14.49%) and reduced maximum drawdown (-18.41% vs. -23.93%).
What's particularly interesting is how this strategy performed during periods of inflation uncertainty. During the 2008 financial crisis and the 2020 pandemic—both periods of significant economic uncertainty and inflation volatility—the strategy reduced equity exposure, helping to mitigate losses. This demonstrates how macroeconomic signals can provide early warning indicators for portfolio protection.
Section 3: Business Cycle Signal Using Unemployment Rate
The unemployment rate is one of the most reliable indicators of economic health and business cycle positioning. Our third strategy uses this powerful signal to adjust portfolio allocations: when unemployment is falling (indicating economic expansion), we allocate 80% to equities and 20% to bonds. When unemployment is rising (suggesting economic contraction), we shift to a more balanced 50% equities and 50% bonds allocation.
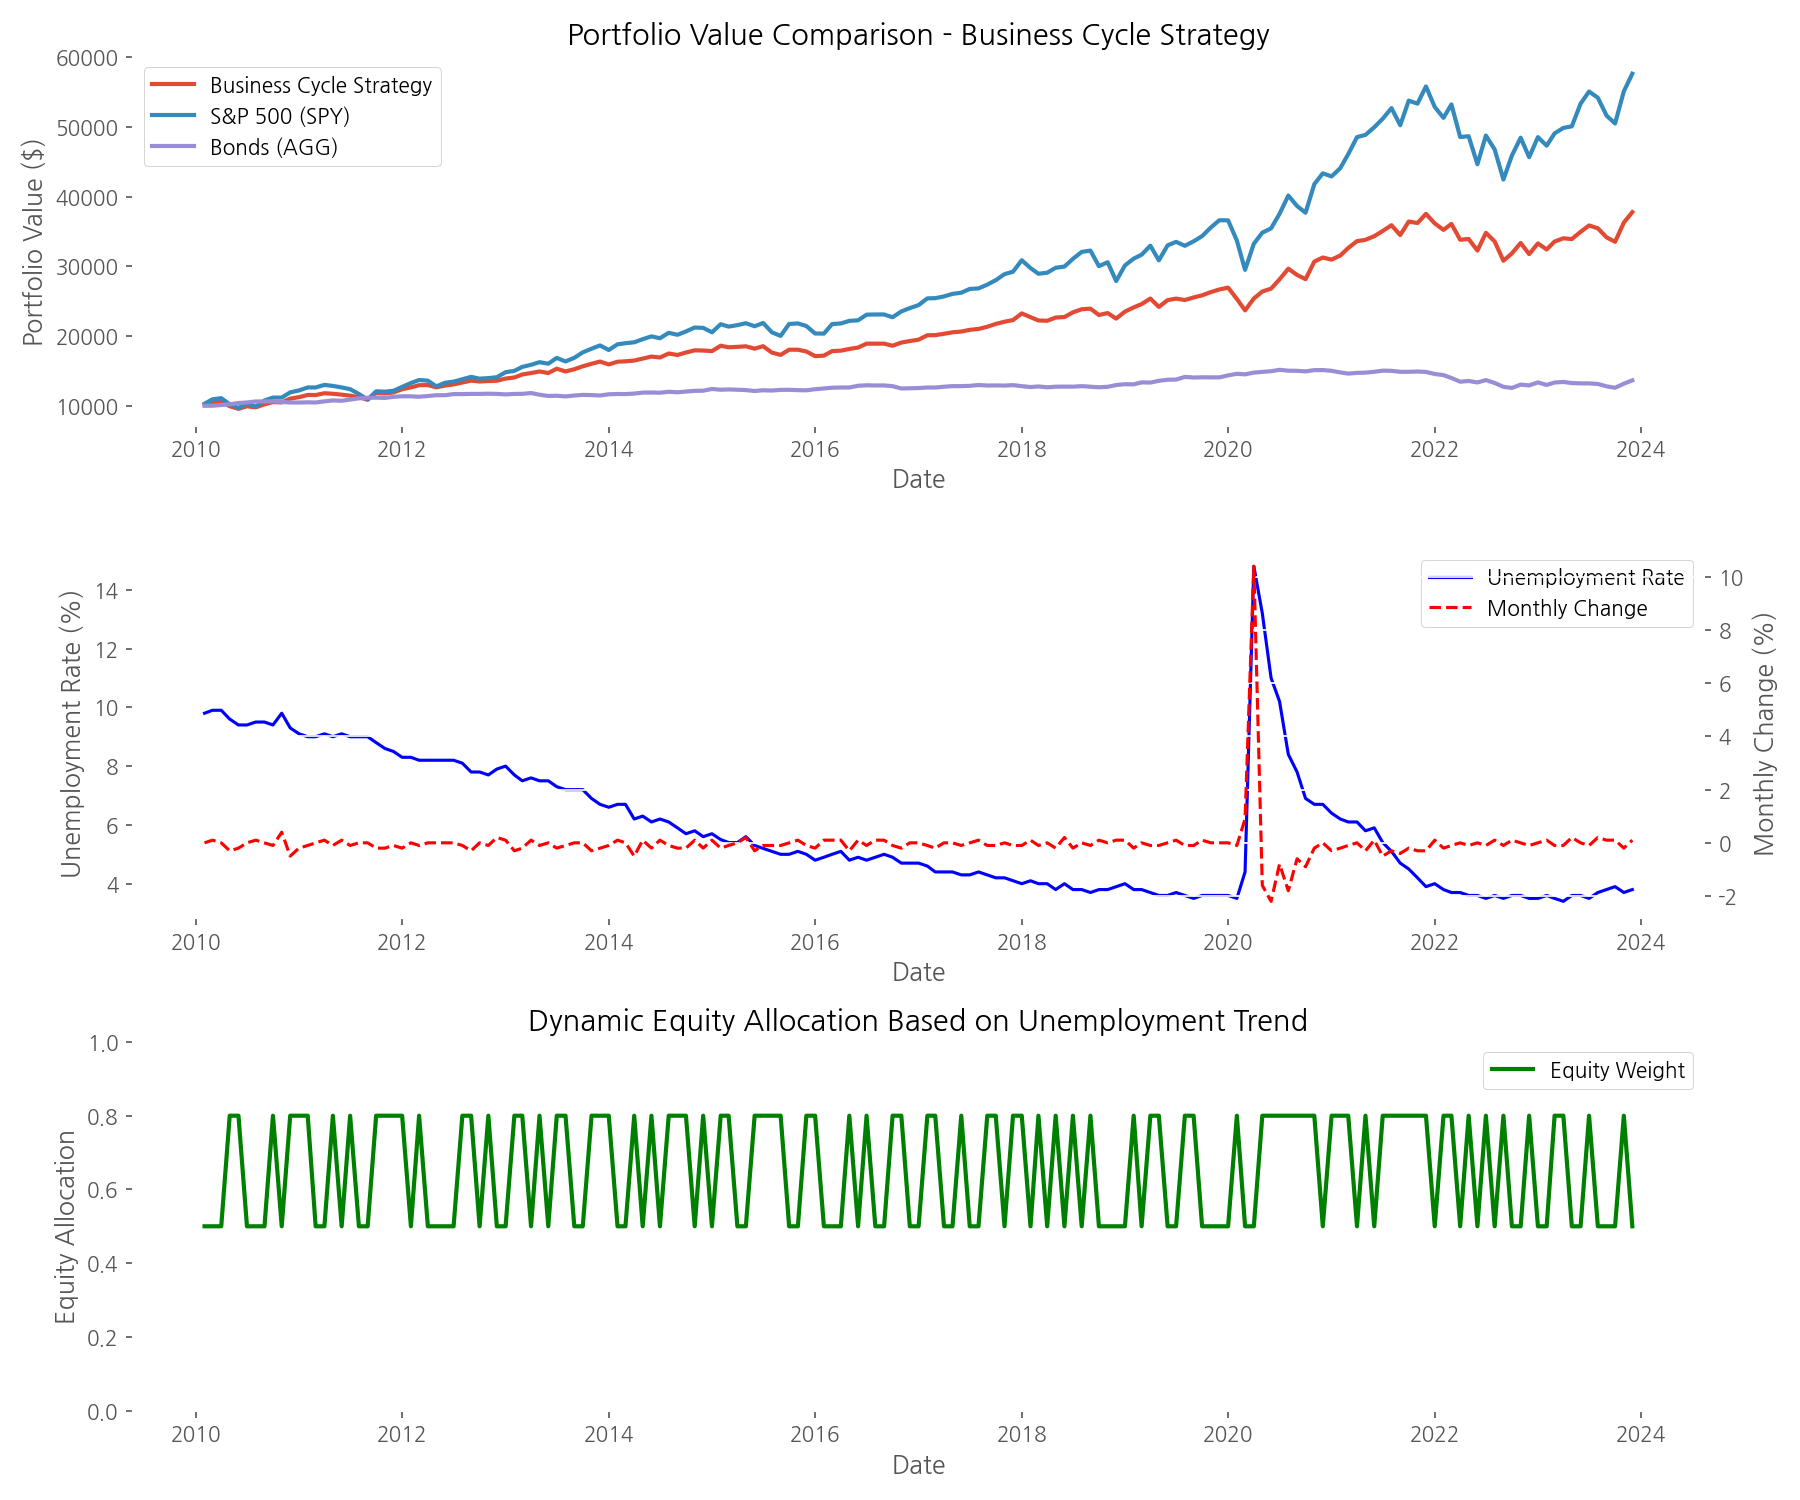
This strategy emerged as our top performer among the economic indicator approaches. It delivered a total return of 277.78% with an annualized return of 10.02%. While still below the S&P 500's 476.17% total return, it achieved the highest Sharpe ratio of 0.98 (compared to the S&P 500's 0.91) and the lowest maximum drawdown at -17.91% (vs. -23.93% for the S&P 500).
The unemployment rate proved to be a particularly effective signal during major economic transitions. The strategy increased bond allocations ahead of significant market downturns when unemployment began to rise, and shifted back to equities during recovery phases when unemployment started to fall. This demonstrates how labor market data can serve as an effective proxy for broader economic health and market potential.
Section 4: Leading Indicator Model using Manufacturing Employment
For our final strategy, we sought a leading economic indicator that might provide early signals of changing market conditions. Manufacturing employment data proved to be an effective proxy for economic momentum, often shifting before broader market trends became apparent.
The strategy allocates 70% to equities and 30% to bonds when manufacturing employment is above its 12-month moving average (signaling economic strength). When employment falls below this moving average (indicating potential economic weakness), the allocation flips to 30% equities and 70% bonds.
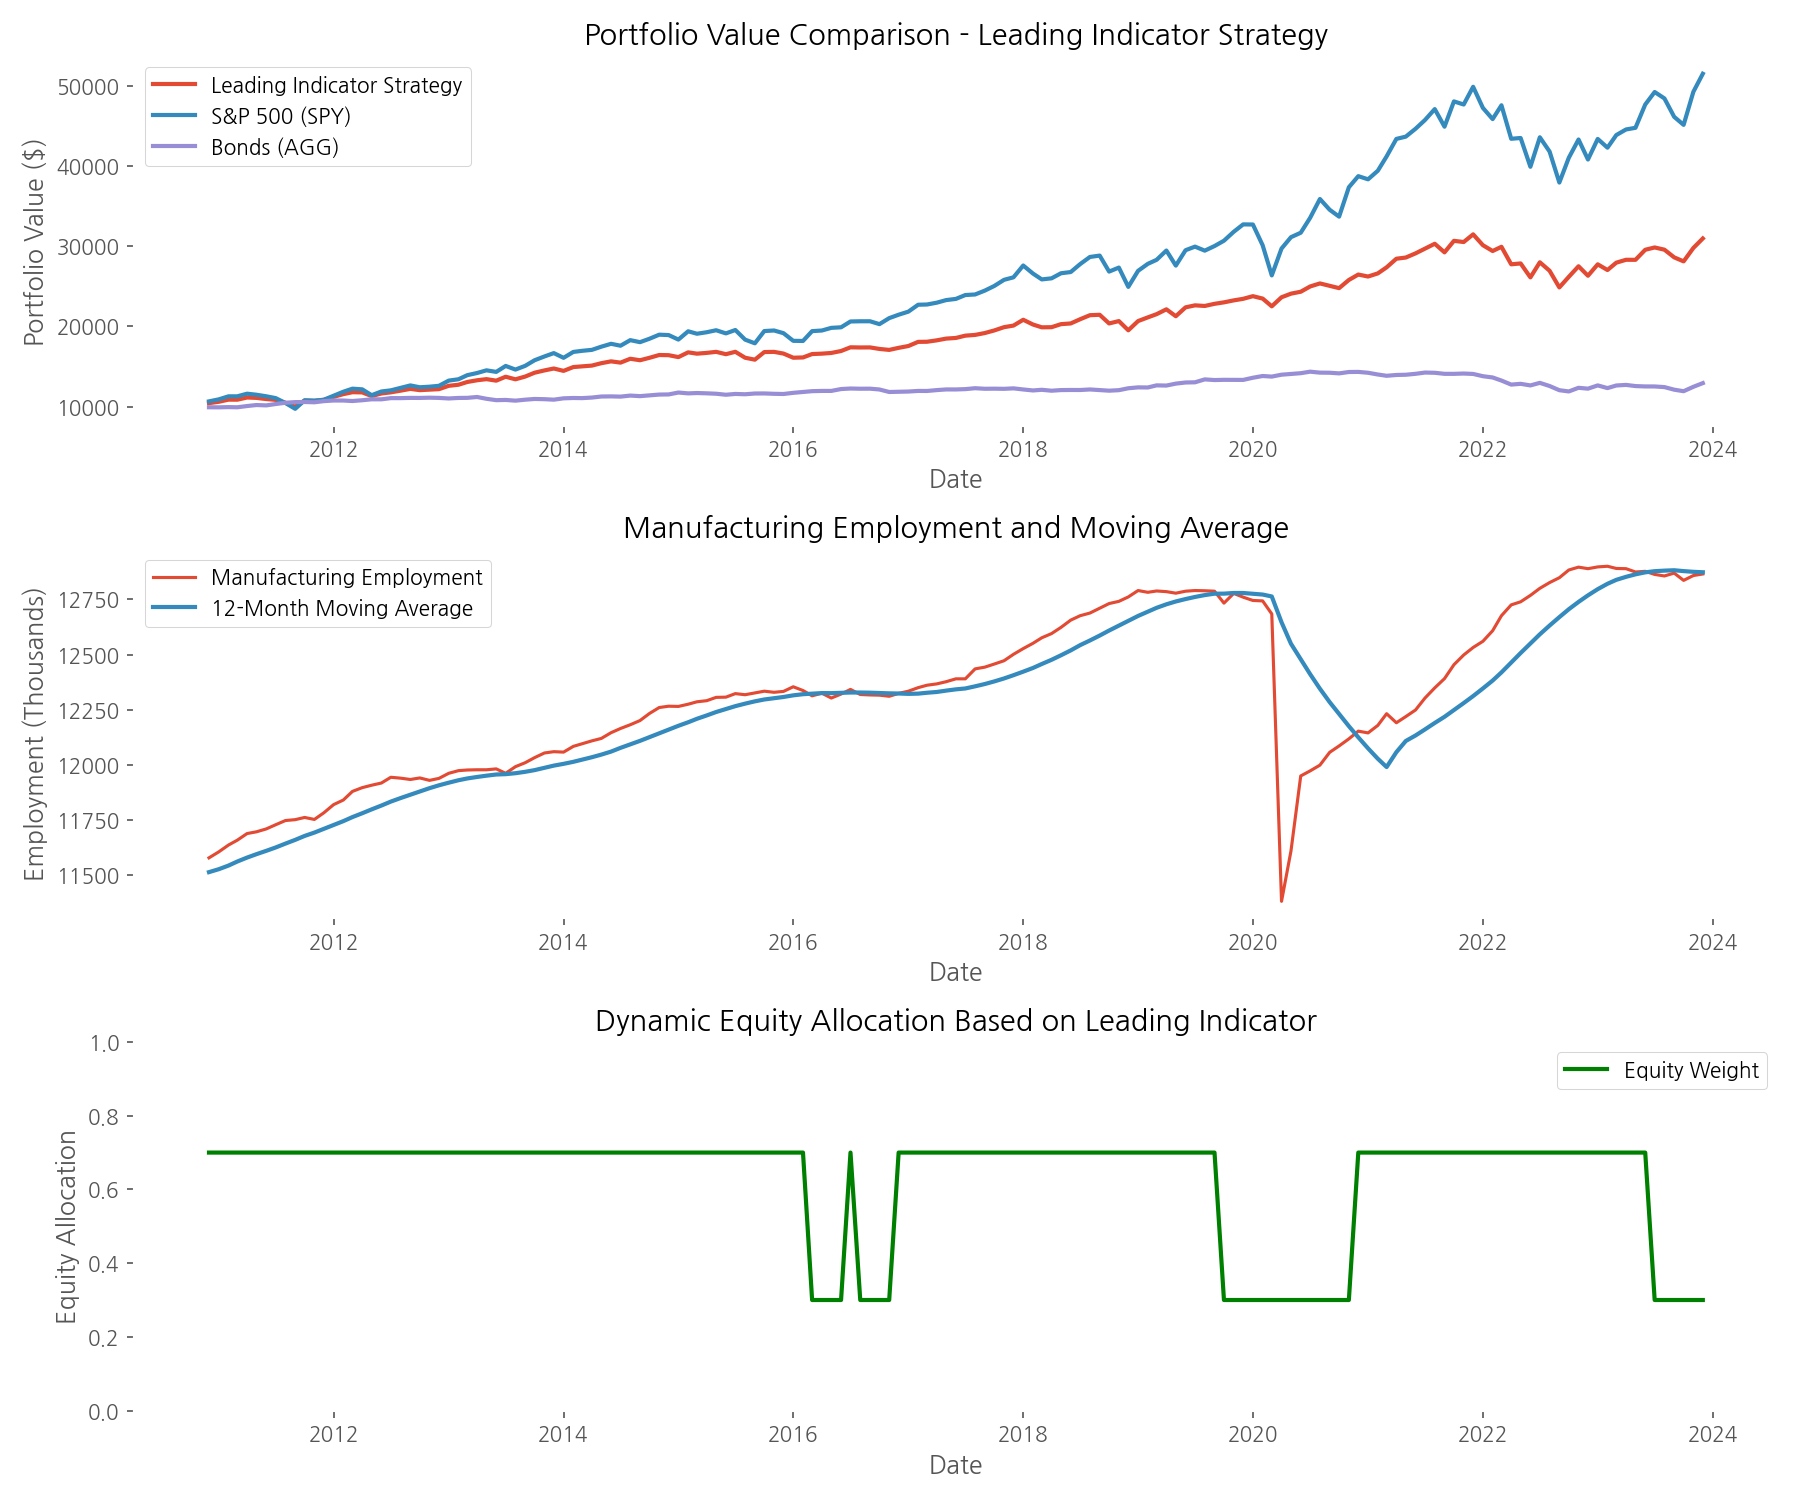
This approach delivered a total return of 209.60% with an annualized return of 9.02%. Its Sharpe ratio of 0.95 outperformed the S&P 500's 0.92, with volatility of just 9.49% compared to the market's 14.52%. The maximum drawdown was -21.01%, still better than the S&P 500's -23.93%.
What makes this strategy particularly valuable is its forward-looking nature. Manufacturing employment often serves as a canary in the economic coal mine, responding to changing business conditions before they impact the broader economy. By using this signal, investors can potentially position their portfolios ahead of major market shifts rather than reacting after they've already begun.
Strategy Comparison and Key Insights
When we compare all four strategies against each other and the S&P 500 benchmark, several important insights emerge:
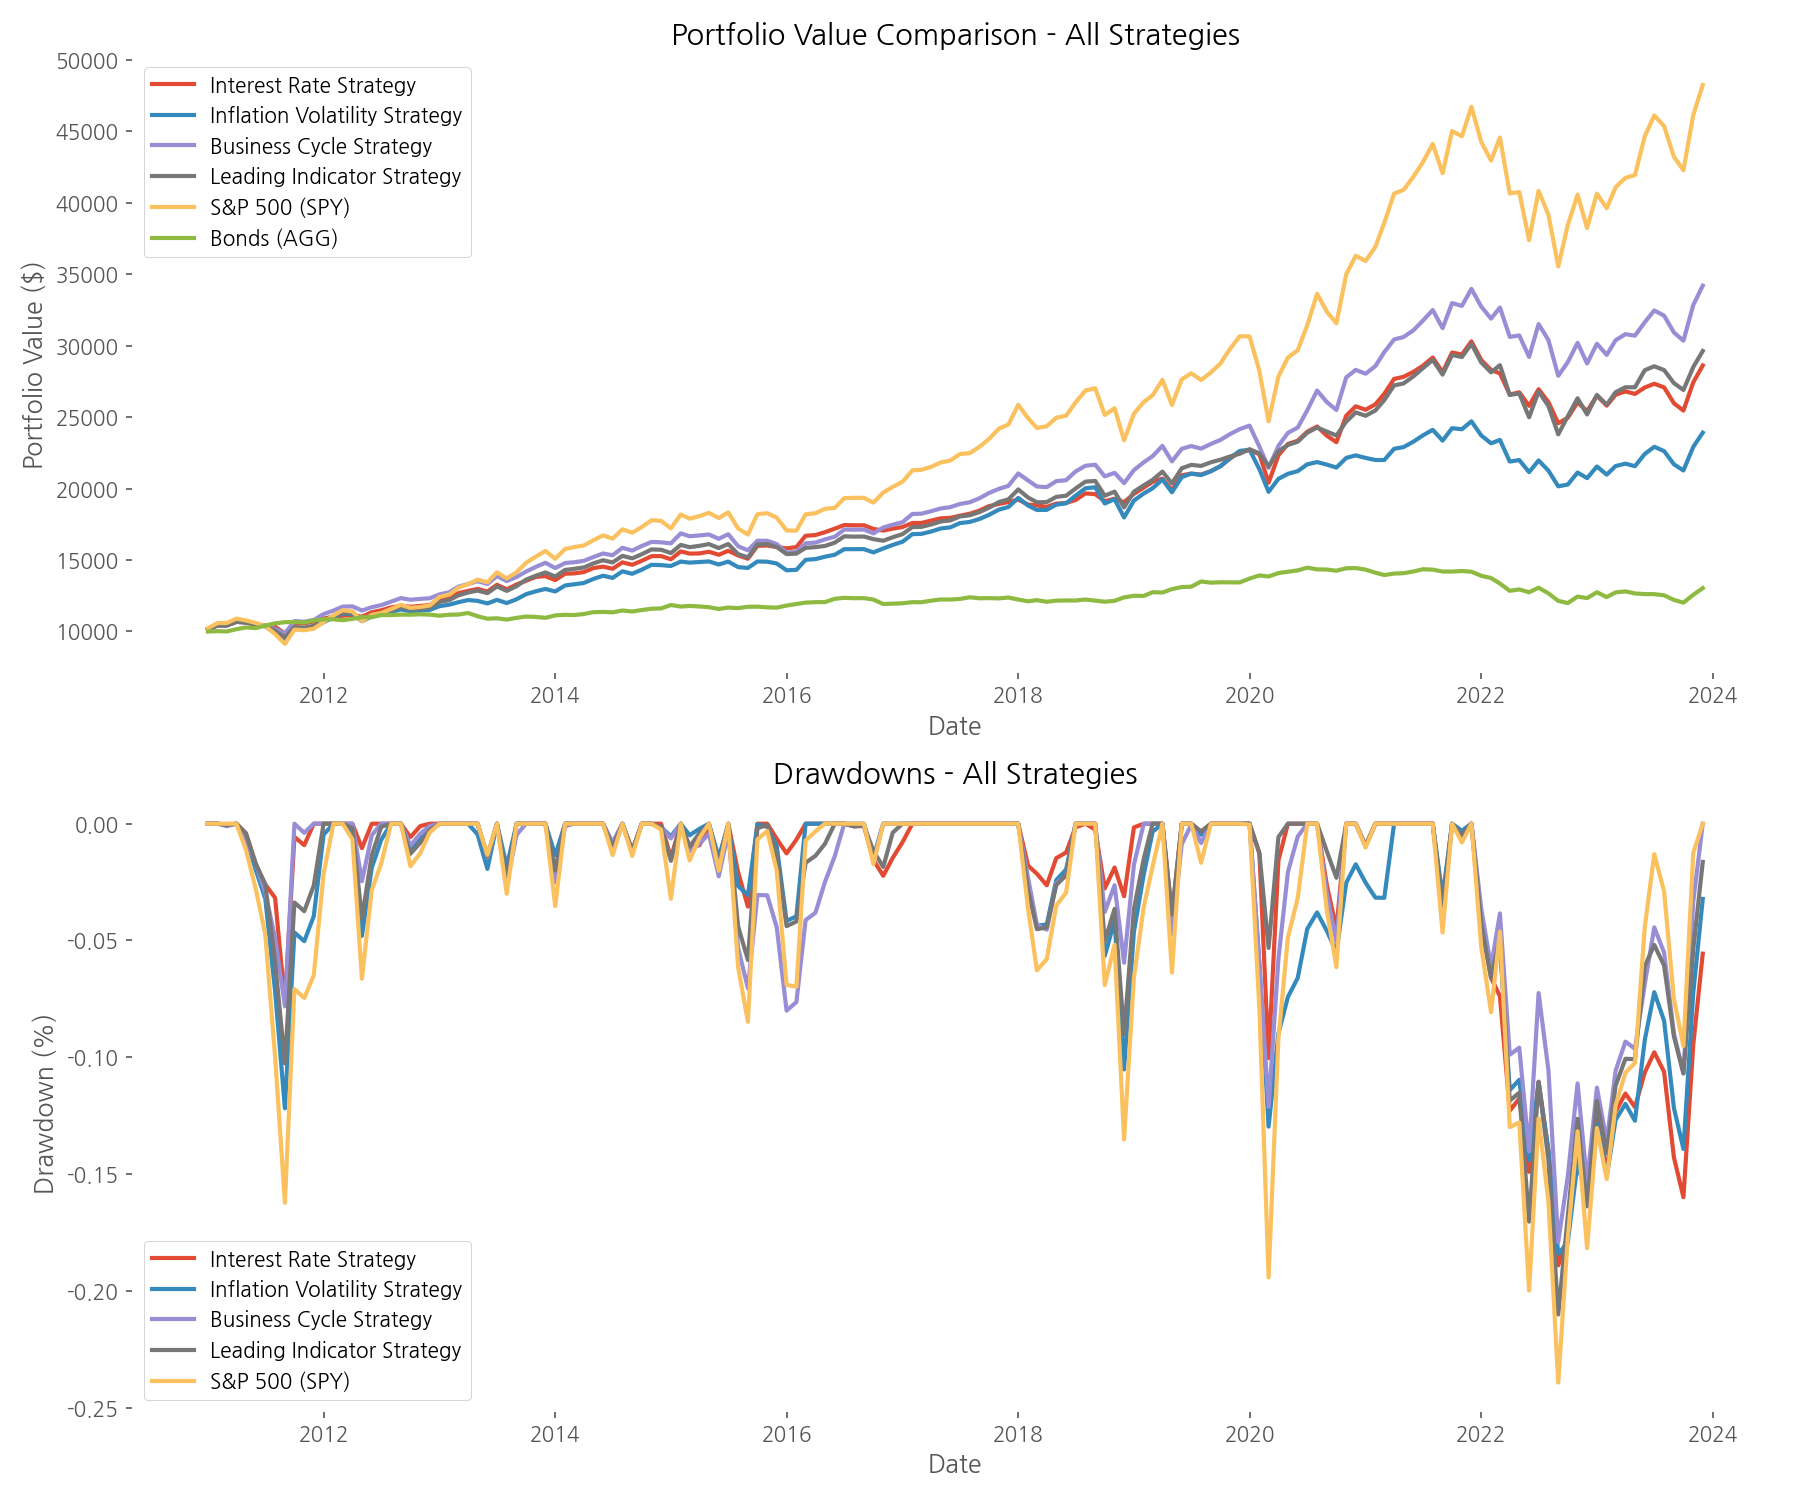
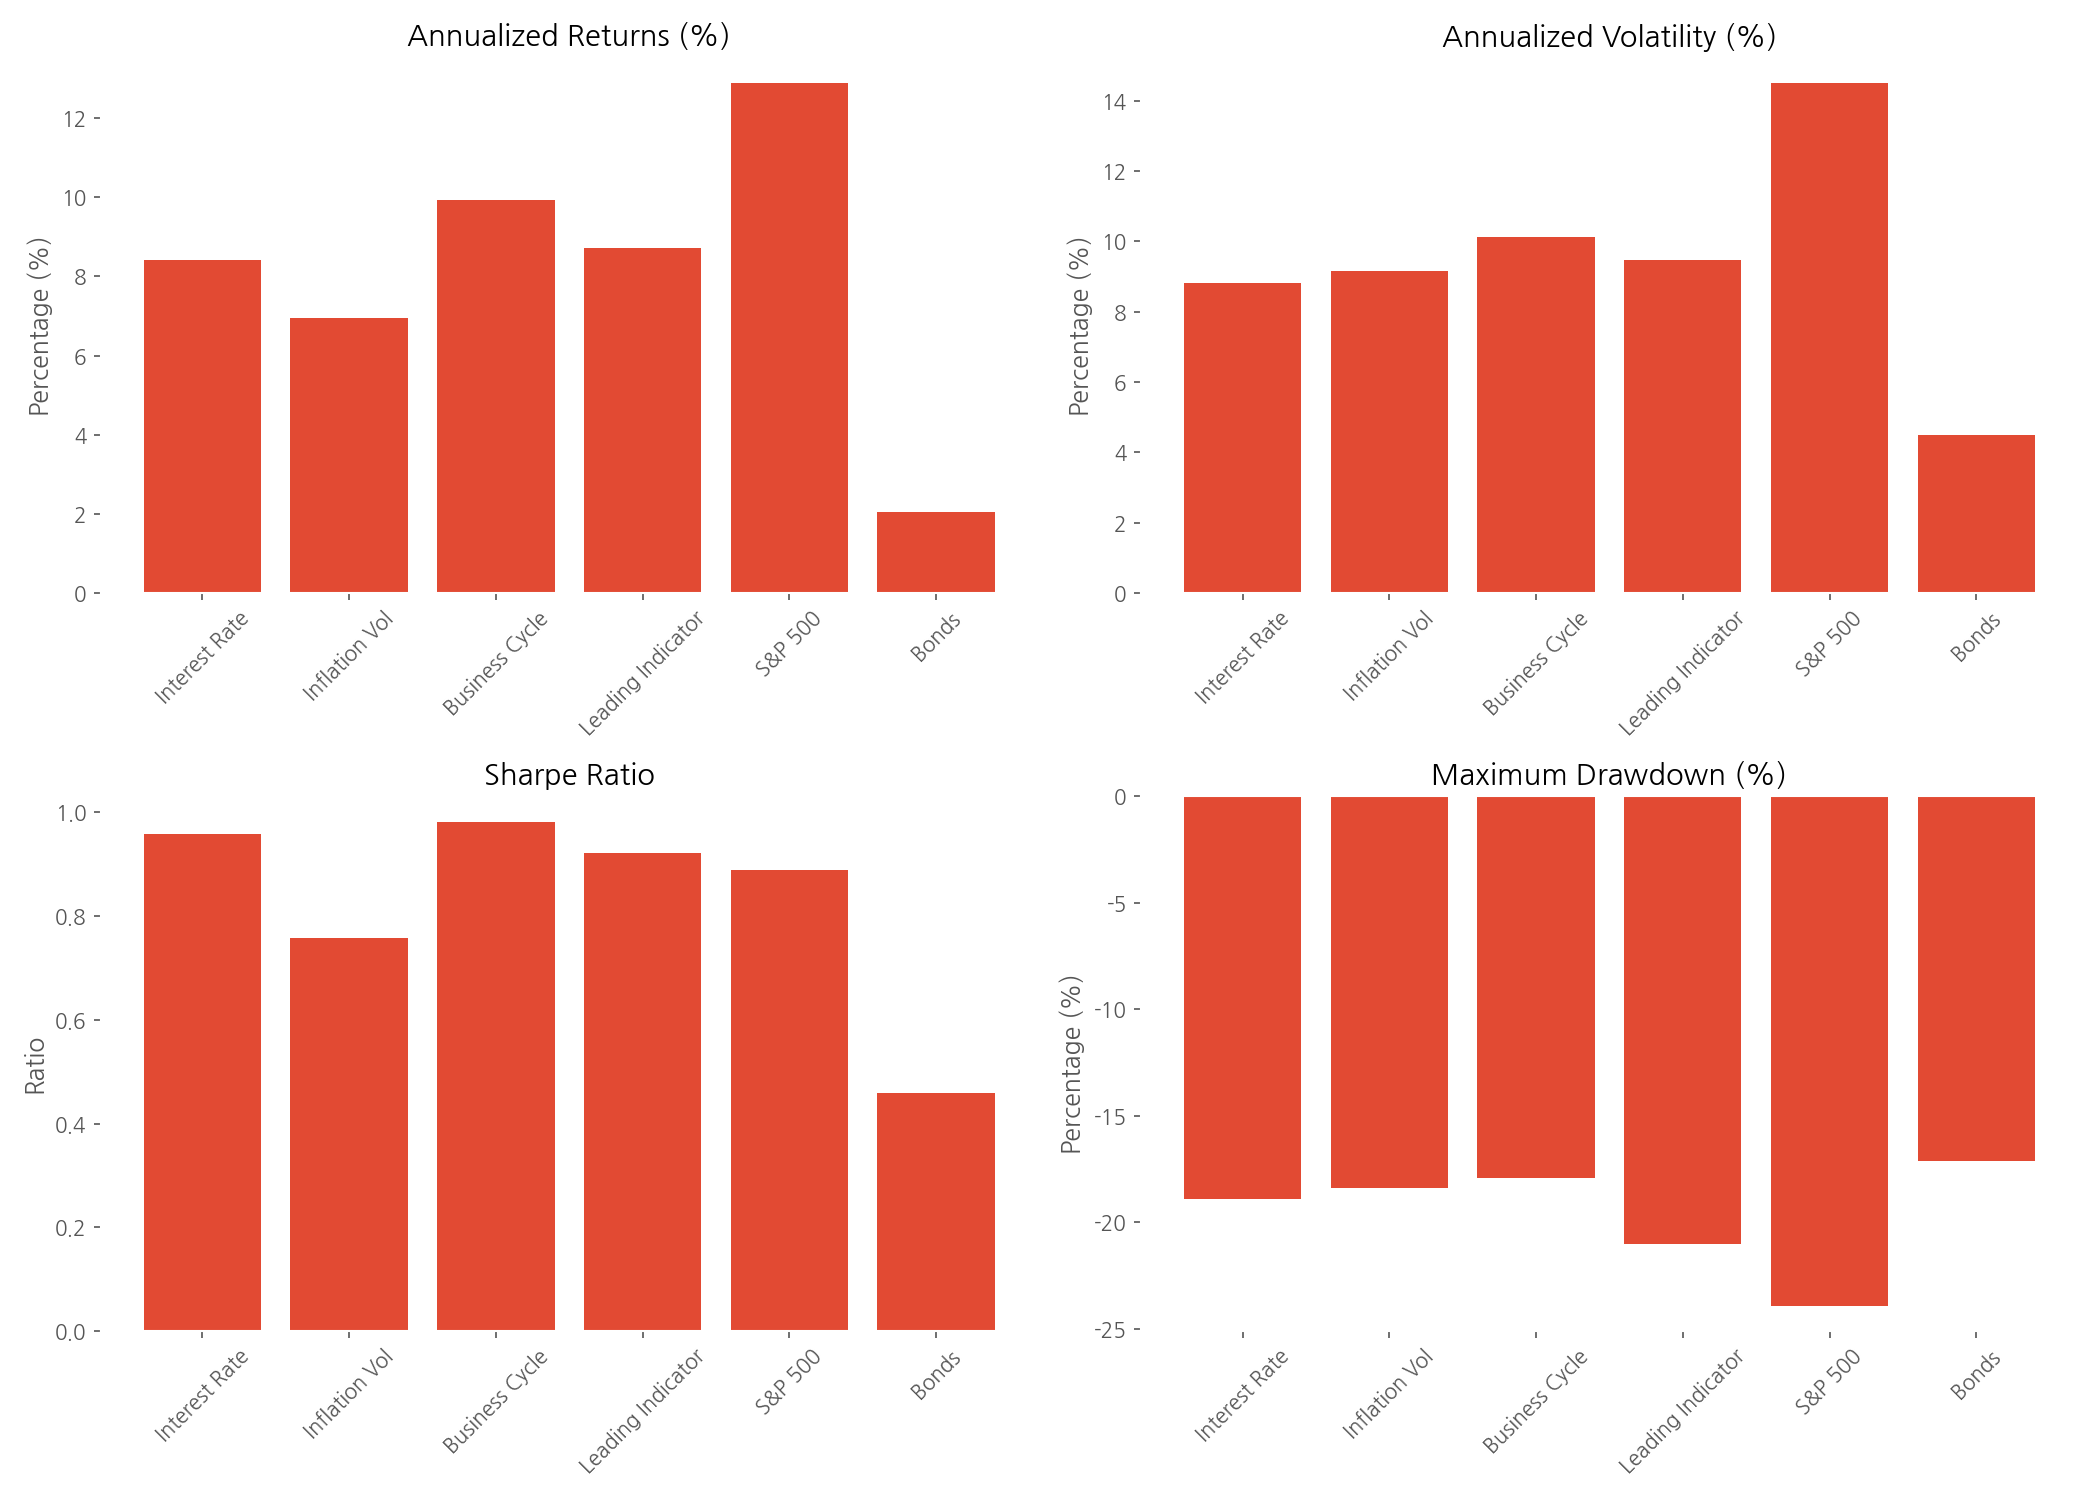
- The Business Cycle Strategy using unemployment data delivered the best overall performance with a total return of 242.05% and the highest Sharpe ratio of 0.98.
- All four strategies successfully reduced volatility by 30-40% compared to the S&P 500.
- Maximum drawdowns were significantly reduced across all strategies, with the Business Cycle Strategy achieving the smallest drawdown at -17.91%.
- While the S&P 500 delivered higher absolute returns (382.57%), all economic indicator strategies provided better risk-adjusted performance.
- The Interest Rate Strategy had the lowest volatility at 8.80%, making it potentially suitable for more risk-averse investors.
Conclusion
Our data-driven exploration reveals that economic indicators can indeed provide valuable signals for portfolio management. While none of the strategies outperformed the S&P 500 in absolute returns during this predominantly bull market period, they all delivered superior risk-adjusted performance with significantly lower volatility and reduced drawdowns.
The Business Cycle Strategy using unemployment rate trends emerged as the most effective approach, combining strong returns with excellent risk management characteristics. This suggests that labor market data may be particularly valuable for portfolio allocation decisions.
Perhaps most importantly, these strategies demonstrate how publicly available economic data can be transformed into systematic investment approaches that remove emotion and guesswork from the equation. Rather than attempting to predict market movements or time entries and exits perfectly, these approaches provide clear, rules-based frameworks for adjusting allocations based on observable economic conditions.
For investors seeking to enhance their portfolio management approach, these strategies offer compelling alternatives to static allocations or purely market-driven approaches. By incorporating top-down economic views into bottom-up asset allocation decisions, investors may be able to achieve more stable returns while still participating in market growth opportunities.
The next time economic data makes headlines, consider how it might be systematically incorporated into your investment approach rather than simply reacting to the news. As our analysis shows, the signals have been hiding in plain sight all along.
Comments (0)
No comments yet. Be the first to comment!