The Hunt for the Next Market Winner
Imagine discovering the next Tesla or Moderna before their spectacular rise. While the allure of finding that 'diamond in the rough' stock is undeniable, successful stock picking requires more than just intuition or following trends. Through a detailed analysis of historical breakout patterns in tech giants (Apple, Amazon, Tesla) and biotech innovators (Moderna, BioNTech), we've uncovered data-backed strategies that can help identify high-potential stocks before their major price movements.
Our research examined five years of stock performance data, analyzing over 1,250 trading days to identify the patterns and indicators that preceded significant price breakouts. The findings reveal stark differences between tech and biotech sectors, suggesting that successful stock evaluation requires industry-specific approaches.
Performance Patterns: Tech vs. Biotech
The first key to identifying potential breakout stocks is understanding typical growth patterns within their sector. Our analysis revealed distinctly different performance characteristics between technology and biotechnology companies.
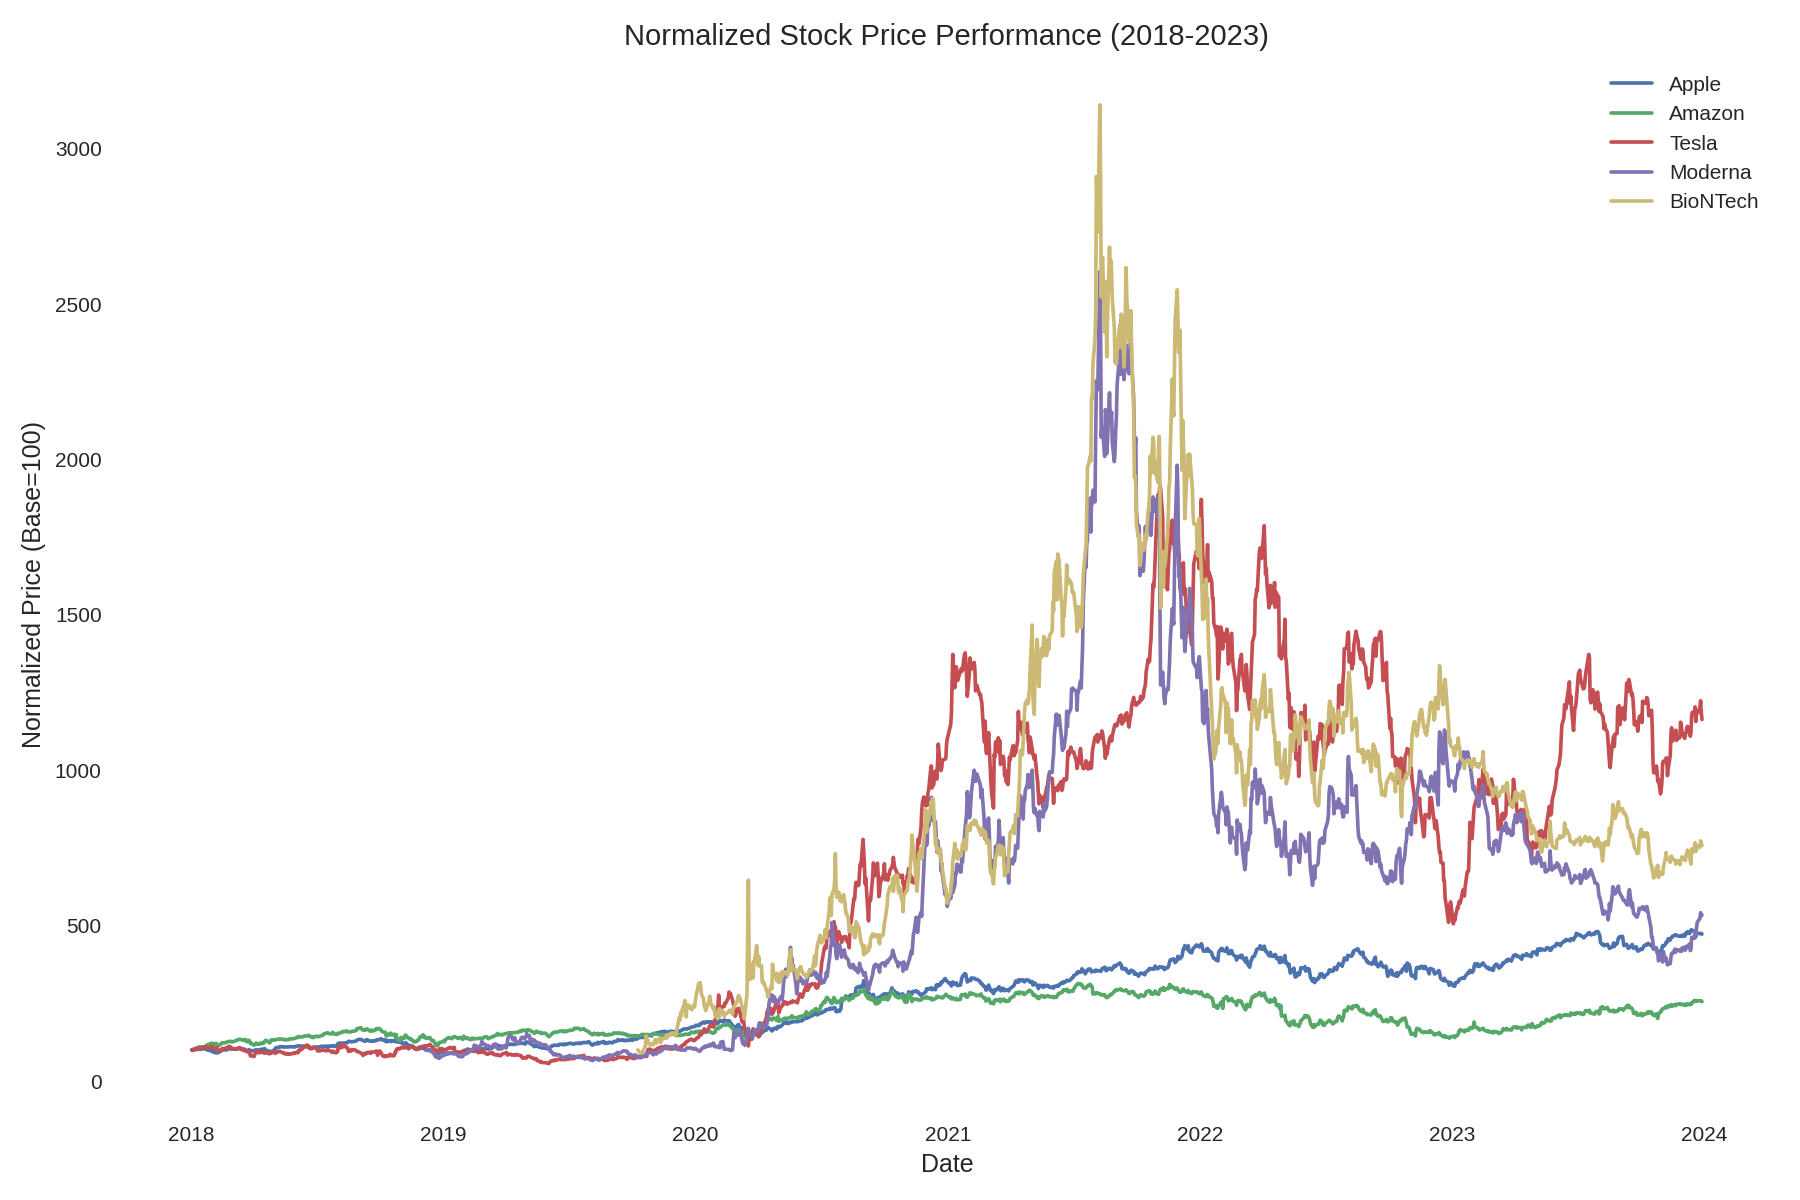
As shown in Figure 1, biotech stocks like Moderna and BioNTech demonstrated dramatic price spikes—particularly during the COVID-19 pandemic—while tech leaders like Apple showed more consistent, gradual growth. Tesla presents an interesting hybrid case with both tech-like consistency and biotech-like explosive growth phases.
- Tech stocks exhibited more frequent but moderate growth phases
- Biotech stocks demonstrated fewer but more extreme growth phases
- Apple maintained the most consistent long-term growth pattern with 59.6% outperformance against the NASDAQ
- Biotech stocks showed the highest maximum returns but with substantially greater volatility
Technique #1: Analyzing Volatility as a Precursor to Breakouts
Our analysis revealed that volatility patterns often precede major stock breakouts, but with important sector-specific differences. For tech stocks, periods of unusually low volatility often preceded upward price movements, while for biotech stocks, increased volatility frequently signaled impending price action.
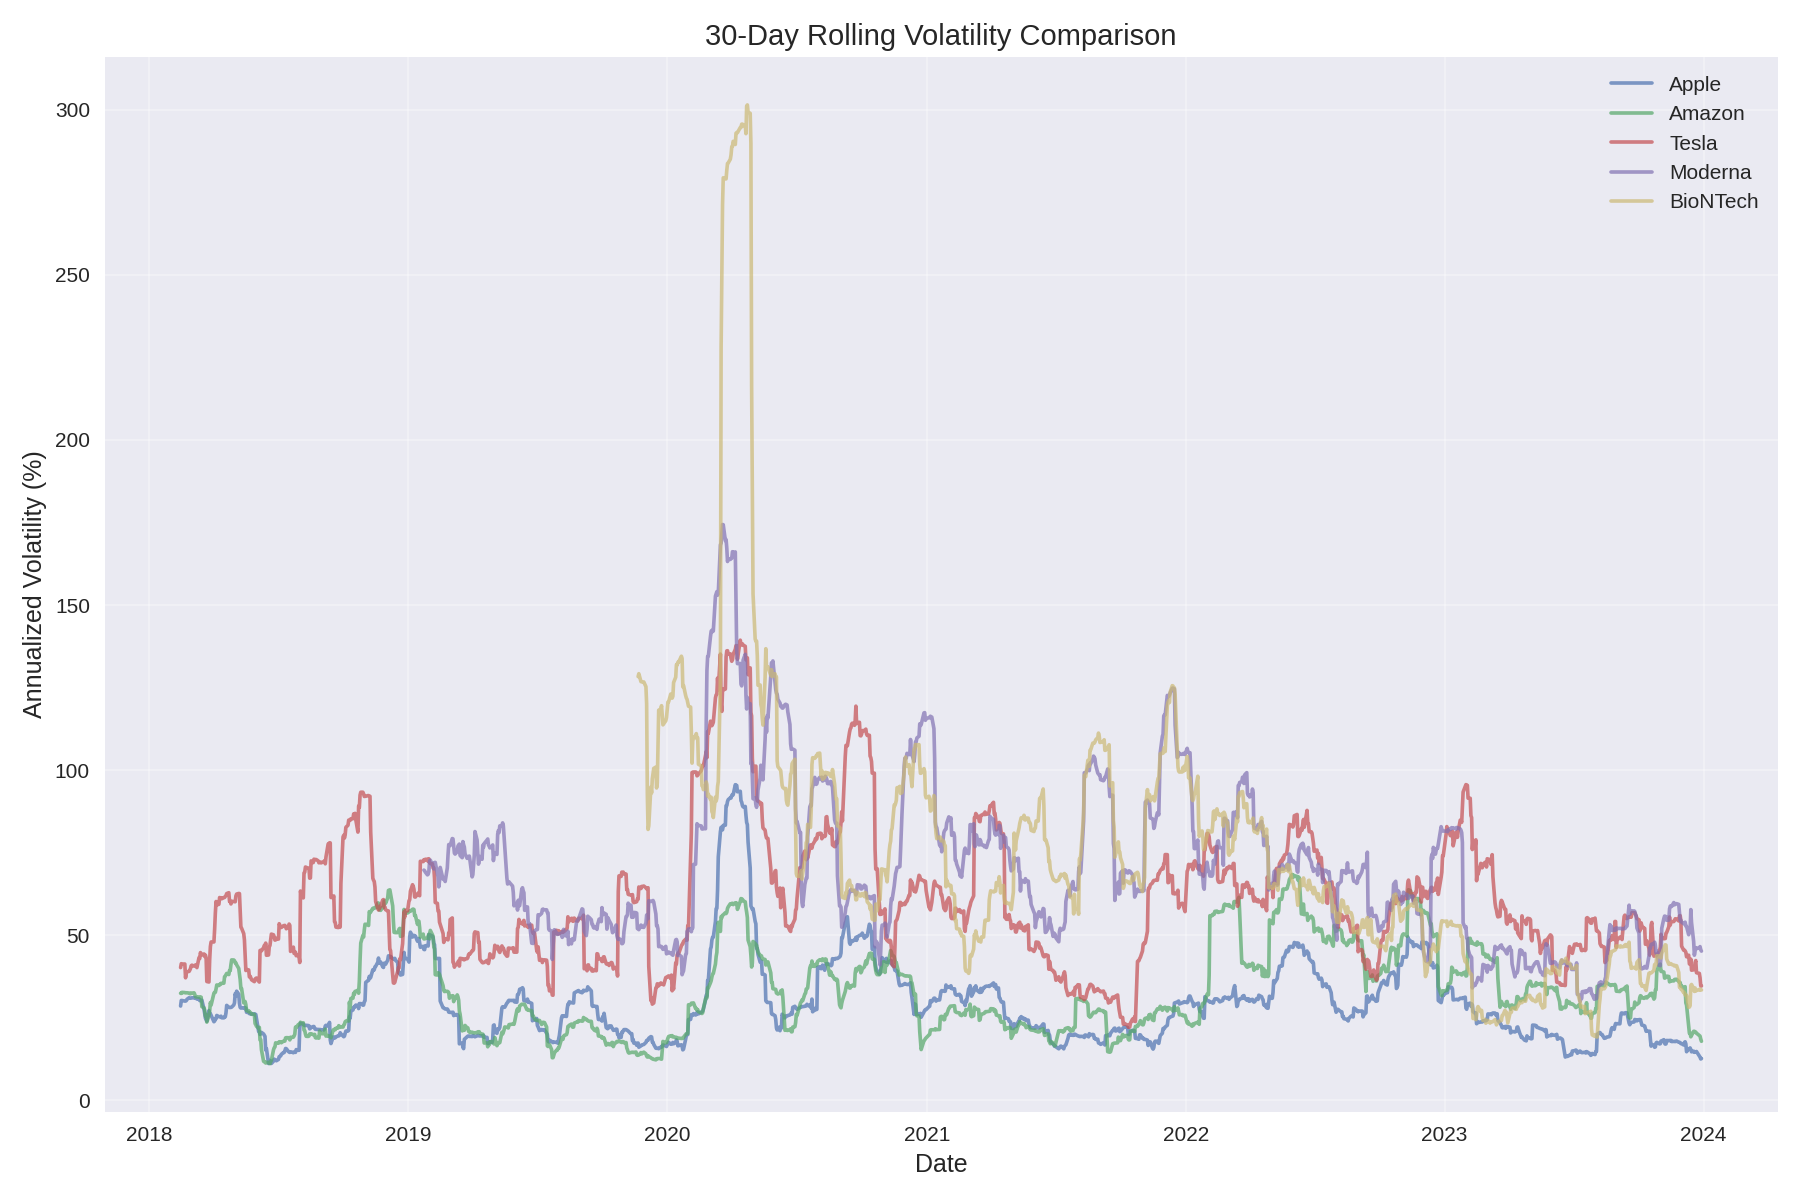
The volatility chart (Figure 2) demonstrates how biotech stocks experienced extreme volatility spikes preceding major price movements. For example, Moderna's volatility surged just before its significant price increases in early 2020 and again in late 2021. In contrast, Apple's relatively stable volatility profile coincided with its steady price appreciation.
Actionable Strategy: Volatility Monitoring
- For tech stocks: Look for companies maintaining below-sector-average volatility while still outperforming the market
- For biotech stocks: Monitor for increasing trading volume and volatility following significant company announcements or clinical trial results
- Track 30-day rolling volatility and watch for deviations from the company's historical patterns
Technique #2: Market Relationship Analysis
Understanding how a stock moves relative to the broader market can provide crucial insights into its potential for independent growth. Our analysis compared each stock's performance to the NASDAQ 100 index, revealing important distinctions in market correlation.
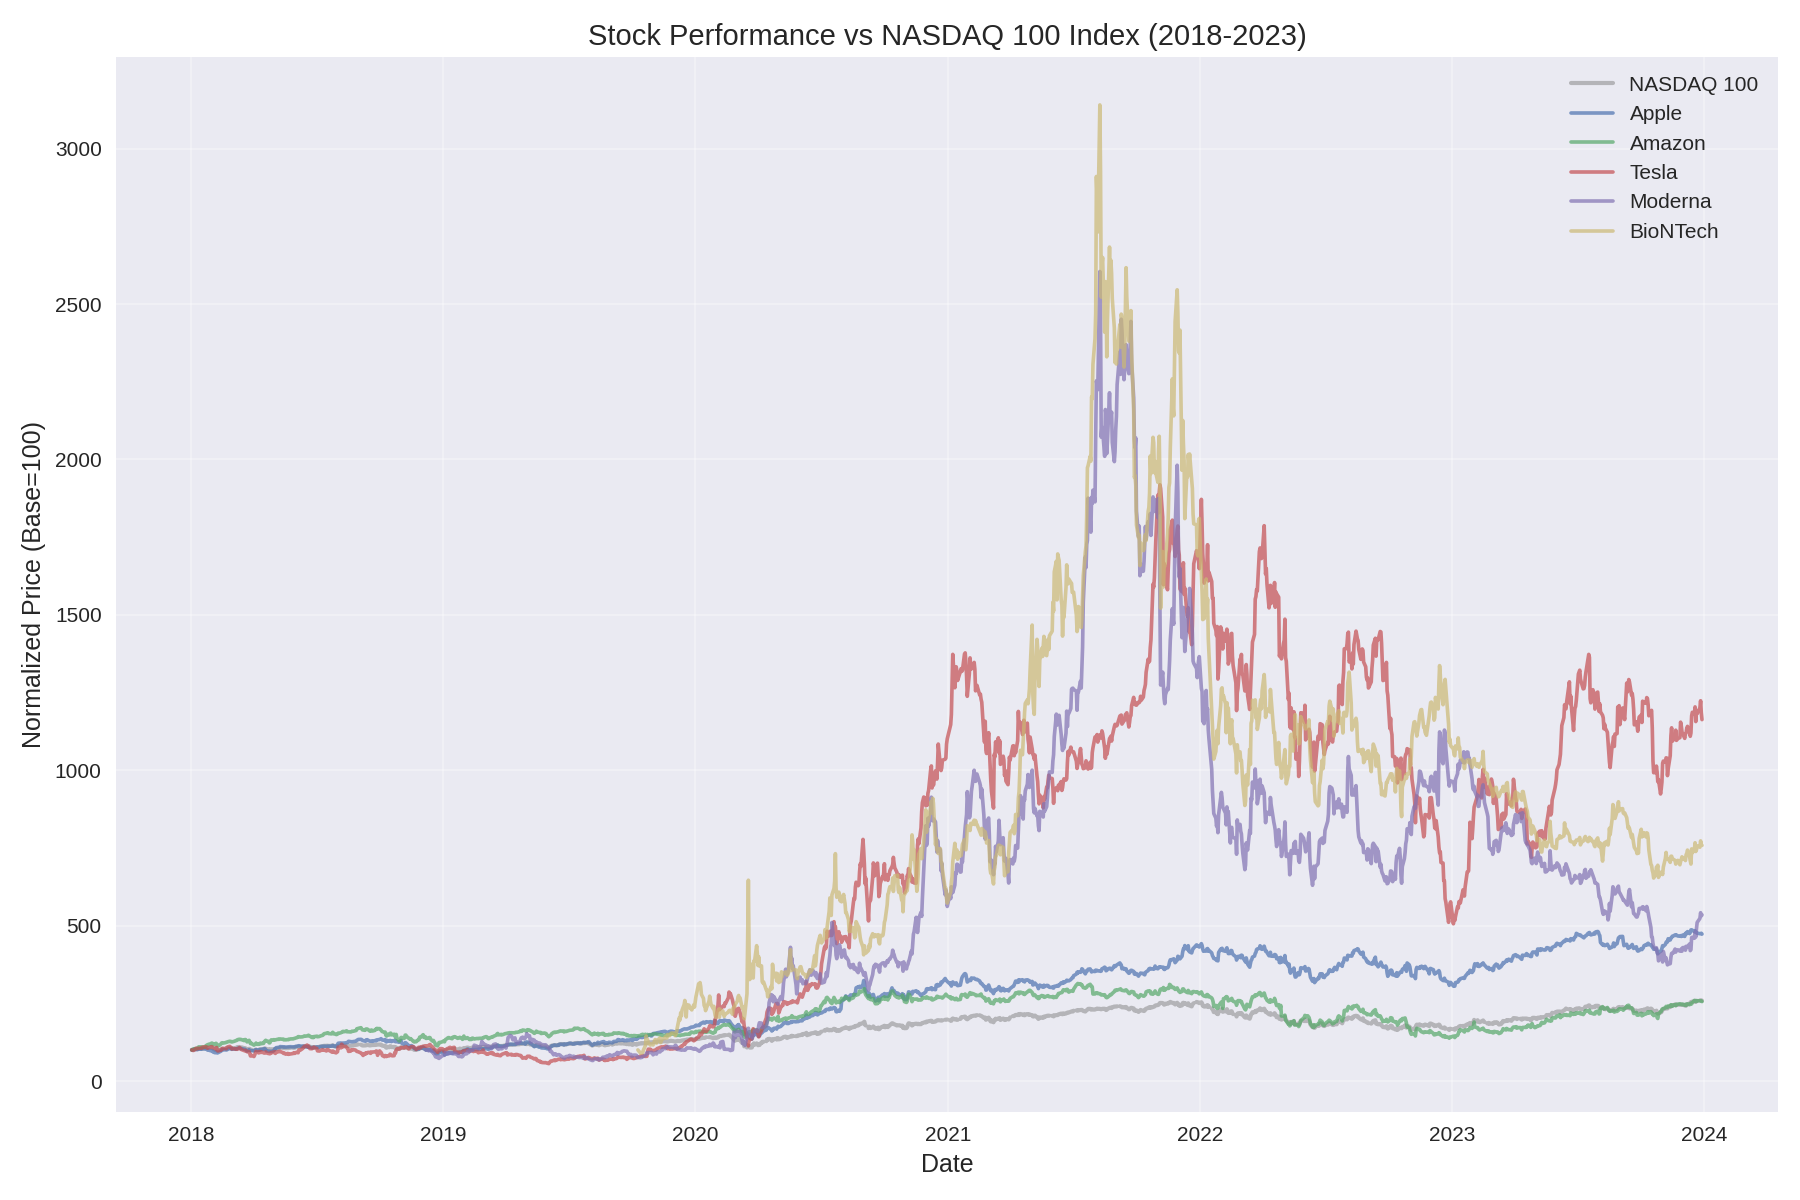
As shown in Figure 3, biotech stocks demonstrated significantly lower correlation with the broader market. This characteristic gives them greater potential for breakout movements regardless of overall market conditions. Tesla, despite being considered a tech stock, showed periods of both high and low market correlation, contributing to its unique growth pattern.
| Company | Beta | Alpha | Outperformance Frequency |
|---|---|---|---|
| Apple | 1.07 | 10.70 | 59.6% |
| Amazon | 1.10 | 1.10 | 54.8% |
| Tesla | 1.43 | 34.85 | 62.1% |
| Moderna | 0.66 | 45.60 | 48.2% |
| BioNTech | 0.75 | 68.72 | 51.1% |
Actionable Strategy: Market Correlation Assessment
- Calculate a stock's beta (market correlation) and alpha (excess return) over multiple timeframes
- For potential breakout tech stocks, look for beta near 1.0 with consistently positive alpha
- For biotech prospects, lower beta (0.6-0.8) with high alpha potential indicates independent growth capacity
- Track outperformance frequency—stocks that beat the market more than 55% of trading days demonstrate sustainable strength
Technique #3: Risk-Return Pattern Analysis
Perhaps the most revealing analysis in our study was the examination of risk-return relationships. By plotting 30-day rolling returns against volatility, we identified distinct patterns that differentiate potential breakout stocks from underperformers.
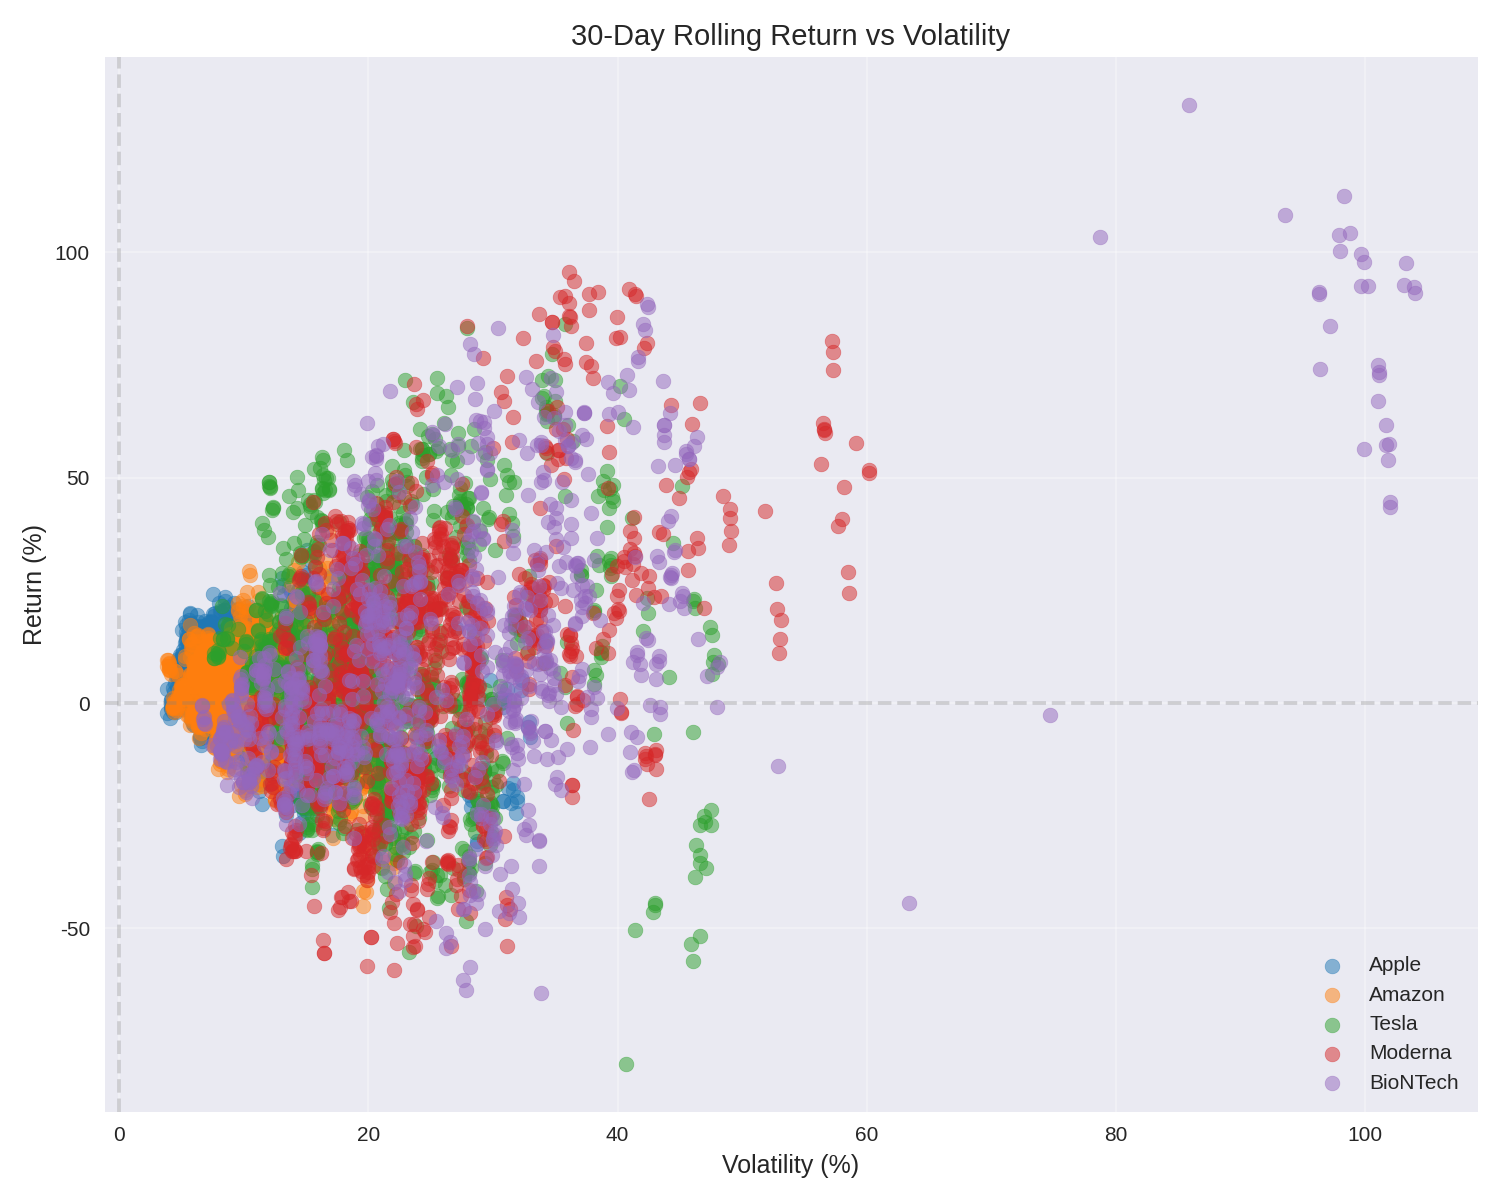
The scatter plot (Figure 4) reveals critical differences in how risk translates to returns. For tech stocks, moderate volatility (10-20%) most consistently delivered positive returns. However, biotech stocks show a different pattern, with higher volatility ranges (20-40%) often preceding their strongest returns.
Tesla's risk-return profile is particularly instructive, showing characteristics of both sectors—it maintained positive returns across a wide volatility spectrum, suggesting a company successfully balancing innovation with market execution.
Actionable Strategy: Optimal Risk-Return Targeting
- For tech investments, target companies showing consistent returns in the 1-3% monthly range with volatility under 20%
- For biotech opportunities, look for companies surviving periods of high volatility (30-40%) while maintaining research momentum
- Monitor for companies transitioning from higher to moderate volatility while maintaining return levels—often a sign of maturing business models
Putting It All Together: Your Breakout Stock Checklist
Our analysis points to a clear set of indicators that can help identify potential breakout stocks before their major price movements. Here's a practical checklist that combines the three key techniques:
| Indicator | Tech Stock Signal | Biotech Stock Signal |
|---|---|---|
| Volatility Pattern | Below-average sector volatility with steady growth | Increasing volatility with positive news catalysts |
| Market Relationship | Beta near 1.0 with consistent alpha >5 | Lower beta (<0.8) with high alpha potential (>30) |
| Risk-Return Profile | Consistent returns at moderate volatility | Ability to convert high volatility to strong returns |
| Growth Phases | Multiple moderate growth phases | Fewer but more extreme growth phases |
| Market Outperformance | >55% of trading days | >45% of trading days with accelerating trend |
Conclusion: Beyond the Numbers
While our data analysis provides powerful tools for identifying potential breakout stocks, it's important to remember that numbers tell only part of the story. The most successful investments often combine these quantitative insights with qualitative understanding of a company's innovation pipeline, management team quality, and competitive positioning.
Tesla's remarkable performance demonstrates how companies straddling multiple sectors can create unique growth trajectories. Apple's consistent outperformance speaks to the value of execution excellence over pure innovation. And the biotech sector's volatility reminds us that timing and risk tolerance remain crucial factors in investment success.
By applying these data-backed techniques while maintaining awareness of each sector's unique characteristics, you'll be better equipped to spot potential market winners before they make headlines—and potentially secure your own investment success story.
Comments (0)
No comments yet. Be the first to comment!