Introduction: Beyond P/E Ratios
In the complex world of stock valuation, investors are constantly searching for the perfect metric—one that cuts through accounting noise, works across different sectors, and reliably identifies undervalued opportunities. While the Price-to-Earnings (P/E) ratio remains the go-to valuation tool for many, sophisticated investors have increasingly turned to EV/EBITDA as a more comprehensive alternative.
This blog investigates the EV/EBITDA ratio using real financial data from 10 major companies across Technology, Healthcare, and Industrial sectors. Through Python analysis and data visualization, we'll explore whether this metric lives up to its reputation as a 'better mousetrap' for stock valuation—and more importantly, whether it can help you make smarter investment decisions.
What is EV/EBITDA? Breaking Down the Formula
Before diving into our analysis, let's demystify what EV/EBITDA actually measures. The ratio consists of two key components:
Enterprise Value (EV)
Enterprise Value represents the total value of a company, calculated as:
EV = Market Capitalization + Total Debt - Cash and Cash Equivalents
Unlike market capitalization alone, EV accounts for a company's debt obligations and cash reserves, providing a more complete picture of a company's true value. Think of it as the theoretical takeover price—what it would cost to buy the entire business and assume all its obligations.
EBITDA
EBITDA stands for Earnings Before Interest, Taxes, Depreciation, and Amortization. It's a measure of a company's operating performance before accounting for non-operational expenses.
By removing interest, taxes, depreciation, and amortization from the equation, EBITDA provides a cleaner look at a company's operational profitability and cash flow generation capability. It helps investors compare companies with different capital structures, tax situations, and depreciation policies.
Why Use EV/EBITDA? Real-World Applications
The EV/EBITDA ratio has gained popularity among professional investors for several compelling reasons:
- Capital-Structure Neutral: Unlike P/E, EV/EBITDA accounts for differences in debt levels between companies.
- Cross-Sector Comparability: The metric works well across different industries, making it valuable for diversified portfolios.
- M&A Analysis: It's the preferred metric in merger and acquisition scenarios, as it represents the true cost of acquiring a business.
- Less Susceptible to Accounting Manipulations: By focusing on operational performance, it's harder to distort through accounting practices.
Private equity firms, investment banks, and value investors particularly favor EV/EBITDA because it provides a more holistic view of valuation. Warren Buffett's business partner Charlie Munger once noted that EBITDA-based valuations are 'like asking someone the sales price of a piece of property and being told the asking price is $1 million and we're not counting the mortgage.'
Data Collection and Methodology
For our analysis, we collected financial data for 10 major companies across three sectors:
- Technology: Apple (AAPL), Microsoft (MSFT), Alphabet (GOOGL), Amazon (AMZN)
- Healthcare: Johnson & Johnson (JNJ), Pfizer (PFE), UnitedHealth Group (UNH)
- Industrials: General Electric (GE), Caterpillar (CAT), Boeing (BA)
Using financial data APIs, we gathered the following metrics for each company:
- Market Capitalization
- Total Debt
- Cash and Cash Equivalents
- EBITDA
- Additional metrics: P/E ratio, Price-to-Book ratio, and 1-year stock returns
We calculated the EV/EBITDA ratio for each company and performed various analyses to understand patterns, correlations, and investment implications. One company (Boeing) was found to have negative EBITDA, which resulted in a negative EV/EBITDA ratio that we excluded from certain analyses.
EV/EBITDA Across Companies and Sectors
Our analysis revealed significant variations in EV/EBITDA ratios across companies and sectors. The chart below shows the EV/EBITDA ratios for our sample companies:
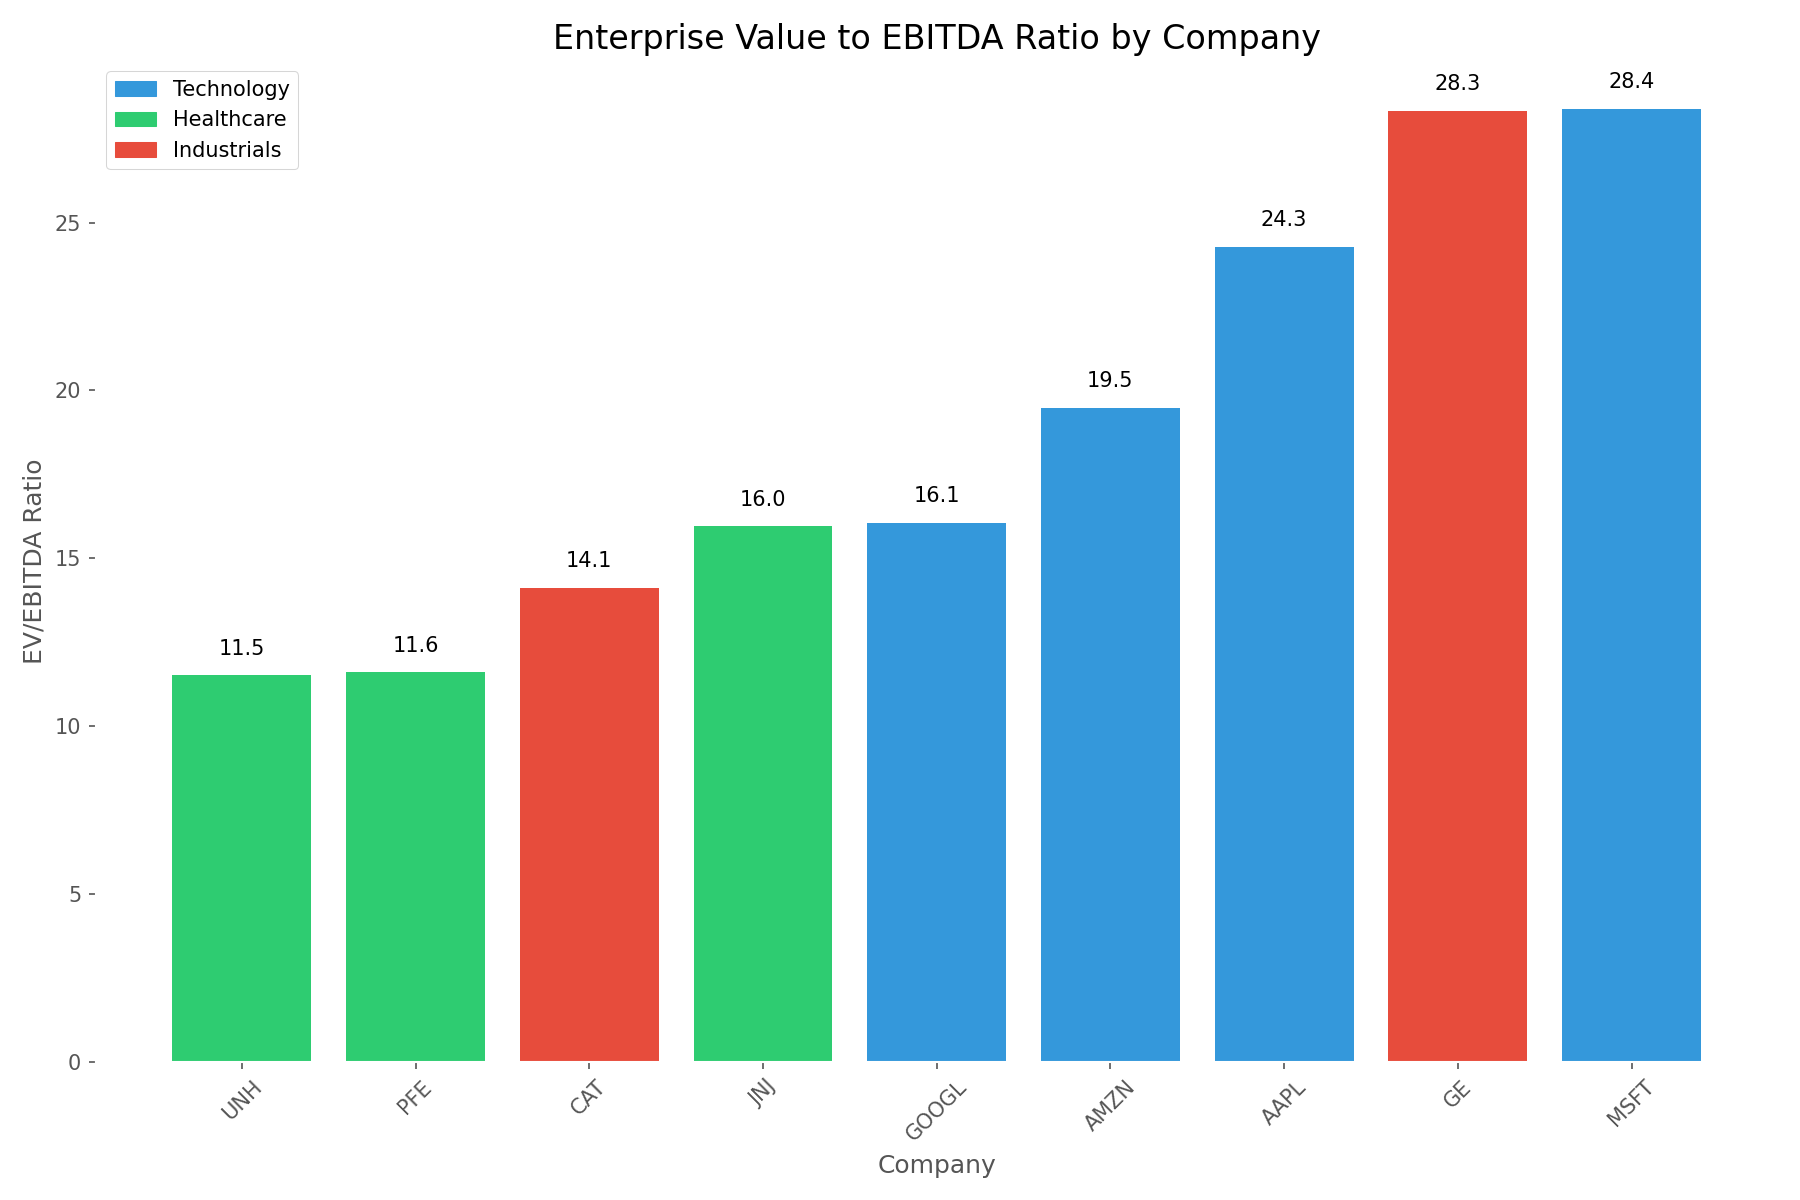
The data reveals several interesting patterns:
- Healthcare companies (PFE, UNH, JNJ) have the lowest EV/EBITDA ratios, ranging from 7.86 to 12.69.
- Technology companies show a wider range, from 15.27 (GOOGL) to 24.95 (MSFT).
- Industrial companies display the widest variation, with CAT at 14.79 and GE at 28.93 (Boeing excluded due to negative EBITDA).
These differences become even more apparent when we examine the distribution by sector:
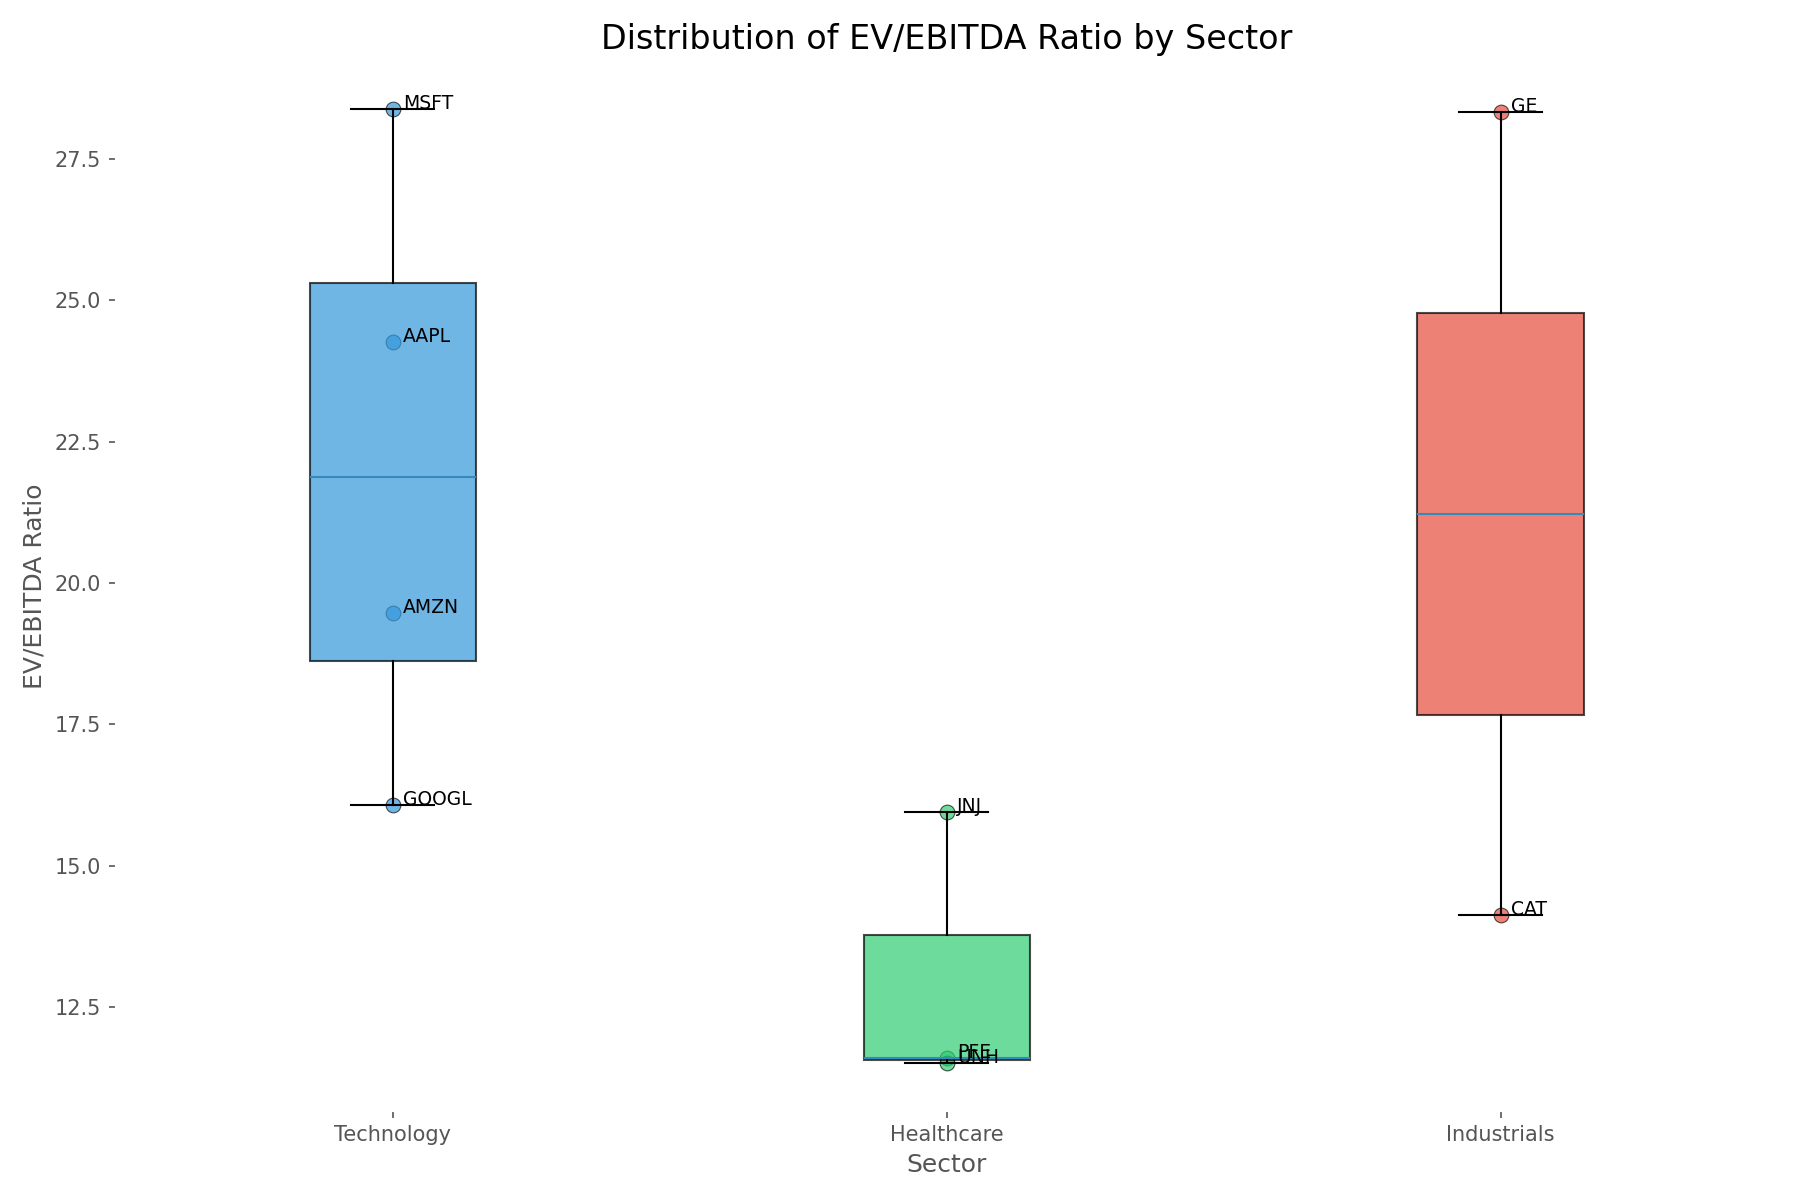
Sector-Specific Insights
Our sector analysis reveals distinct valuation patterns that smart investors should consider:
Healthcare
Healthcare companies in our sample trade at the lowest average EV/EBITDA ratio (9.98). This sector shows the most consistent valuations, with a tight clustering between 7.86 and 12.69. This suggests that Healthcare companies may be more attractively valued compared to other sectors, possibly reflecting lower growth expectations or higher regulatory risks.
Technology
Technology companies command premium valuations with an average EV/EBITDA of 20.40. The sector shows two distinct clusters: GOOGL and AMZN with lower ratios (15-19) and AAPL and MSFT with higher ratios (22-25). These premium valuations likely reflect higher growth expectations and the sector's dominant market position.
Industrials
Industrial companies show the widest variation in EV/EBITDA ratios. CAT trades at 14.79 while GE commands a premium multiple of 28.93. Boeing's negative EBITDA (-24.74) highlights a key limitation of this metric—it cannot properly value companies with negative earnings. This wide dispersion suggests that company-specific factors may play a larger role in Industrial valuations.
EV/EBITDA and Stock Performance: Is There a Connection?
A critical question for investors: Does a company's EV/EBITDA ratio predict its stock performance? To answer this, we analyzed the relationship between EV/EBITDA ratios and 1-year stock returns:
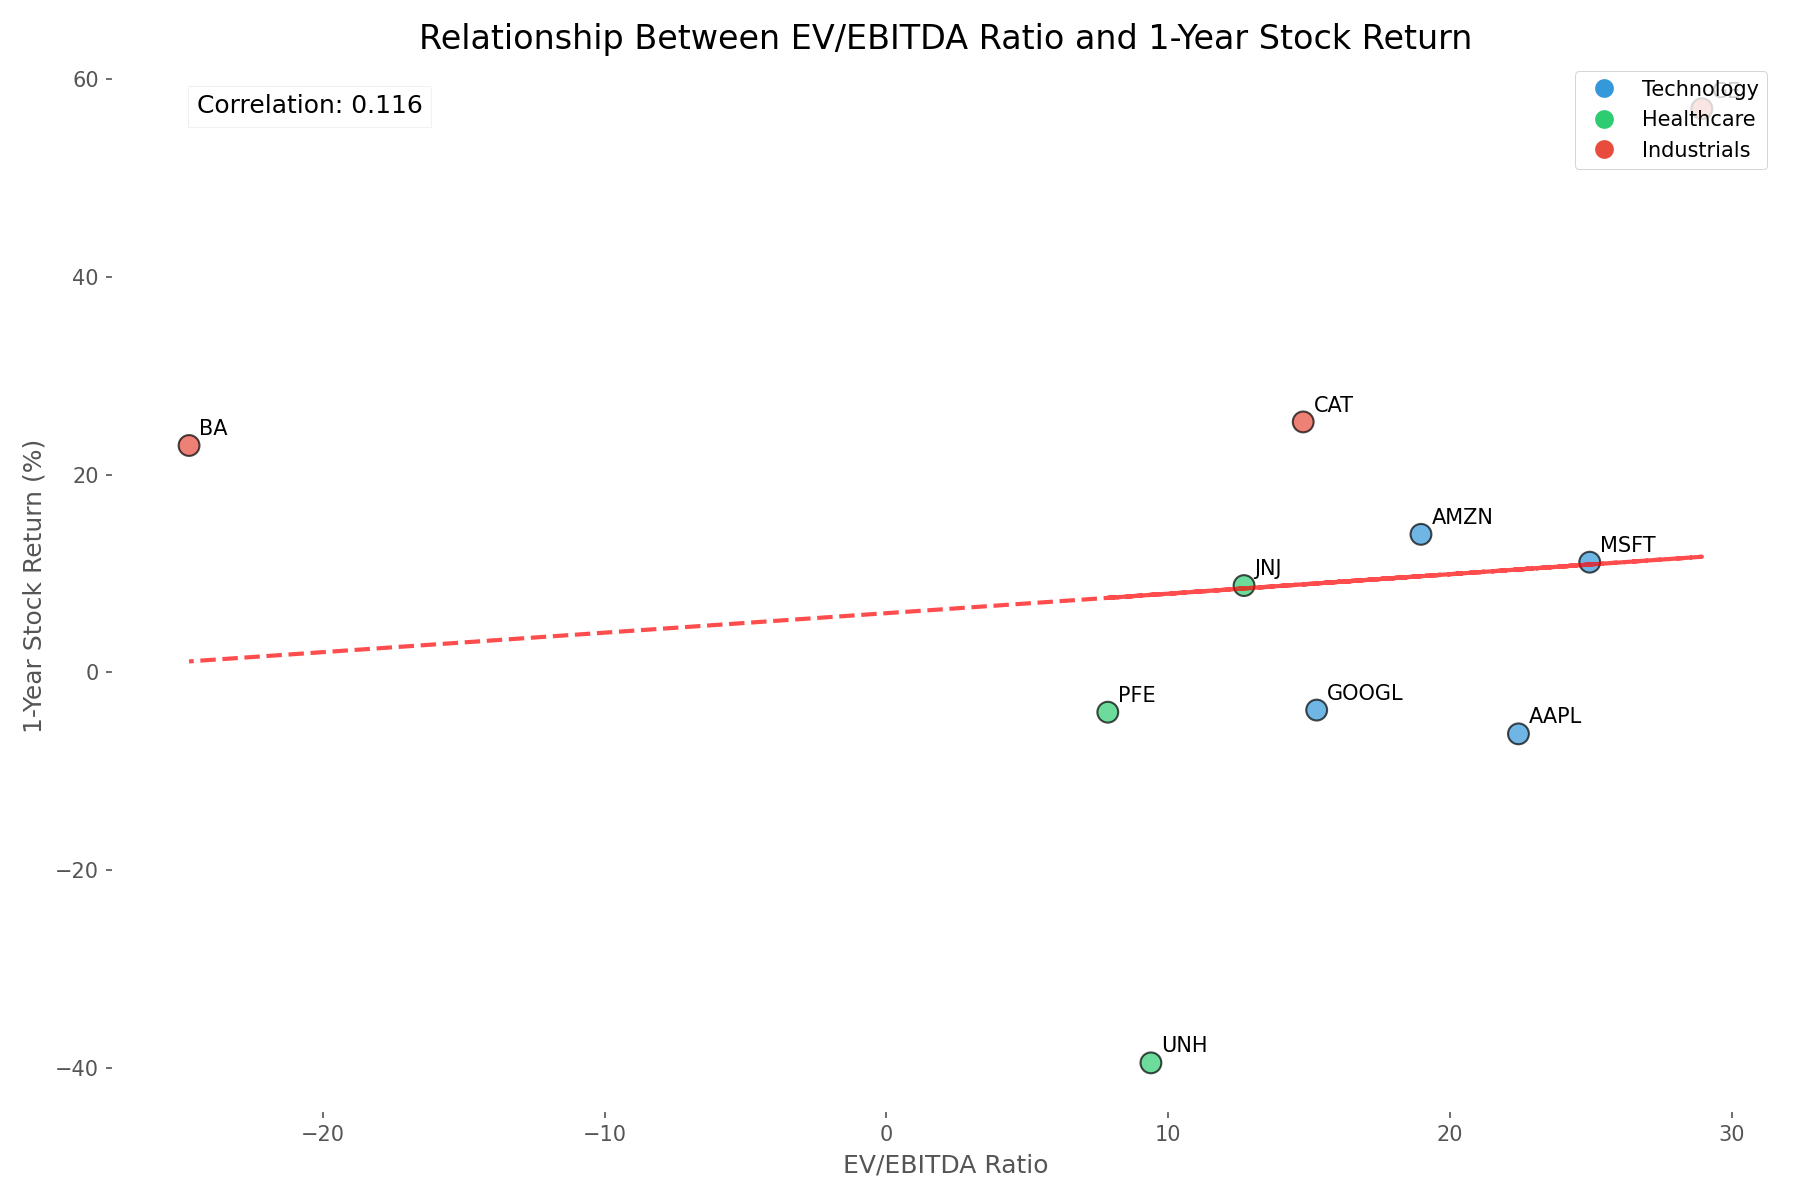
Our analysis found a weak positive correlation of 0.12 between EV/EBITDA ratios and 1-year stock returns. This suggests that while there is a slight tendency for companies with higher EV/EBITDA ratios to outperform, the relationship is not strong enough to use this metric as a standalone predictor of short-term performance.
Some notable observations from our data:
- GE had both the highest EV/EBITDA ratio (28.93) and the highest 1-year return (56.99%).
- UNH had a low EV/EBITDA ratio (9.38) but the worst 1-year return (-39.49%).
- Boeing had a negative EV/EBITDA due to negative EBITDA, yet delivered a positive 1-year return (22.94%).
These examples highlight that stock performance is influenced by many factors beyond valuation metrics, including company-specific developments, sector trends, and broader market conditions.
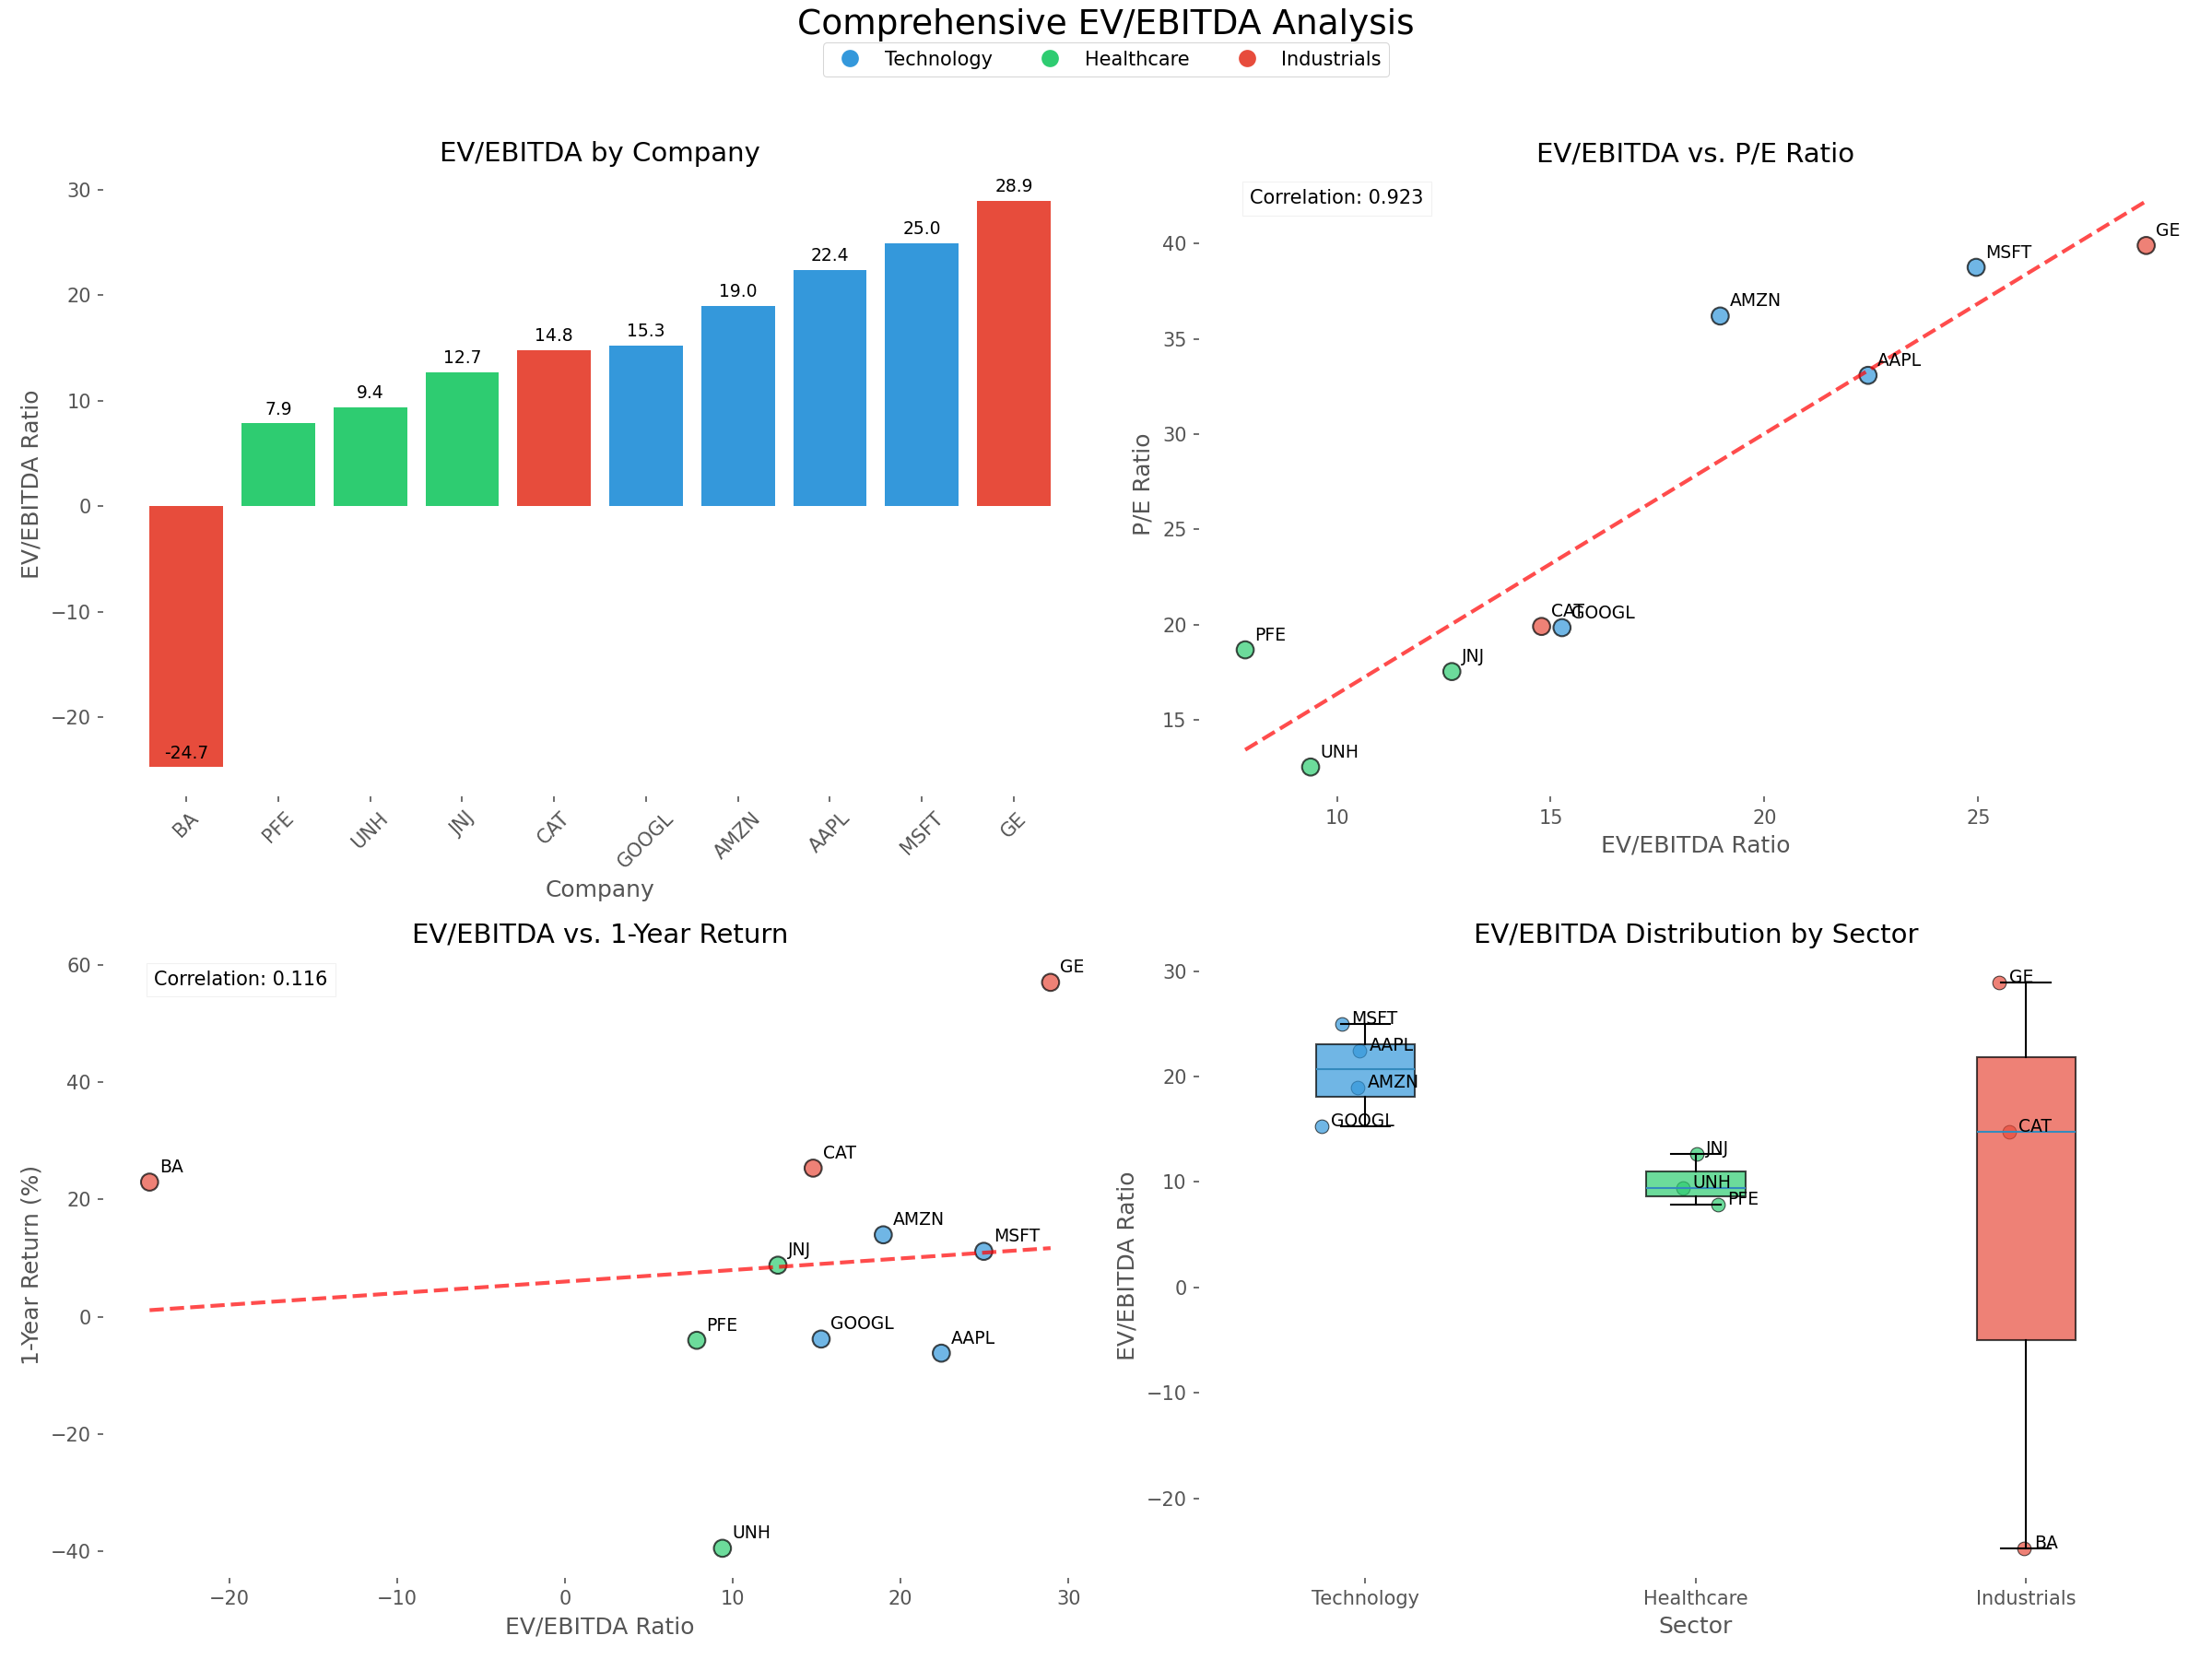
EV/EBITDA vs. Other Valuation Metrics
How does EV/EBITDA compare to other popular valuation metrics? Our correlation analysis revealed:
- Strong positive correlation (0.92) between EV/EBITDA and P/E ratio
- Moderate positive correlation (0.51) between EV/EBITDA and Price-to-Book ratio
- Very strong positive correlation (0.91) between EV/EBITDA and EV/Revenue
The strong correlation with P/E ratio suggests that both metrics capture similar aspects of valuation. However, EV/EBITDA offers additional insights by accounting for debt levels and capital structure differences that P/E ratios miss.
Limitations of EV/EBITDA
While EV/EBITDA offers valuable insights, our analysis also revealed several limitations:
- Cannot properly value companies with negative EBITDA (as seen with Boeing)
- Weak predictor of short-term stock performance on its own
- May not fully account for capital expenditure requirements that vary by industry
- Doesn't consider growth rates, which can justify higher multiples for certain companies
These limitations highlight why EV/EBITDA should be used as part of a comprehensive analysis framework rather than in isolation.
Actionable Takeaways for Smart Investors
Based on our data-driven analysis, here are key takeaways for incorporating EV/EBITDA into your investment strategy:
- Use EV/EBITDA for cross-sector comparisons, but be aware of sector-specific valuation norms (Healthcare typically lower, Technology higher).
- Consider EV/EBITDA alongside other metrics like P/E, Price-to-Book, and growth rates for a more complete picture.
- Be cautious with companies showing negative or unusually low EBITDA, as the ratio may not accurately reflect their value.
- Look for companies with EV/EBITDA ratios below their sector average as potential value opportunities, but verify with additional analysis.
- Don't rely on EV/EBITDA alone to predict short-term stock performance—our data shows the correlation is weak (0.12).
Conclusion: EV/EBITDA as Part of Your Investment Toolkit
Our data-driven analysis confirms that EV/EBITDA is a valuable metric that offers insights traditional P/E ratios might miss. It's particularly useful for comparing companies across different sectors and with varying capital structures. However, like any financial metric, it has limitations and should be used as part of a comprehensive analysis framework.
The significant sector variations we observed—with Healthcare companies trading at lower multiples (average 9.98) compared to Technology (20.40) and Industrials—highlight the importance of context when interpreting EV/EBITDA values. The weak correlation with short-term stock returns reminds us that valuation is just one factor influencing investment outcomes.
Smart investors should add EV/EBITDA to their analytical toolkit, using it alongside other metrics and qualitative assessments to identify potential investment opportunities. By understanding both the power and limitations of this metric, as revealed through our data analysis, you'll be better equipped to make informed investment decisions in today's complex market environment.
Comments (0)
No comments yet. Be the first to comment!