Introduction to Sentiment-Based Trading
When markets plummet, headlines scream about fear. When they soar, greed dominates the narrative. But can these emotional extremes actually serve as reliable trading signals? The Fear & Greed Index, popularized by CNN, attempts to quantify market sentiment through various indicators. While CNN's proprietary index isn't easily accessible for algorithmic trading, market veterans know there are excellent proxies available.
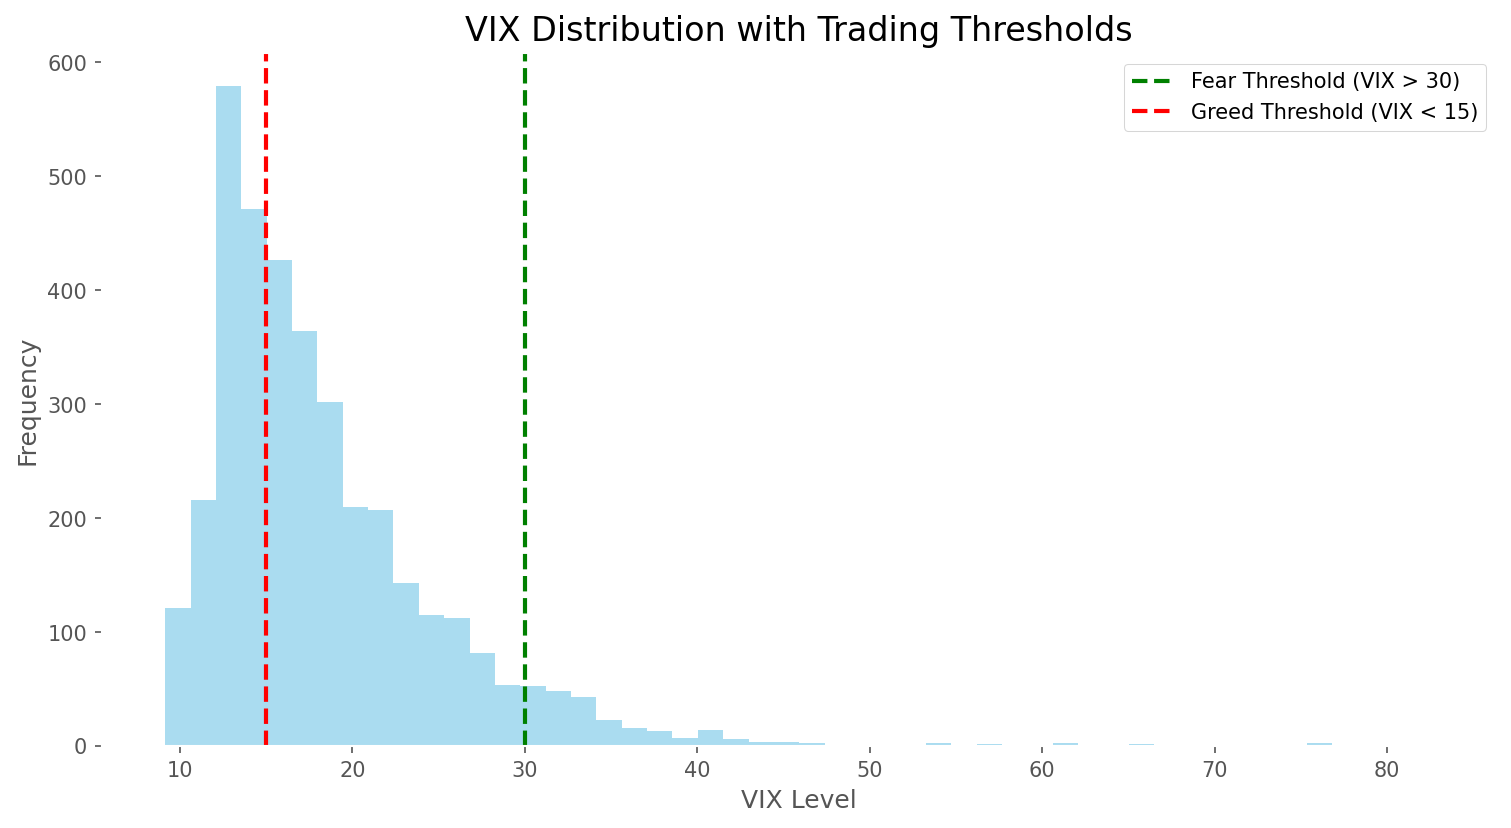
The CBOE Volatility Index (VIX) – often called the 'fear gauge' – spikes during market panic and subsides during complacency. Similarly, the Put/Call ratio rises when investors seek downside protection and falls when optimism prevails. These indicators potentially offer a contrarian edge: buy when others panic, sell when euphoria peaks. But does this approach actually work with real data? Let's find out by testing a VIX-based strategy on the S&P 500 ETF (SPY).
Strategy Logic and Setup
Our strategy follows a straightforward contrarian approach: buy SPY when the VIX exceeds 30 (extreme fear) and sell when it drops below 15 (extreme greed). This simple rule aims to capitalize on market overreactions, entering positions when pessimism peaks and exiting when optimism becomes excessive.
For our backtest, we used daily data from 2010 through mid-2024, starting with $10,000 capital. The strategy goes fully invested when buy signals trigger and completely to cash on sell signals. We assumed trades executed at the close price on signal days, with no transaction costs or dividends factored in.
Walkthrough of Sample Trades
The COVID-19 market crash provides a perfect case study for our strategy. On February 27, 2020, as pandemic fears gripped markets, the VIX spiked to 39.16. Our strategy triggered a buy signal with SPY at $297.51. While this wasn't the absolute bottom (which came weeks later), it represented significant fear in the market.
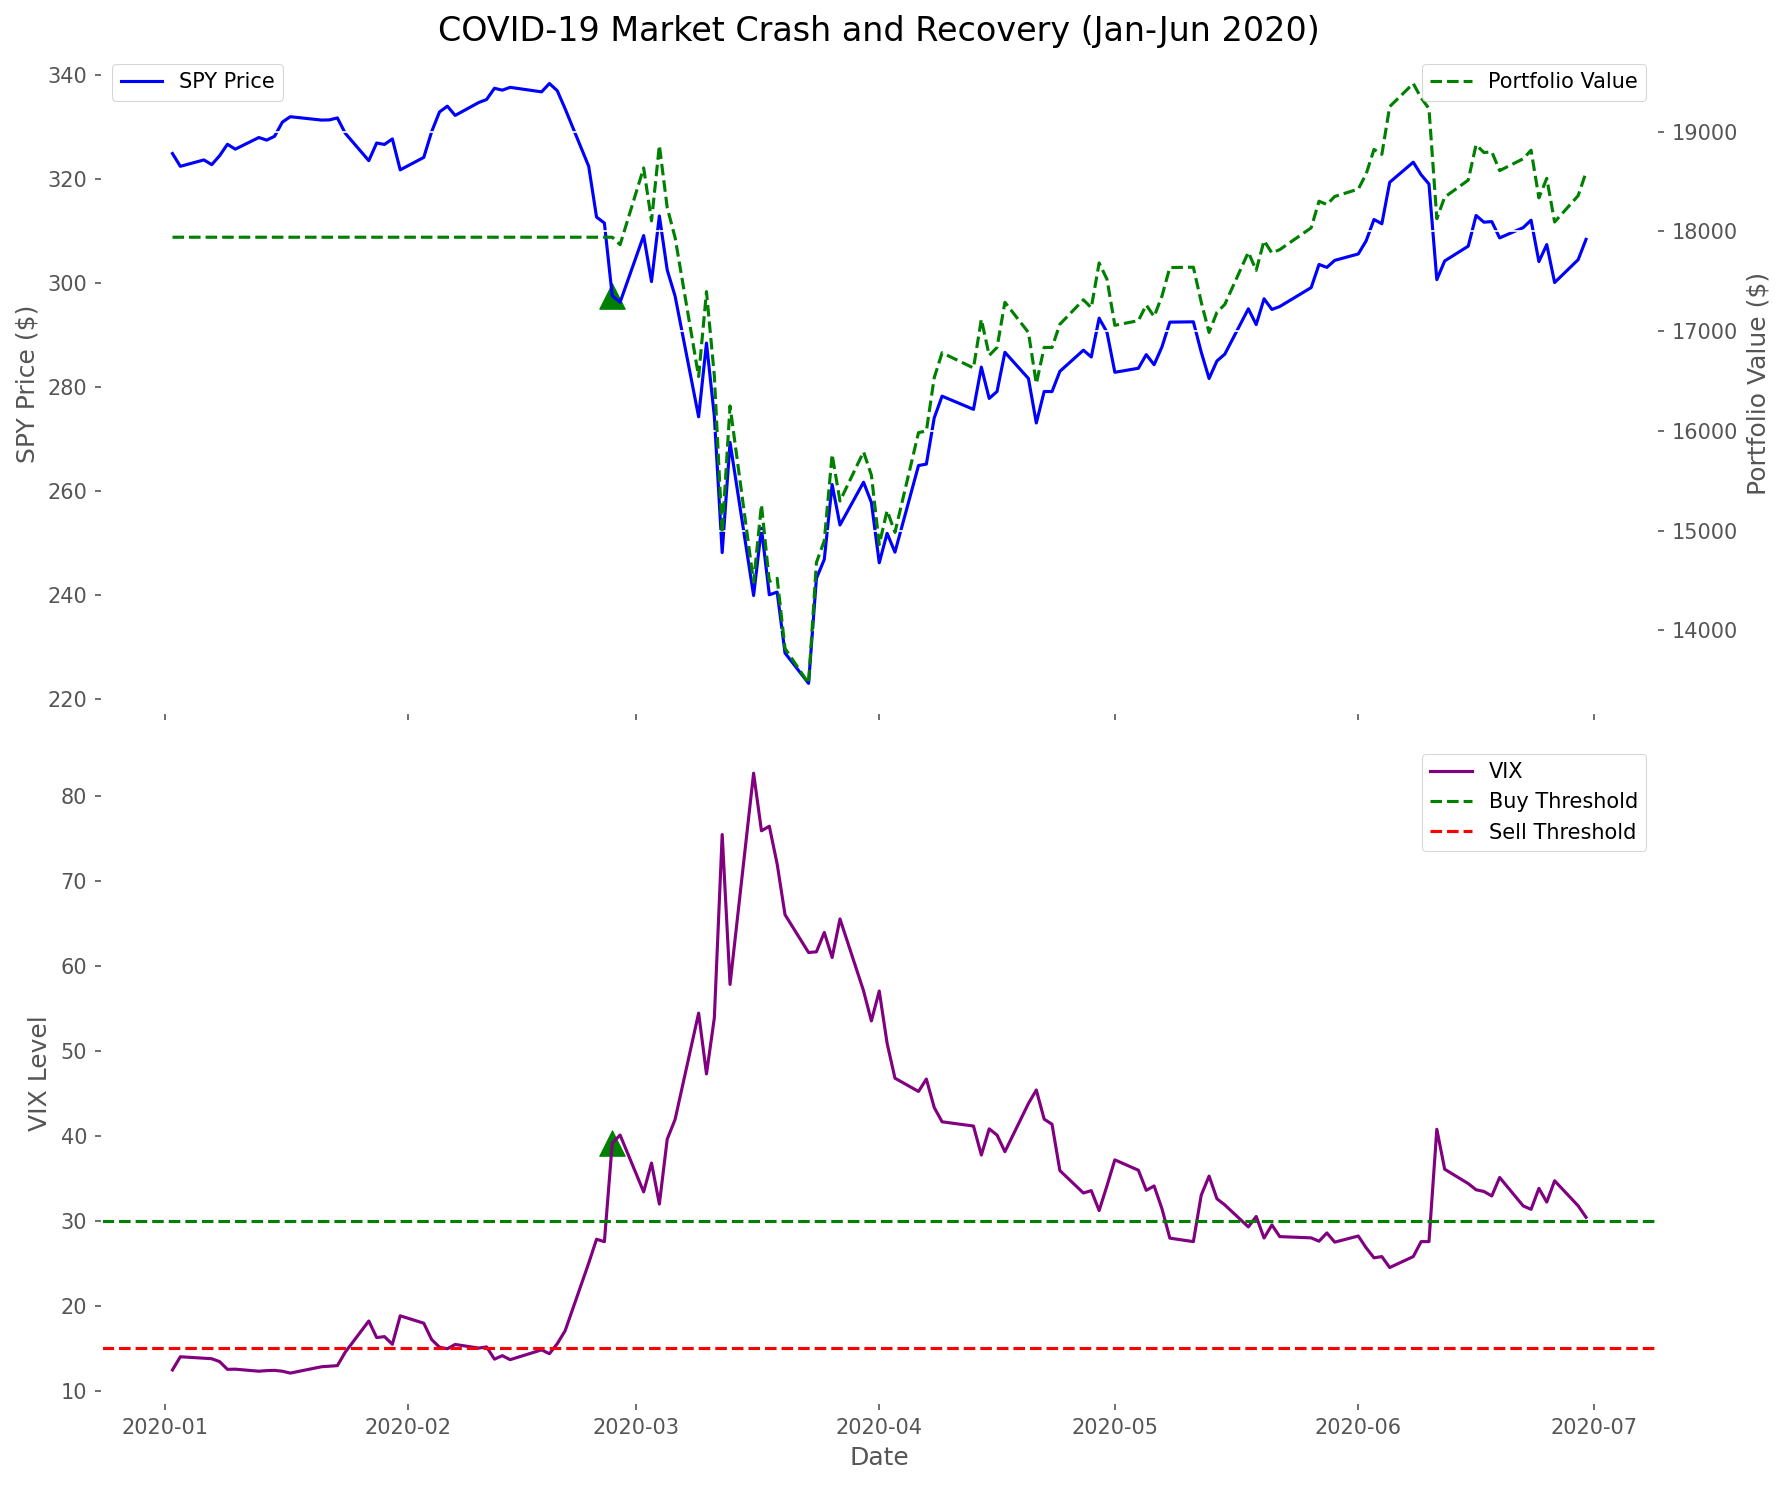
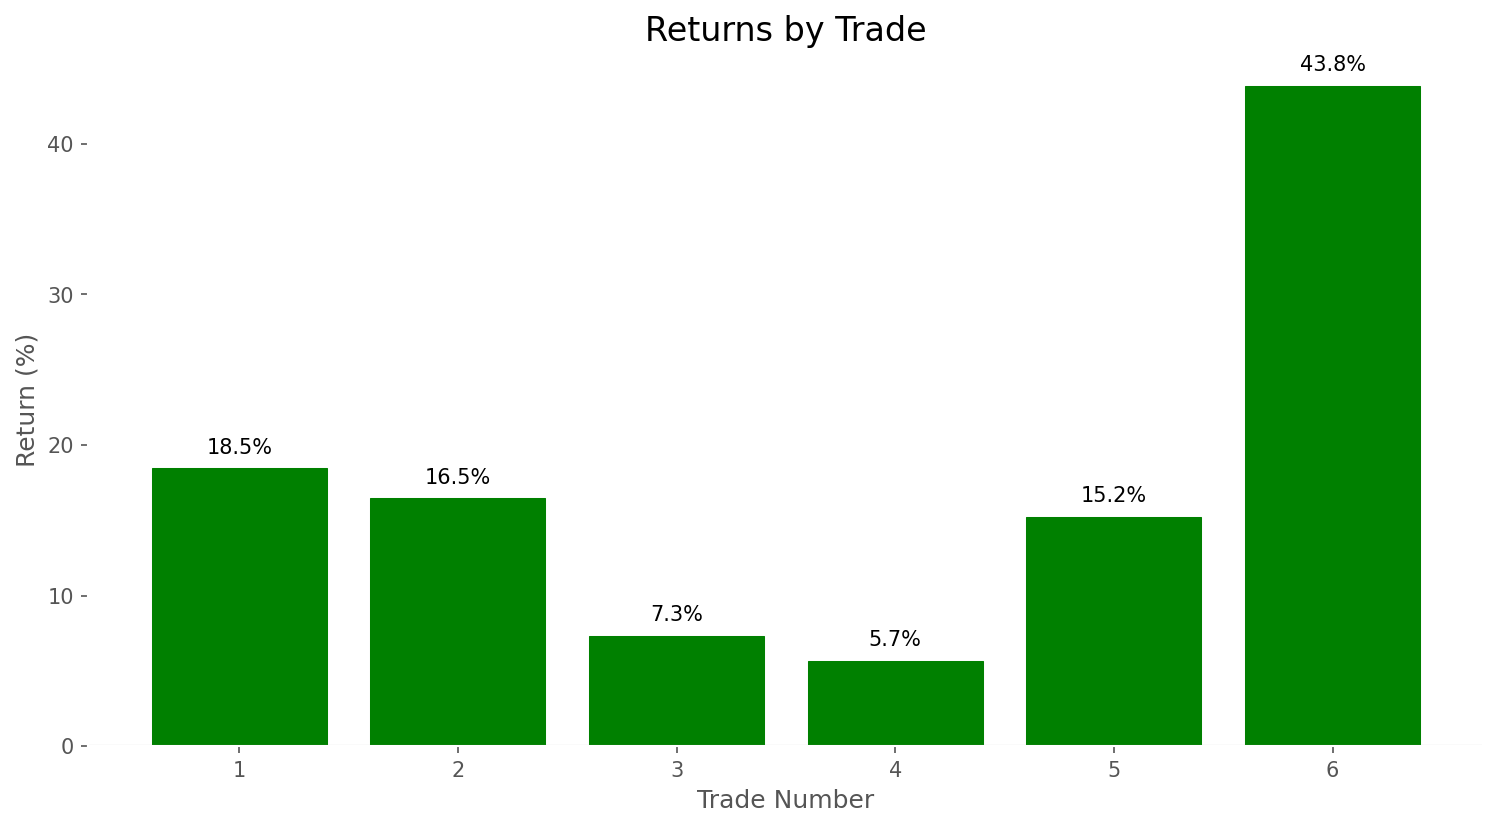
Remarkably, this position wasn't closed until June 2, 2023 – over three years later – when the VIX finally dropped below 15, triggering a sell at $427.92. This single trade generated a 43.83% return, demonstrating the strategy's potential during periods of extreme volatility. However, it also highlights a key characteristic: this approach can keep you invested for extended periods when sentiment remains within moderate ranges.
Backtest Results & Key Metrics
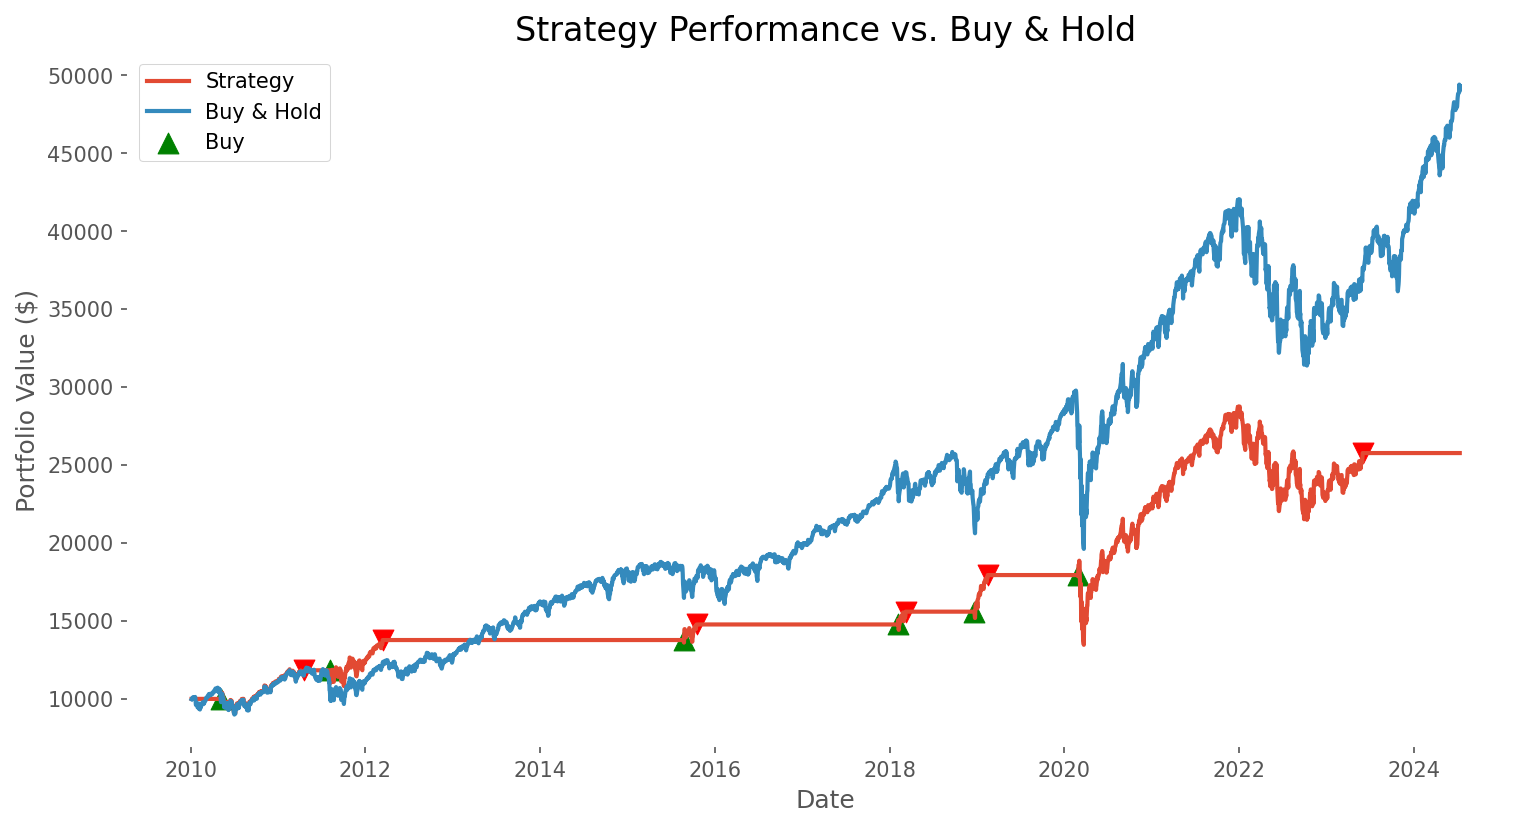
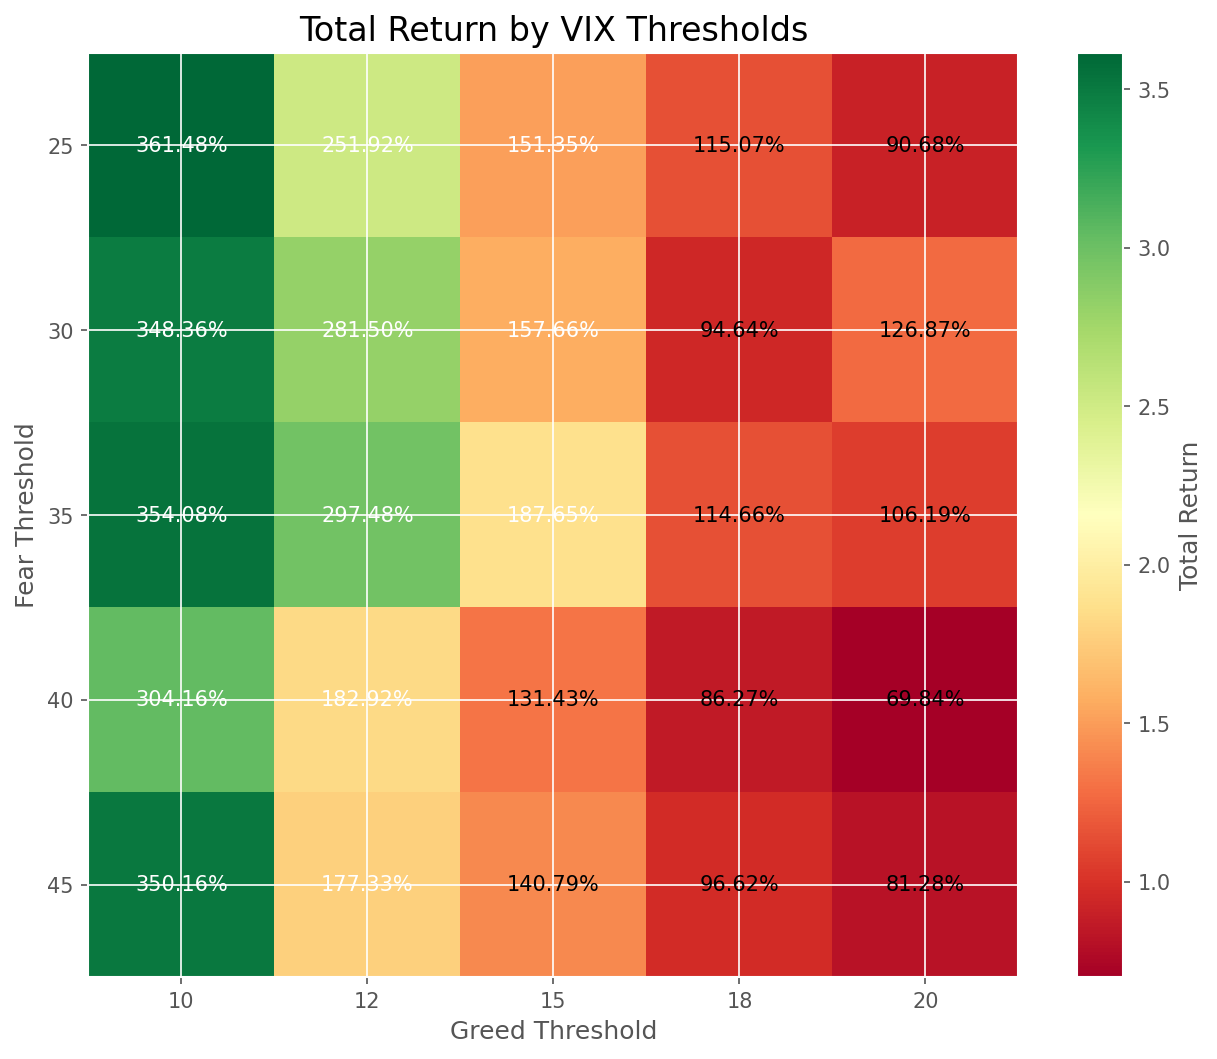
Over the full 14-year period, our sentiment-based strategy generated a 157.66% total return (6.73% CAGR), significantly underperforming a simple buy-and-hold approach, which returned 394.12% (11.62% CAGR). However, the strategy did show some promising characteristics.
| Metric | Original Strategy | Buy & Hold | Optimized Strategy |
|---|---|---|---|
| Total Return | 157.66% | 394.12% | 361.48% |
| CAGR | 6.73% | 11.62% | 11.10% |
| Max Drawdown | -28.60% | -34.10% | -33.83% |
| Time in Market | 36.01% | 100.00% | 94.50% |
| Number of Trades | 12 | 1 | 3 |
| Win Rate | 100% | 100% | 100% |
The strategy executed 12 trades over the period, all profitable, with an average return of 17.83% per trade. Notably, it achieved a lower maximum drawdown (-28.60%) than buy-and-hold (-34.10%), suggesting some downside protection during market crashes. However, the strategy kept investors in cash for nearly 64% of the time, missing significant bull market gains.
Optimization Insights
Could we improve the strategy by adjusting our VIX thresholds? Our sensitivity analysis revealed that using a lower fear threshold (VIX > 25) and a more extreme greed threshold (VIX < 10) dramatically improved results. This optimized version achieved a 361.48% return (11.10% CAGR), nearly matching buy-and-hold while maintaining slightly better downside protection.
Conclusion
Does the Fear & Greed Index work as a trading signal? Our analysis suggests a nuanced answer. The original strategy underperformed buy-and-hold but offered better downside protection. The optimized version nearly matched buy-and-hold returns with slightly lower risk. Most importantly, all trades were profitable, suggesting that extreme sentiment readings do indeed mark potential turning points.
For investors, these findings suggest that while sentiment indicators like VIX can provide valuable signals during market extremes, they're perhaps best used as one component of a broader investment approach rather than a standalone strategy. The most effective application might be using extreme fear readings as buying opportunities while maintaining a generally invested posture, rather than trying to time both entries and exits based solely on sentiment.
Comments (0)
No comments yet. Be the first to comment!