Introduction
If you’re new to investing, it can be confusing to watch the stock market jump up and down and hear headlines like “record high,” “worst month in years,” or “correction.”
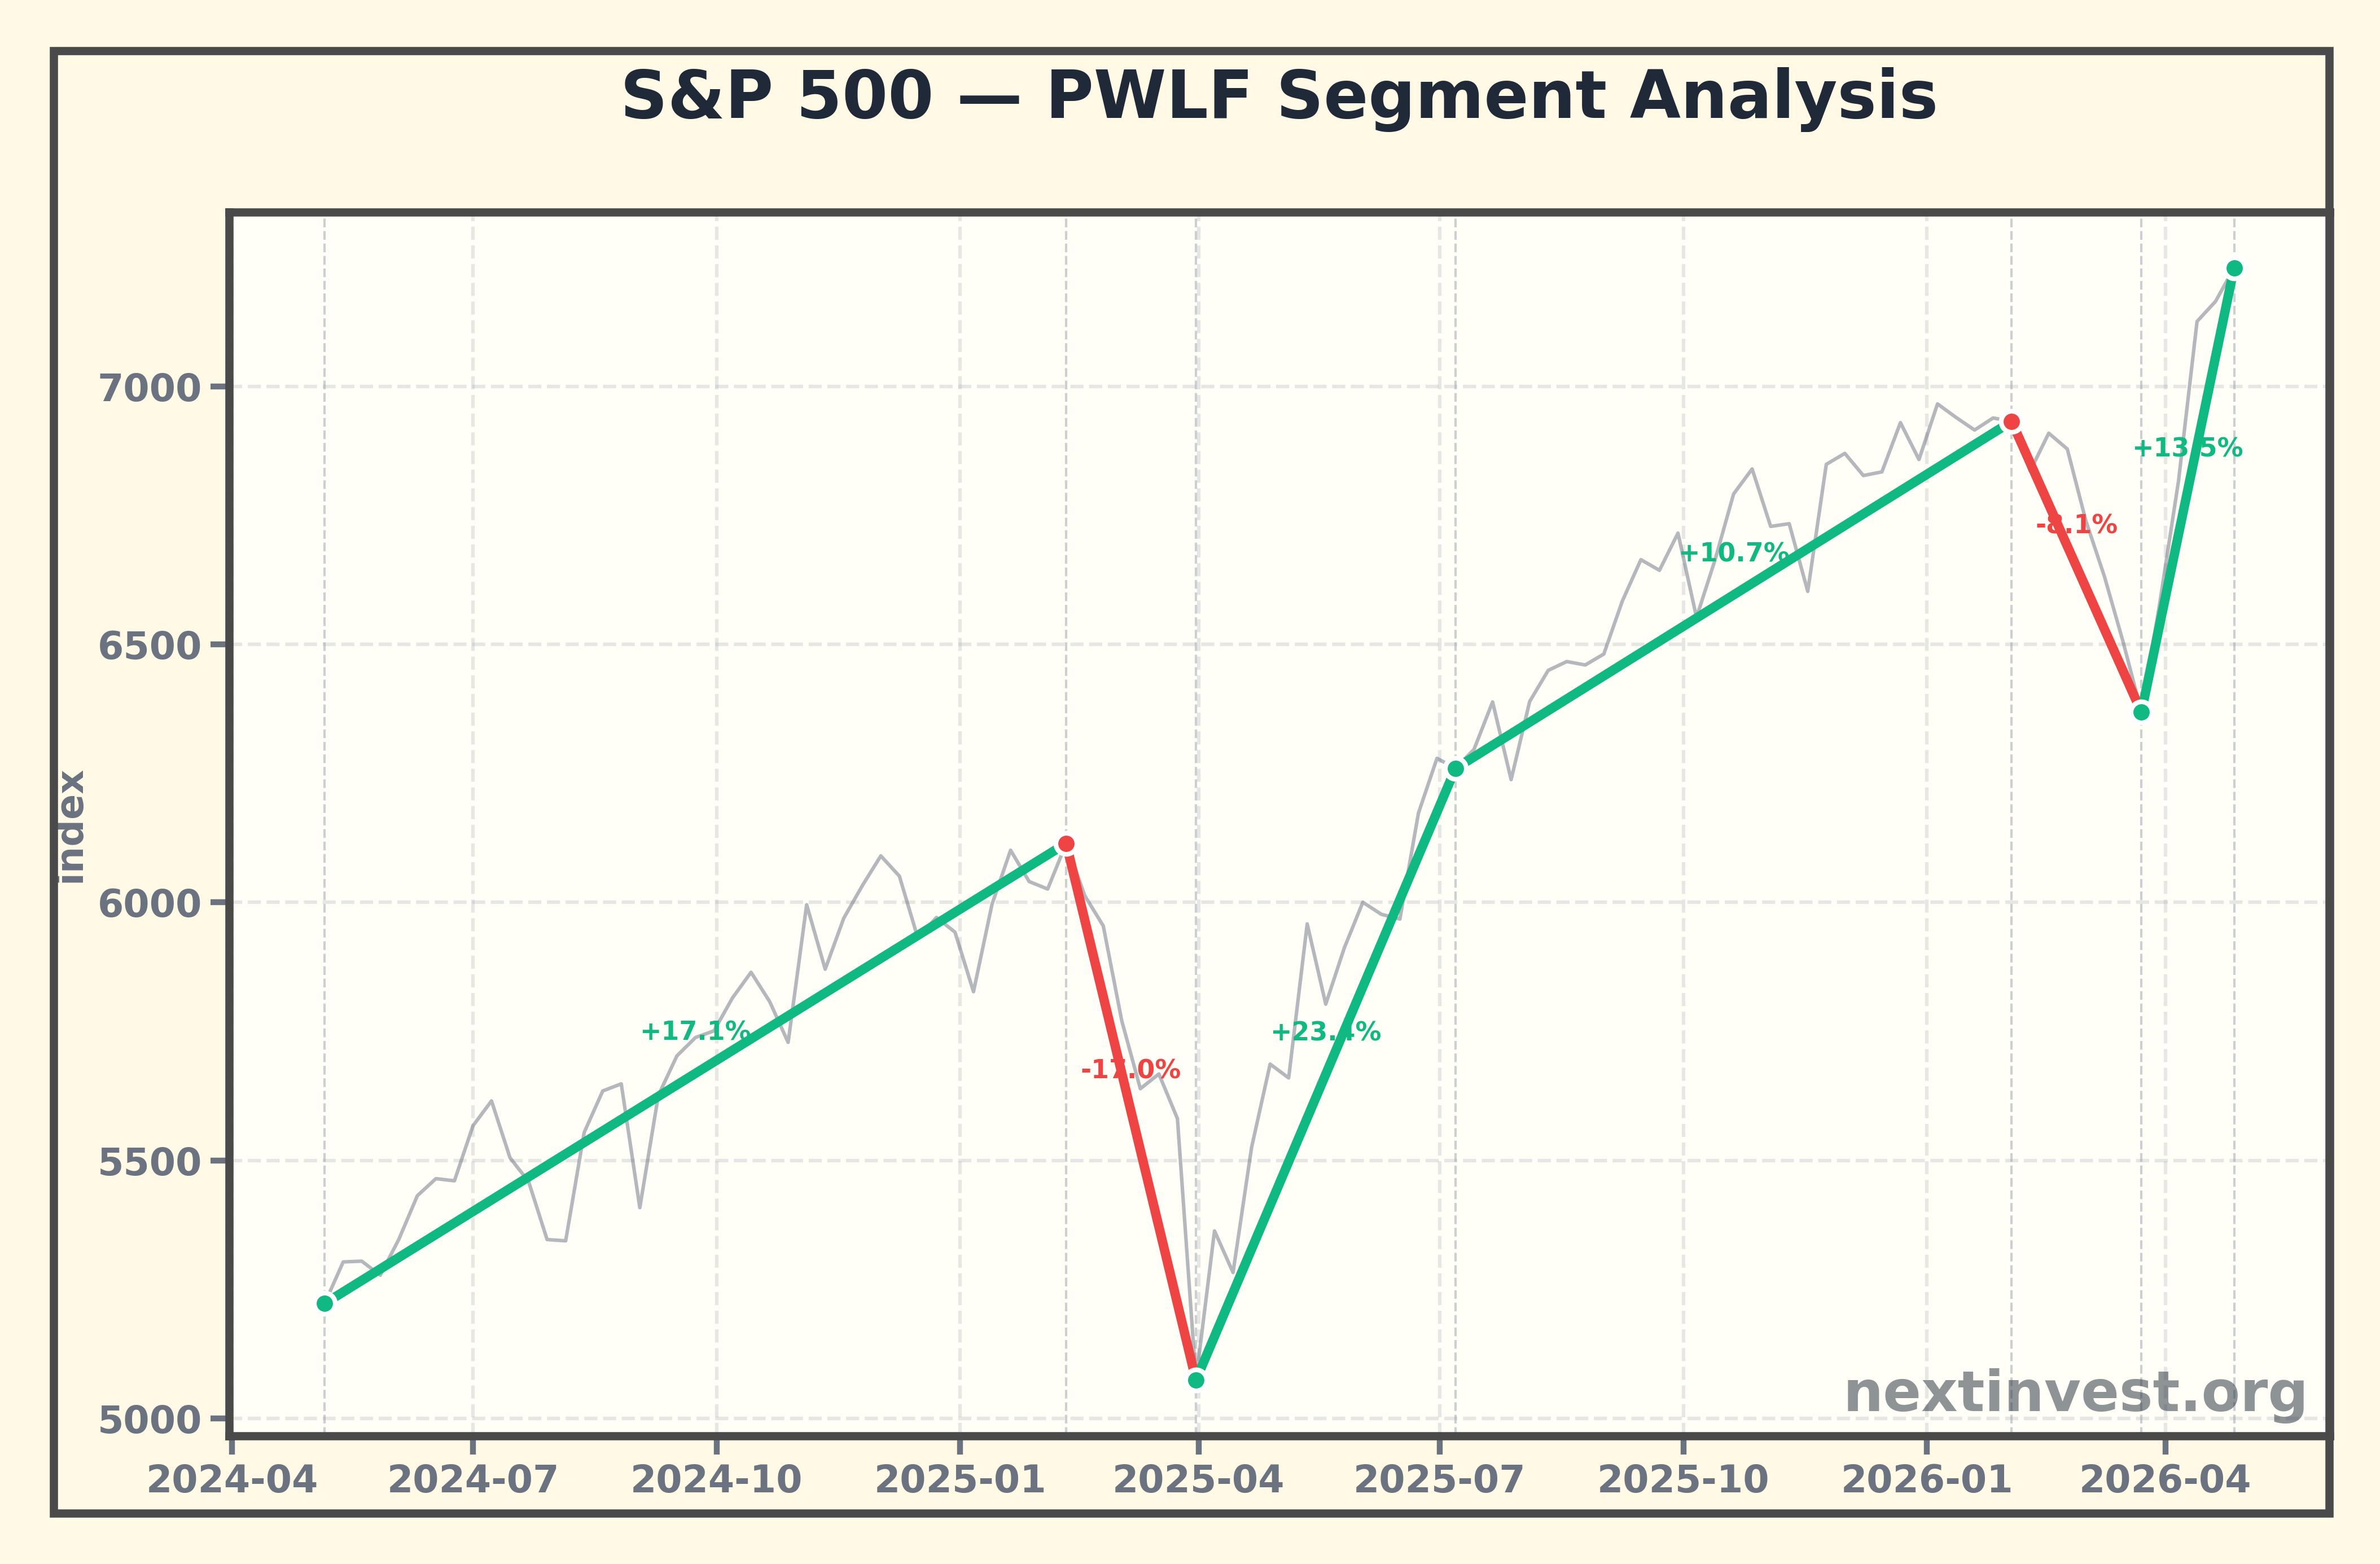
In this article, we’ll walk through about the last two years of the U.S. stock market, focusing on the S&P 500, the main index that tracks large U.S. companies. We’ll explain, in plain language, what was happening in the world during each major move, how the economy looked, and how investors were feeling.
Over our period, the S&P 500:
- Started around 5,222 points on May 6, 2024, and
- Reached about 7,230 points by April 27, 2026.
In between, it had several strong rises and sharp drops. We’ll look at each major move and connect it to real‑world events and big‑picture economic trends.
Quick definitions
- Inflation / CPI (Consumer Price Index): How much the prices of everyday goods and services are rising on average.
- Core PCE (Core Personal Consumption Expenditures price index): An inflation measure that leaves out food and energy (because they jump around a lot). This is the Federal Reserve’s favorite inflation gauge.
- Federal funds rate: The short‑term interest rate targeted by the U.S. central bank (the Federal Reserve, or “the Fed”). It’s the base for many other interest rates.
- Unemployment rate: The share of people who want a job but don’t have one.
- Real 10‑year Treasury yield: The 10‑year U.S. government bond yield after adjusting for inflation. It reflects the long‑term “real” cost of money.
Big picture backdrop: Inflation cools, rates come down from a peak, jobs soften
Before we dive into the stock market moves, it helps to know the broader economic backdrop over the last few years.
1. Inflation: Still rising, but no longer exploding
- CPI (headline inflation) rose from about 268 in May 2021 to 330 in March 2026.
- The pace changed over time:
- Fast increases in 2021–2022 (roughly +7–8% over some periods),
- More moderate increases in 2022–2023 (around +4%),
- From September 2023 to February 2026, still up about +6.6%, and
- From February to March 2026, about +0.9%.
- Core PCE (the Fed’s preferred inflation gauge) also kept rising, but from November 2025 to March 2026 it rose only about 1.4%, showing a more gradual pace.
In simple terms: prices kept going up, but the wild, explosive inflation of 2022 had cooled into a more stable—though still high—environment.
2. Interest rates: After steep hikes, a clear move into cutting mode
- In May 2021, the federal funds rate was near 0% (0.06%).
- By April 2022 to January 2023, it shot up from 0.33% to 4.33%, and then to 5.33% by January 2024. That’s the high‑rate era.
- From January 2024 to April 2026, it fell from 5.33% to 3.64%.
So during our two‑year stock‑market window (mid‑2024 onward), the important point is: the Fed was no longer raising, it was cutting. That shift from “how much higher will rates go?” to “how far and how fast will they fall?” matters hugely for stocks.
3. Jobs: From very strong to gradually weaker
- The unemployment rate fell from 5.8% in May 2021 to 3.4% by April 2023.
- From April 2023 to July 2024, it climbed from 3.4% to 4.2%.
- From July 2024 to March 2026, it edged up again from 4.2% to 4.3%.
That means the job market moved from very strong to a bit weaker, but not collapsing. This added to worries about slower growth, but not yet a full‑blown depression‑style scenario.
4. Long‑term real rates: A peak in 2023, then a slow drift down
- The real 10‑year Treasury yield climbed to about 2.08% by October 2023 and then fell to about 1.58% by April 2026.
Lower long‑term real yields generally support stock prices because they make future company profits more valuable relative to safer bonds.
Against this backdrop—inflation cooling from extremes, rates peaking and then falling, jobs slowly softening, and long‑term real yields drifting down—let’s see what actually moved the S&P 500.
Phase 1: May 6, 2024 – February 10, 2025 — AI boom and “peak rates” optimism fuel a strong rise
Index move:
- May 6, 2024: about 5,222
- February 10, 2025: about 6,115
- Roughly +17% gain
What was happening?
During this period, the main story was excitement about artificial intelligence (AI) and the belief that interest rates had finally peaked and would move lower.
- Since 2023, a powerful AI boom had been underway, driven by rapid advances in generative AI and huge demand for chips and cloud computing.
- Big technology companies and chipmakers tied to AI enjoyed strong earnings and growth expectations.
- Investors increasingly believed that the Fed was done hiking and was shifting toward cutting rates as inflation cooled from its earlier extremes.
From the macro data we have:
- Inflation (CPI and core PCE) was still rising but at a more controlled pace than in 2022.
- The federal funds rate had reached its peak (around 5.3%) and, by 2024, was in a downward trend.
Investors put this together as:
- “Inflation is not spiraling out of control anymore.”
- “The Fed is not going to keep slamming the brakes; instead, it will slowly take its foot off the brake.”
- “AI and tech profits could grow massively over time.”
This combination—cooling inflation, falling rate expectations, and powerful tech growth stories—made stocks, especially big tech, very attractive.
How investors felt
- Optimistic: Many believed the worst of the inflation and rate shock was behind them.
- FOMO (fear of missing out): There was strong pressure not to miss out on AI‑related gains.
- Even though inflation and rates were still high in absolute terms, the direction (rates down, inflation less scary) mattered more than the level.
The result was a steady, strong rise in the S&P 500 into early 2025.
Phase 2: February 10, 2025 – March 31, 2025 — Tariff shock and a fast slide into “correction”
Index move:
- February 10, 2025: about 6,115
- March 31, 2025: about 5,074
- Roughly –17% drop
Key story: Tariff (trade war) fears and an official correction
In this short period, the S&P 500 fell sharply into what investors call a “correction”—a drop of 10% or more from a recent peak.
- In February and March 2025, the U.S. administration announced and threatened higher tariffs on major trading partners.
- News reports during March 2025 described how the S&P 500 fell more than 10% from its February record high, officially entering correction territory as worries about a tariff war and recession piled up.
- Articles noted that trillions of dollars in market value were wiped out in just a few weeks as stocks sold off widely.
Why are tariffs such a big deal?
- Higher tariffs raise import costs for companies.
- This can squeeze profit margins (companies earn less on each sale).
- It can also hurt global trade and growth, increasing the risk of an economic slowdown or recession.
How this fit with the economic backdrop
At the same time:
- Inflation was still above the Fed’s long‑run target and not fully “fixed.”
- The federal funds rate, while already on a downward path, was still relatively high.
- Unemployment had risen from its lows, suggesting the economy was already cooling.
So investors suddenly had to face a triple concern:
- Tariffs threatening profits and global trade.
- Still‑elevated inflation, limiting how aggressively the Fed could cut rates.
- A softening job market, hinting at weaker growth.
How investors felt
- Fearful and defensive: “If tariffs hurt profits and growth, stocks may be too expensive at these levels.”
- Many investors took this as a cue to take profits from the long AI‑driven rally and reduce risk.
- Selling fed on itself: as prices dropped, more people panicked and sold, creating a fast slide.
This phase is a classic example of how policy shocks (like tariffs) can suddenly change the mood and trigger a sharp downturn, even when the broader economic trend (rates drifting down) still looks supportive in the long term.
Phase 3: March 31, 2025 – July 7, 2025 — Digesting the shock and staging a powerful rebound
Index move:
- March 31, 2025: about 5,074
- July 7, 2025: about 6,260
- Roughly +23% gain
What drove the rebound?
After the March correction, the market staged a strong comeback in the spring and early summer of 2025.
Several forces played a role:
-
Tariff fears partially priced in and reassessed
- Initially, investors reacted as if the worst‑case scenario for trade and growth might unfold.
- As time passed within this period, the situation looked less like total disaster and more like a manageable headwind.
- Investors realized they might have overreacted in March.
-
Corporate earnings and the AI/tech story remained intact
- Many large companies continued to report solid profits.
- The long‑term AI and tech growth narrative remained very much alive; the basic story hadn’t changed.
-
Interest rate cuts and lower long‑term real yields
- The Fed was still in a rate‑cutting environment, having moved down from peak levels.
- The real 10‑year yield was off its earlier highs, reducing the competition from bonds.
Put simply, once the initial tariff shock was absorbed, investors realized:
- “Yes, tariffs are a problem, but not the end of the world.”
- “AI and tech growth, and lower rates, are still strong supports.”
How investors felt
- From panic to relief: The mood shifted from “sell at any price” to “maybe we overdid it.”
- Bargain hunting: Lower prices after the correction attracted investors who had been waiting on the sidelines.
- As buying pressure returned, the index climbed strongly back toward and beyond previous levels.
This phase shows how markets can swing too far in both directions—first overreacting to bad news, then rebounding when it becomes clear that reality is not as dire as feared.
Phase 4: July 7, 2025 – February 2, 2026 — Record highs, steady gains, and growing bubble worries
Index move:
- July 7, 2025: about 6,260
- February 2, 2026: about 6,932
- Roughly +10.7% gain
Character of this period: “Melt‑up” with unease underneath
From mid‑2025 into early 2026, U.S. stocks went on another run of record highs.
- Reports from July 2025 described the S&P 500 rising again and again, even setting multiple all‑time highs in a short span, as tech and AI‑related names remained strong.
- Some commentators referred to this as a kind of “melt‑up”—a slow, almost effortless drifting higher in prices, sometimes driven by investors who were afraid to be left behind.
At the same time, concerns built up:
- Analysts and articles started to talk about “bubble” risk, especially in AI‑related and high‑growth stocks.
- Many noted that while stock prices were very high, the broader backdrop included policy uncertainty, stubborn inflation, and a labor market showing signs of strain.
Macro backdrop in this window
From the data:
- CPI and core PCE were still rising. Inflation had not fully returned to the Fed’s comfort zone.
- The federal funds rate was lower than its peak but still relatively high, in the 3–5% range over this broader period.
- Unemployment had risen from its lows and was hovering above 4%, showing that the job market was no longer red‑hot.
- The real 10‑year yield was off its 2023 highs but still positive.
This mix meant that:
- Stocks could justify high prices with lower long‑term rates and strong tech earnings.
- But there was also a sense that markets were “priced for perfection”—assuming that everything from AI growth to interest‑rate cuts to geopolitical calm would go right.
How investors felt
- Publicly upbeat but privately nervous: Many investors stayed in the market because performance was strong, but they also worried about valuation (how expensive stocks had become) and the risk of a sudden pullback.
- Some began rotating into more defensive sectors (like consumer staples or healthcare) or holding a bit more cash, just in case.
This period is a good example of how markets can keep rising even as worries pile up, right until a new shock pushes them downward.
Phase 5: February 2, 2026 – March 23, 2026 — War, energy shock, and stagflation fears trigger another drop
Index move:
- February 2, 2026: about 6,932
- March 23, 2026: about 6,369
- Roughly –8.1% drop
Key story: Middle East conflict, energy prices, and “stagflation” fears
In early 2026, the mood turned sharply darker.
- A serious conflict involving the U.S., Israel, and Iran shook the Middle East.
- Fears of disrupted oil supplies drove energy prices sharply higher.
- Commentators began warning about “stagflation”—a toxic situation where the economy is weak or shrinking (stagnation) but inflation stays high or rises.
One way these worries showed up: from the late January peak to the end of March, the S&P 500 fell close to 10%, putting it near correction territory again.
Why was this especially scary for investors?
- Higher energy costs raise production and transportation costs for almost every business.
- They also hit consumers in their wallets (for gasoline, heating, etc.), which can reduce spending on other goods and services.
- Yet inflation was still elevated, which limited how aggressively the Fed could slash rates in response.
Macro backdrop at this point
- Inflation (CPI and core PCE) was still in an upward trend into early 2026—no clean victory yet.
- The federal funds rate had come down from its peaks but was still around the mid‑3% range by April 2026.
- Unemployment had risen to about 4.3%, confirming that the labor market was cooling.
- The real 10‑year yield was lower than in 2023 but still positive.
So investors saw a possible worst‑of‑both‑worlds scenario:
- Weakening growth (as energy costs bite and jobs soften),
- Persistent or rising inflation (from the energy shock), and
- Limited policy room for the Fed (can’t cut too fast if inflation stays hot).
How investors felt
- Risk‑off (risk‑avoidance) mode: Many shifted money into cash, bonds, or gold, and away from stocks.
- The combination of war, energy shock, and inflation risk felt like too much uncertainty all at once.
As a result, the S&P 500 slid around 8% over this period, with the peak‑to‑trough move from late January to late March approaching a full correction.
Phase 6: March 23, 2026 – April 27, 2026 — Relief rally: “We dodged the worst, for now”
Index move:
- March 23, 2026: about 6,369
- April 27, 2026: about 7,230
- Roughly +13.5% gain
Why did the market bounce back so fast?
After the early‑2026 scare, markets quickly staged a relief rally.
Several factors contributed:
-
The worst‑case war and energy scenarios didn’t fully materialize
- While the conflict and energy risks were serious, the most extreme fears—like a total collapse in supply or a much wider war—had not come to pass by this time.
- As fresh data came in, investors began to think: “Maybe this is painful, but not catastrophic.”
-
Rate‑cutting trend and lower real yields were still in place
- The federal funds rate continued on a lower path compared with its 2023 peak.
- The real 10‑year yield had fallen from about 2.08% (October 2023) to around 1.58% (April 2026), supporting the idea that stocks remained attractive against bonds over the long term.
-
No immediate collapse in jobs or profits
- Unemployment at 4.3% was higher than the low of 3.4% but still far from crisis levels.
- While some sectors felt pressure, there was no evidence of a massive wave of bankruptcies or job losses at this point.
How investors felt
- From panic to cautious optimism: Once the news flow suggested that the worst fears might be overblown—or at least delayed—investors began to buy the dip.
- Some who had sold during the drop felt pressure to get back in as prices rose.
This produced a strong, roughly 13% rebound in just about a month, pushing the S&P 500 to new highs again.
Putting it all together: Why did the S&P 500 swing so much?
Looking back over these six phases, you can see a pattern:
-
AI and “peak rates” optimism (May 2024 – Feb 2025)
- Cooling inflation and the shift from rate hikes to rate cuts, combined with powerful AI growth stories, drove a strong rally.
-
Tariff‑driven correction (Feb 2025 – Mar 2025)
- Trade war fears and recession worries triggered a fast drop of more than 10% from the high.
-
Rebound as fears eased (Mar 2025 – Jul 2025)
- Once it became clear that the world was not ending, and earnings and AI stories were intact, stocks rebounded sharply.
-
Steady record‑setting gains with bubble worries (Jul 2025 – Feb 2026)
- Lower rates and strong tech performance pushed stocks higher, but many investors grew uneasy about high valuations and policy risks.
-
War, energy shock, and stagflation fears (Feb 2026 – Mar 2026)
- Conflict in the Middle East, energy price spikes, and high inflation revived fears of a nasty mix of weak growth and persistent inflation, sending stocks down again.
-
Relief rally as worst fears receded (Mar 2026 – Apr 2026)
- When the most extreme scenarios didn’t unfold immediately, and the rate‑cutting trend remained in place, investors rushed back in and pushed the index to new highs.
From these swings, a few key lessons emerge for beginners:
1. Markets react to expectations, not just today’s data
It’s not only whether inflation or rates are high right now; it’s about what investors expect next.
- When investors expect lower inflation and lower future rates, stocks often rise—even if levels are still high.
- When they fear higher tariffs, higher energy prices, or higher inflation in the future, stocks can fall fast.
2. Many forces push on the market at once
Stock prices are rarely moved by a single factor. Over these two years, we saw:
- Economic data: inflation, unemployment, growth.
- Central‑bank policy: rate hikes first, then cuts.
- Technology stories: especially the AI boom.
- Politics and geopolitics: tariffs, wars, and policy uncertainty.
Big market moves often happen when several of these line up in the same direction, either positive or negative.
3. Fear and greed cycle back and forth
- After long rallies, people start to worry that prices are too high, and any shock can trigger selling.
- After sharp drops, people see bargains and start buying again once the dust settles.
Markets don’t move in straight lines. They move in waves, with each wave driven by a mix of facts and emotions.
If you keep these patterns in mind—looking not just at headlines but also at inflation, interest rates, jobs, and big global events—you’ll start to see why the market jumps around and be better prepared for the next set of ups and downs.