1. What the full pattern tells us: three clear cause‑and‑effect links
Looking across the last 5 years of macro data and roughly 2 years of S&P 500 moves, a few patterns show up repeatedly. Here are three of the strongest ones, with numbers and simple mechanisms you can reuse in the future.
Pattern 1: Stocks tended to do better once the Fed stopped hiking and moved into cutting mode
-
Fed funds rate
- 2021‑05 to 2022‑04: 0.06% → 0.33% (up +450%)
- 2022‑04 to 2023‑01: 0.33% → 4.33% (very sharp hikes, +1,212%)
- 2023‑01 to 2024‑01: 4.33% → 5.33% (additional +23.1%)
- 2024‑01 to 2026‑04: 5.33% → 3.64% (down –31.7%)
-
S&P 500 during the “post‑peak, cutting” phase
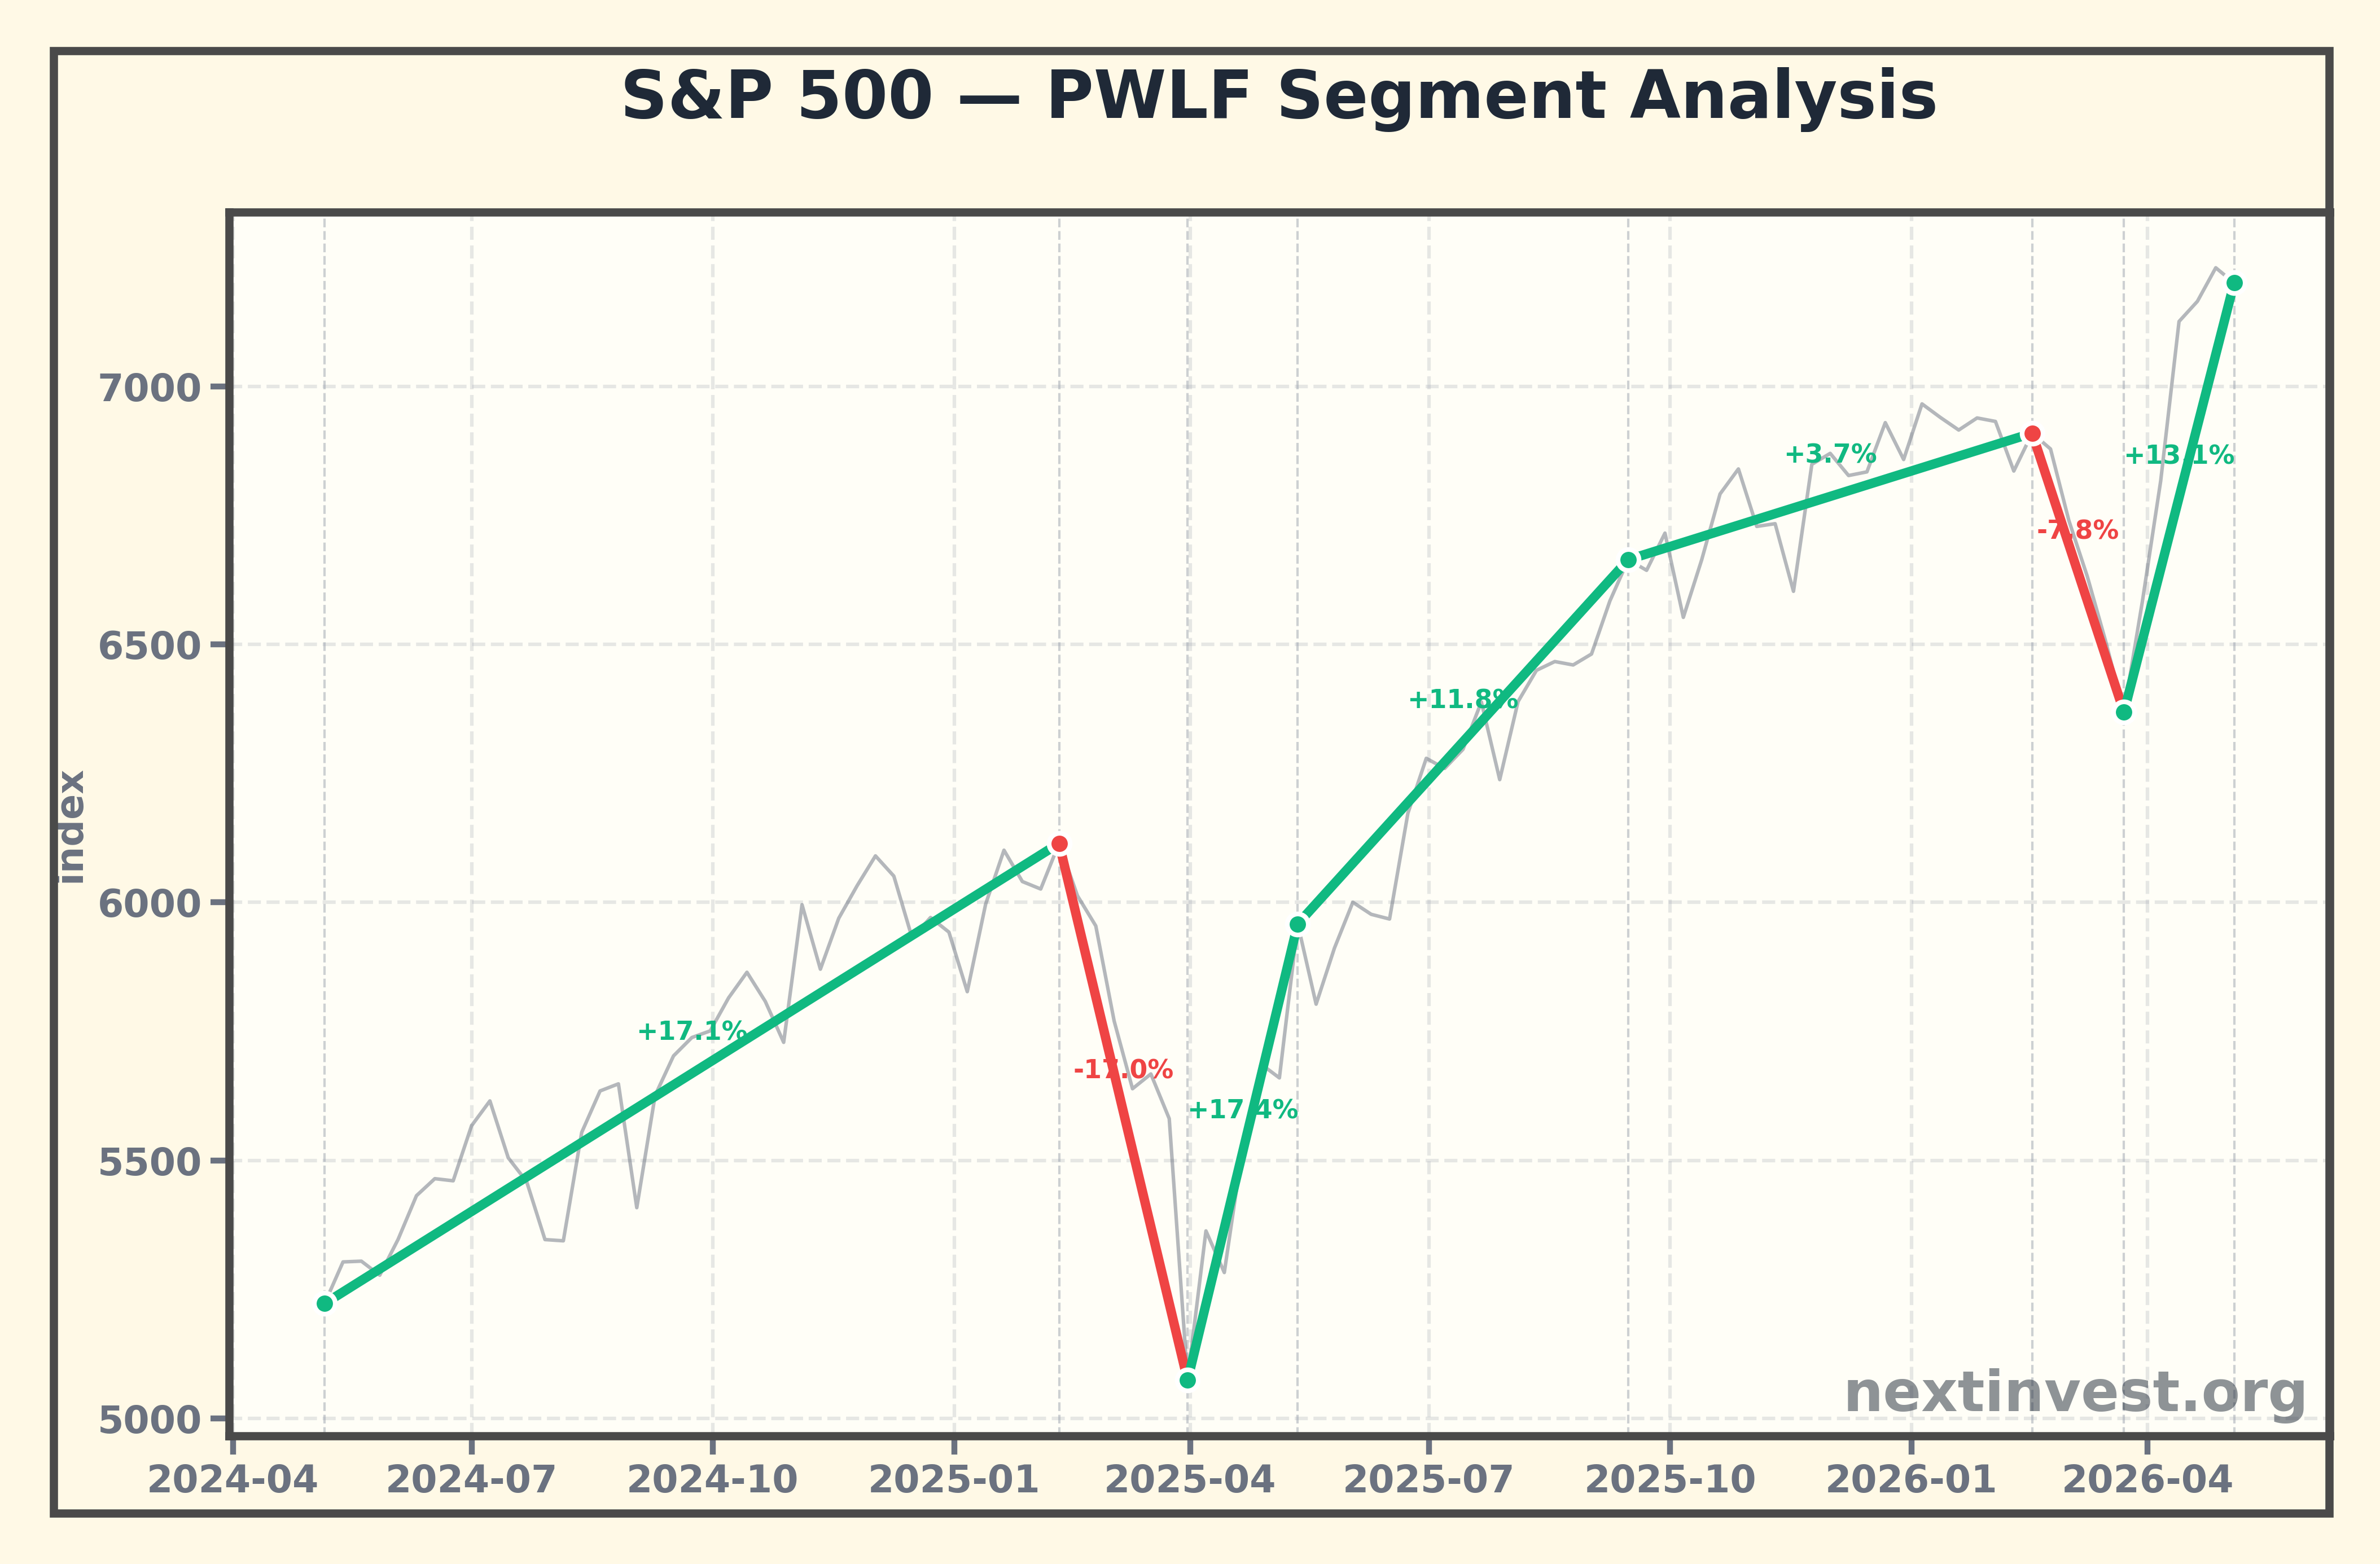
- 2024‑05‑06 to 2025‑02‑10: 5222.7 → 6114.6 (+17.1%)
- 2025‑03‑31 to 2025‑09‑15: 5074.1 → 6664.4 (+31.4%, including the rebound from the tariff correction)
- 2026‑03‑23 to 2026‑05‑04: 6368.9 → 7200.8 (+13.1%)
Mechanism (in plain language)
- When rates fall, interest costs drop and future profits are discounted at a lower rate, which mathematically lifts today’s “fair value” of stocks.
- Growth and tech stocks, whose value depends heavily on far‑future profits, are especially sensitive to the shift from “how high will rates go?” to “how far will they fall?”
- Historical research on past easing cycles (for example, 1995 and 2019) finds that when the Fed cuts without an immediate recession, S&P 500 returns over the following year have often been positive.(cmegroup.com)
Pattern 2: Policy/geopolitical shocks created sharp drawdowns, followed by strong rebounds once the worst fears faded
-
Tariff shock in early 2025
- 2025‑02‑10 to 2025‑03‑31: 6114.6 → 5074.1 (about –17.0%, a full‑blown correction)
- 2025‑03‑31 to 2025‑05‑12: 5074.1 → 5958.4 (+17.4% rebound)
-
War/energy shock in early 2026
- 2026‑02‑16 to 2026‑03‑23: 6909.5 → 6368.9 (about –7.8%)
- 2026‑03‑23 to 2026‑05‑04: 6368.9 → 7200.8 (+13.1% rebound)
Historically, big geopolitical shocks (wars, terror attacks, oil embargoes) have often delivered fast, frightening drops, but markets tended to recover once the economic damage turned out to be more limited than feared. Examples include the 1973–74 oil shock and stock crash, the Gulf War, and other major events where the initial market reaction overshot the eventual economic impact.(en.wikipedia.org)
Mechanism
- At first, markets price in the worst case: full‑scale war, severe supply disruptions, deep recession.
- As data comes in and policymakers respond, investors see that reality is bad but not apocalyptic, and part of the “fear discount” is reversed, fueling a rebound.
Pattern 3: When inflation shifted from “surging” to “moderately rising” and real long‑term yields drifted down, valuations expanded
-
CPI (headline inflation index)
- 2021‑05 to 2022‑06: 268.4 → 295.0 (about +9.9%, a high‑inflation burst)
- 2022‑06 to 2023‑09: 295.0 → 307.3 (about +4.2%, slower increase)
- 2023‑09 to 2026‑03: 307.3 → 330.3 (about +7.5% over 2.5 years; annualized in the mid‑2–3% range)
-
Core PCE (Fed’s preferred core inflation)
- 2021‑05 to 2023‑04: 108.1 → 118.7 (about +9.8%)
- 2023‑04 to 2023‑12: 118.7 → 120.6 (about +1.6%)
- 2023‑12 to 2026‑03: 120.6 → 129.3 (about +7.2% over 2 years 3 months)
-
Real 10‑year Treasury yield
- 2023‑10 peak: 2.0825%
- 2026‑04: 1.5849% (down –23.9%)
Over roughly the same span, the S&P 500 climbed from 5222.7 (2024‑05‑06) to 7200.8 (2026‑05‑04), about +37.8%.
External data confirms that U.S. inflation peaked around 2022 and then slowed toward the mid‑2–3% range on a year‑over‑year basis into 2024–2025, much lower than the 2022 highs.(in2013dollars.com)
Mechanism
- When inflation cools from “runaway” to “manageable,” central banks can stop hiking and start gently cutting, reducing the pressure on valuations.
- As real 10‑year yields fall from their peak, the discount rate on long‑term cash flows drops, which mechanically raises the price investors are willing to pay for a given stream of profits.
- This combination—slower inflation + lower real yields—has historically supported equity rallies, especially after high‑inflation episodes.
These three patterns (rate direction, shock‑and‑rebound, inflation + real‑rate mix) are the basic toolkit we’ll use to think about the next 12 months.
2. Reading today’s indicators: tailwind or headwind?
Now let’s look at where each macro indicator stands right now and whether its current direction is helping or hurting the S&P 500.
2.1 Inflation (CPI & Core PCE)
-
CPI (headline)
- 2021‑05: 268.383
- 2026‑03: 330.293 (about +23.1% cumulative)
- Recent segments:
- 2023‑09 to 2026‑02: 307.276 → 327.46 (+6.6%)
- 2026‑02 to 2026‑03: 327.46 → 330.293 (+0.87% in a month)
-
Core PCE
- 2021‑05: 108.099
- 2025‑11 to 2026‑03: 127.469 → 129.279 (+1.42% over 4 months)
Broader statistics show that by late 2024 the U.S. 12‑month CPI rate had slowed into the mid‑2% range, far below the 2022 peak, and core inflation was around a similar level.(in2013dollars.com)
Tailwind or headwind?
- Tailwinds
- Inflation is much slower than in 2022; both CPI and core PCE are rising at a more controlled pace.
- That gives the Fed room to continue cutting rates without immediately losing credibility.
- Headwinds
- The price level itself is still high: CPI 330 vs 268 in 2021 means everyday costs are ~23% higher than five years ago.
- Recent energy and food price spikes—tied to the Middle East conflict—have revived concern that inflation could flare again.(kiplinger.com)
One‑line takeaway: Inflation has gone from “out of control” to “mostly tamed but still touchy”—a mild tailwind that could flip to a headwind if energy shocks persist.
2.2 Fed funds rate
- 2023‑01: 4.33%
- 2024‑01: 5.33% (cycle peak)
- 2026‑04: 3.64% (down about 1.69 percentage points, –31.7%)
Looking across past cycles, when the Fed started cutting from high levels without an immediate recession, stocks often did reasonably well (for example, 1995–96 and parts of 2019–early 2020), whereas cuts that coincided with or preceded recessions (2001, 2008) were followed by much worse equity outcomes.(cmegroup.com)
Direction today
- We are clearly in a post‑peak, easing phase: from 5.33% down to 3.64%, with markets expecting more cuts if inflation cooperates.
One‑line takeaway: The direction of policy (cutting, not hiking) is a clear tailwind for the S&P 500—but it depends on inflation staying well‑behaved.
2.3 Unemployment rate
- 2021‑05 to 2023‑04: 5.8% → 3.4% (strong recovery)
- 2023‑04 to 2024‑07: 3.4% → 4.2%
- 2024‑07 to 2026‑03: 4.2% → 4.3% (latest 4.3%)
Historically, U.S. unemployment in the 4–5% range has often coincided with “near full employment but not overheating.” Significant recession risk usually comes when unemployment spikes quickly into the 5–6%+ range.(aeaweb.org)
Tailwind or headwind?
- Tailwind
- Moving from very tight (3.4%) to moderately tight (4.3%) helps cool wage and price pressures, giving the Fed more freedom to cut.
- Headwind
- The trend has been up, not down: a rise from 3.4% to 4.3% signals slower growth and some softening in labor demand.
- If this continues and unemployment jumps past 5%, recession odds rise, which would hurt earnings.
One‑line takeaway: Today’s 4.3% unemployment is a mild headwind—not crisis territory, but clearly weaker than the 3.4% low.
2.4 Real 10‑year Treasury yield
- 2023‑10: 2.0825% (peak)
- 2026‑04: 1.5849% (down –23.9%)
In past stagflationary episodes like the 1970s, real rates often turned sharply negative, undermining bonds and short‑term cash while supporting hard assets. Today’s real yield is positive but lower than its peak, making bonds somewhat attractive while not crushing equity valuations.(en.wikipedia.org)
One‑line takeaway: The decline in real yields from 2.08% to 1.58% is a gentle tailwind—supportive for valuations, but not a runaway “TINA” (there is no alternative) environment.
2.5 S&P 500: price and recent behavior
- 2024‑05‑06: 5222.7
- 2025‑02‑10: 6114.6
- 2025‑03‑31: 5074.1 (tariff shock low)
- 2025‑09‑15: 6664.4
- 2026‑02‑16: 6909.5
- 2026‑03‑23: 6368.9 (war/energy shock pullback)
- 2026‑05‑04: 7200.8 (near record high)
Over roughly two years, that’s a gain of about +37–40%, punctuated by two ~10% corrections.
One‑line takeaway: The macro winds are broadly supportive, but current prices are already rich—a lot of good news is embedded, leaving less cushion if macro data disappoints.
3. Historical analogues: matching today’s fingerprint
Now we look for past configurations that resemble today’s mix of falling policy rates, moderating inflation, rising (but not spiking) unemployment, and geopolitical energy risk.
Analogue 1: The mid‑1990s “soft landing” case
In 1994, the Fed hiked aggressively; in 1995 it shifted to modest rate cuts (~0.75 percentage points) as inflation stabilized. The economy avoided recession, and the S&P 500 delivered strong returns in 1995–96.(cmegroup.com)
Similarities with today
-
Similarity 1: From fast hikes to gentle cuts
- 1994–95: rapid tightening followed by moderate easing.
- 2022–24: rates surged from near 0% to 5.33%, then declined to 3.64% by April 2026.
-
Similarity 2: Inflation cooled after a spike
- In the early 1990s, inflation receded after the 1990–91 episode, allowing the Fed to ease.
- In the early‑mid 2020s, inflation peaked in 2022 and slowed to the mid‑2% range by late 2024, with core inflation also moderating.(in2013dollars.com)
-
Similarity 3: Unemployment off the lows but not high
- Mid‑1990s: unemployment hovered in the 5–6% range, not extreme by historical standards.
- Today: unemployment has risen from 3.4% to 4.3%, a softening but not a collapse.
Key differences
- The mid‑1990s did not feature a major, persistent energy‑supply or geopolitical shock.
- Today, the conflict involving the U.S., Israel and Iran, plus triple‑digit oil prices, has revived stagflation chatter in a way we didn’t see in 1995.(kiplinger.com)
What this analogue suggests
- If, over the next 12 months:
- Inflation stays around 2–3%,
- Unemployment moves sideways in the 4–5% range, and
- Energy and geopolitical tensions do not worsen dramatically,
- then a “soft landing” style outcome—continued but slower growth, modest earnings expansion, and moderate equity gains—remains plausible.
- Given today’s higher starting valuation, the mid‑1990s style explosive rally is less likely; think gradual gains with 10% pullbacks, not another +30–40% in a straight line.
Analogue 2: The 1970s “energy + inflation + policy dilemma” case
In the 1970s, two major oil price spikes (1973–74 and 1979) combined with already‑high inflation and policy mistakes to produce stagflation—high inflation, weak growth, and high unemployment.(en.wikipedia.org) Oil prices more than quadrupled, inflation ran into double digits, and unemployment climbed toward 7–9%.
The result: the 1973–74 stock market crash and a decade of poor real (inflation‑adjusted) returns for many equity markets.(en.wikipedia.org)
Similarities with today
-
Similarity 1: Energy and geopolitics
- 1970s: Middle East tensions and OPEC supply cuts drove huge oil spikes.
- 2026: A conflict involving the U.S., Israel and Iran has pushed oil past $100 and raised concerns about supply and shipping routes.(kiplinger.com)
-
Similarity 2: Energy shocks hitting after inflation has already risen
- 1970s: oil shocks hit when inflation was already high.
- Now: CPI has already climbed from 268 to 330 since 2021; new energy shocks arrive on top of elevated price levels.
Key differences
- Today the global economy is less oil‑intensive than in the 1970s, and supply chains are more diversified; policymakers also better understand the risks of repeating 1970s‑style mistakes.(lemonde.fr)
- Wage indexation (automatic link between wages and inflation) is weaker, reducing the risk of a persistent wage‑price spiral.
What this analogue suggests
- If, in the next 12 months:
- Oil and commodity prices stay high or rise further,
- CPI and core PCE accelerate back above 4–5% year‑over‑year, and
- Unemployment climbs into the 5–6%+ range while the Fed feels constrained from hiking aggressively,
- then markets could face a stagflation scare reminiscent of the 1970s.
- In that environment, history shows that equities struggle to keep up with inflation, and defensive or real‑asset sectors (energy, commodities, certain value stocks) tend to fare better than broad growth benchmarks.(momoview.com)
4. The next 12 months: three scenarios
Think of this as a map of possibilities, not a prediction. Each scenario is an “if‑then” statement: if the data move a certain way, then markets are more likely to behave in a certain range.
Scenario A: Soft‑landing drift higher (constructive)
Conditions
- CPI and core PCE average about 2–3% year‑over‑year.
- Unemployment stays in the 4–5% range without a sharp spike.
- The Middle East conflict remains contained; oil stabilizes rather than trending ever higher.
- The Fed continues gradual cuts (for example, from 3.64% toward the 2.5–3.0% area) and signals patience.
Macro logic
- With inflation manageable and jobs only slightly weaker, the Fed can carefully remove the brakes without reigniting a price spiral.
- Earnings grow modestly; lower discount rates support valuations but do not need to expand dramatically from already‑high levels.
Implications for the S&P 500
- From ~7200, a further +5–15% over 12 months is plausible in this setup.
- Given the strong gains already, the path is unlikely to be smooth; think upward trend with one or two 8–12% pullbacks.
Scenario B: Macro whiplash and a choppy range (neutral)
Conditions
- Inflation data surprise in both directions month to month (a hot print here, a cool print there), but the 12‑month rate stays in the 2–3% band overall.
- Unemployment drifts within 4–5%, with no clear trend.
- Policy and geopolitical headlines (tariffs, regulatory moves, flare‑ups in conflict) hit periodically but do not escalate into full‑scale crises.
- The Fed repeats “data‑dependent” and adjusts the pace (not the direction) of cuts.
Macro logic
- Investors lurch between “inflation is back” and “growth is cracking” every few weeks.
- The big picture—moderate inflation, falling but positive real yields—doesn’t change, but sentiment cycles quickly.
Implications for the S&P 500
- The index may trade in a broad range, for example somewhere around 6500–7700, without a clear trend.
- Rallies toward the top of the range run into valuation and macro worries; dips toward the bottom attract “buy the dip” flows because the easing cycle is still in place.
- For beginners, this environment rewards time‑diversified strategies (dollar‑cost averaging, staged entries/exits) more than short‑term trading on every headline.
Scenario C: Stagflation scare (adverse)
Conditions
- Oil and other commodities stay elevated or keep rising (for example, crude holds well above $100 for many months).
- CPI and core PCE re‑accelerate toward 4–5%+ year‑over‑year.
- Unemployment jumps into the 5–6% or higher range as growth slows.
- The Fed hesitates: cuts slow or halt, or even re‑hikes to defend its inflation target.
Macro logic
- The economy faces a bad mix: weak growth, rising joblessness, and sticky inflation.
- Policy is cornered: cutting risks reigniting inflation; hiking deepens the downturn.
- This echoes the 1970s pattern of “stagflation,” which historically hurt both stocks and bonds while benefiting some real assets.(momoview.com)
Implications for the S&P 500
- History shows that each major oil shock since 1970 has coincided with or worsened a bear market in the S&P 500.(fool.com)
- In this scenario, a 20%‑plus drawdown from peak levels (for example, 7200 → ~5800) over 12 months would not be surprising.
- Sector performance would likely diverge sharply: energy and some defensive/value stocks could outperform, while broad growth and long‑duration names struggle.
Importantly, this is a risk scenario, not the base case implied by today’s data; but it is the one markets are starting to price into options and risk premiums when stagflation headlines spike.
5. For beginners: “So this is why the market swings”
Boiling all of this down into a few plain‑language ideas:
-
Direction beats level.
- Markets care more about whether rates, inflation, and unemployment are heading up or down next than about their exact level today.
- Right now, the big story is rates down, inflation slower, unemployment slightly up.
-
From “runaway” to “manageable” inflation, markets breathe easier.
- After the 2022 spike, U.S. inflation slowing into the 2–3% range helped unlock the 2023–26 stock rally.
- As long as inflation doesn’t bounce back above 4–5%, investors feel they can value companies with more confidence.
-
Shocks cause overshoots in both directions.
- The 2025 tariff shock (-17%) and 2026 war/energy shock (-8%) were followed by +17% and +13% rebounds.
- Selling in the middle of peak fear often means buying back higher later when the situation proves “bad but manageable.”
-
Unemployment is about trend, not just a number.
- 4.3% is not disaster; what matters is whether it glides sideways or spikes quickly upward.
- A jump toward 5–6% would tilt the odds toward a recession‑style scenario.
-
Markets have emotional cycles.
- Optimism and fear alternate. Good news can keep pushing already‑high prices higher; bad news can drag them below fair value.
- Understanding the macro context helps you see why those emotional waves happen instead of just reacting to them.
6. A practical checklist for the next 12 months
Here is a simple checklist you can reuse. You don’t need to predict; just watch the dials and update which scenario seems more likely.
-
CPI & core PCE (monthly)
- Ask: “Are 12‑month inflation rates staying around 2–3%, or drifting toward 4–5%+?”
- 2–3% → tilts toward Scenario A/B.
- 4–5%+ with high oil → tilts toward Scenario C.
-
Unemployment (monthly/quarterly)
- Ask: “From 4.3% today, are we heading toward 4–5% or 5–6%+?”
- Flat in the low‑4s → supports a soft‑landing / range‑bound view.
- Sharp rise into 5–6% → raises recession/stagflation risk.
-
Fed communication (after each FOMC meeting)
- Watch for hints about slower cuts, pauses, or re‑hikes if inflation re‑accelerates.
- A more hawkish tone is usually a warning for high‑valuation and long‑duration stocks.
-
Oil prices and Middle East headlines
- Short spikes that fade quickly are one thing; sustained high prices are another.
- A prolonged period of $100+ oil, combined with rising unemployment, would push the narrative toward stagflation.
-
Where the S&P 500 sits in its own range
- Near new highs (for example, above 7500–7700), ask: “How much good news is already priced in?”
- After a 10–20% drop (for example, 6500 or below), if the macro dials haven’t broken, consider whether fear has overshot.
In short, the next 12 months are likely to fall somewhere between a soft‑landing glide and a choppy range, with a stagflation scare as the main downside risk. Markets are not predictable, but they are understandable: by watching how inflation, rates, jobs, and energy interact, you can see why the S&P 500 moves the way it does—and make calmer decisions when it does.