U.S. Stock Market Analysis: Retail Industry Polarization and Labor Market Uncertainty
Market Analysis Report - November 21, 2025
Executive Summary
In the third week of November 2025, the U.S. retail sector revealed a stark divide. While Walmart surged on better-than-expected earnings, Target confirmed a four-year stagnation period with declining sales. Meanwhile, the delayed September jobs report—released seven weeks late due to a 44-day government shutdown—has intensified uncertainty surrounding the Fed's December rate decision.
1. Walmart's Triumph: Transformation into a Tech Company
Earnings Highlights
Walmart reported its Q3 earnings on November 20, delivering impressive results that exceeded market expectations:
- Revenue Growth: 5.8% year-over-year
- E-commerce Growth: 27% globally, 28% in the U.S.
- Stock Surge: 6.5% jump following earnings announcement
- Raised Full-Year Guidance: 4.8-5.1% (up from 3.75-4.75%)
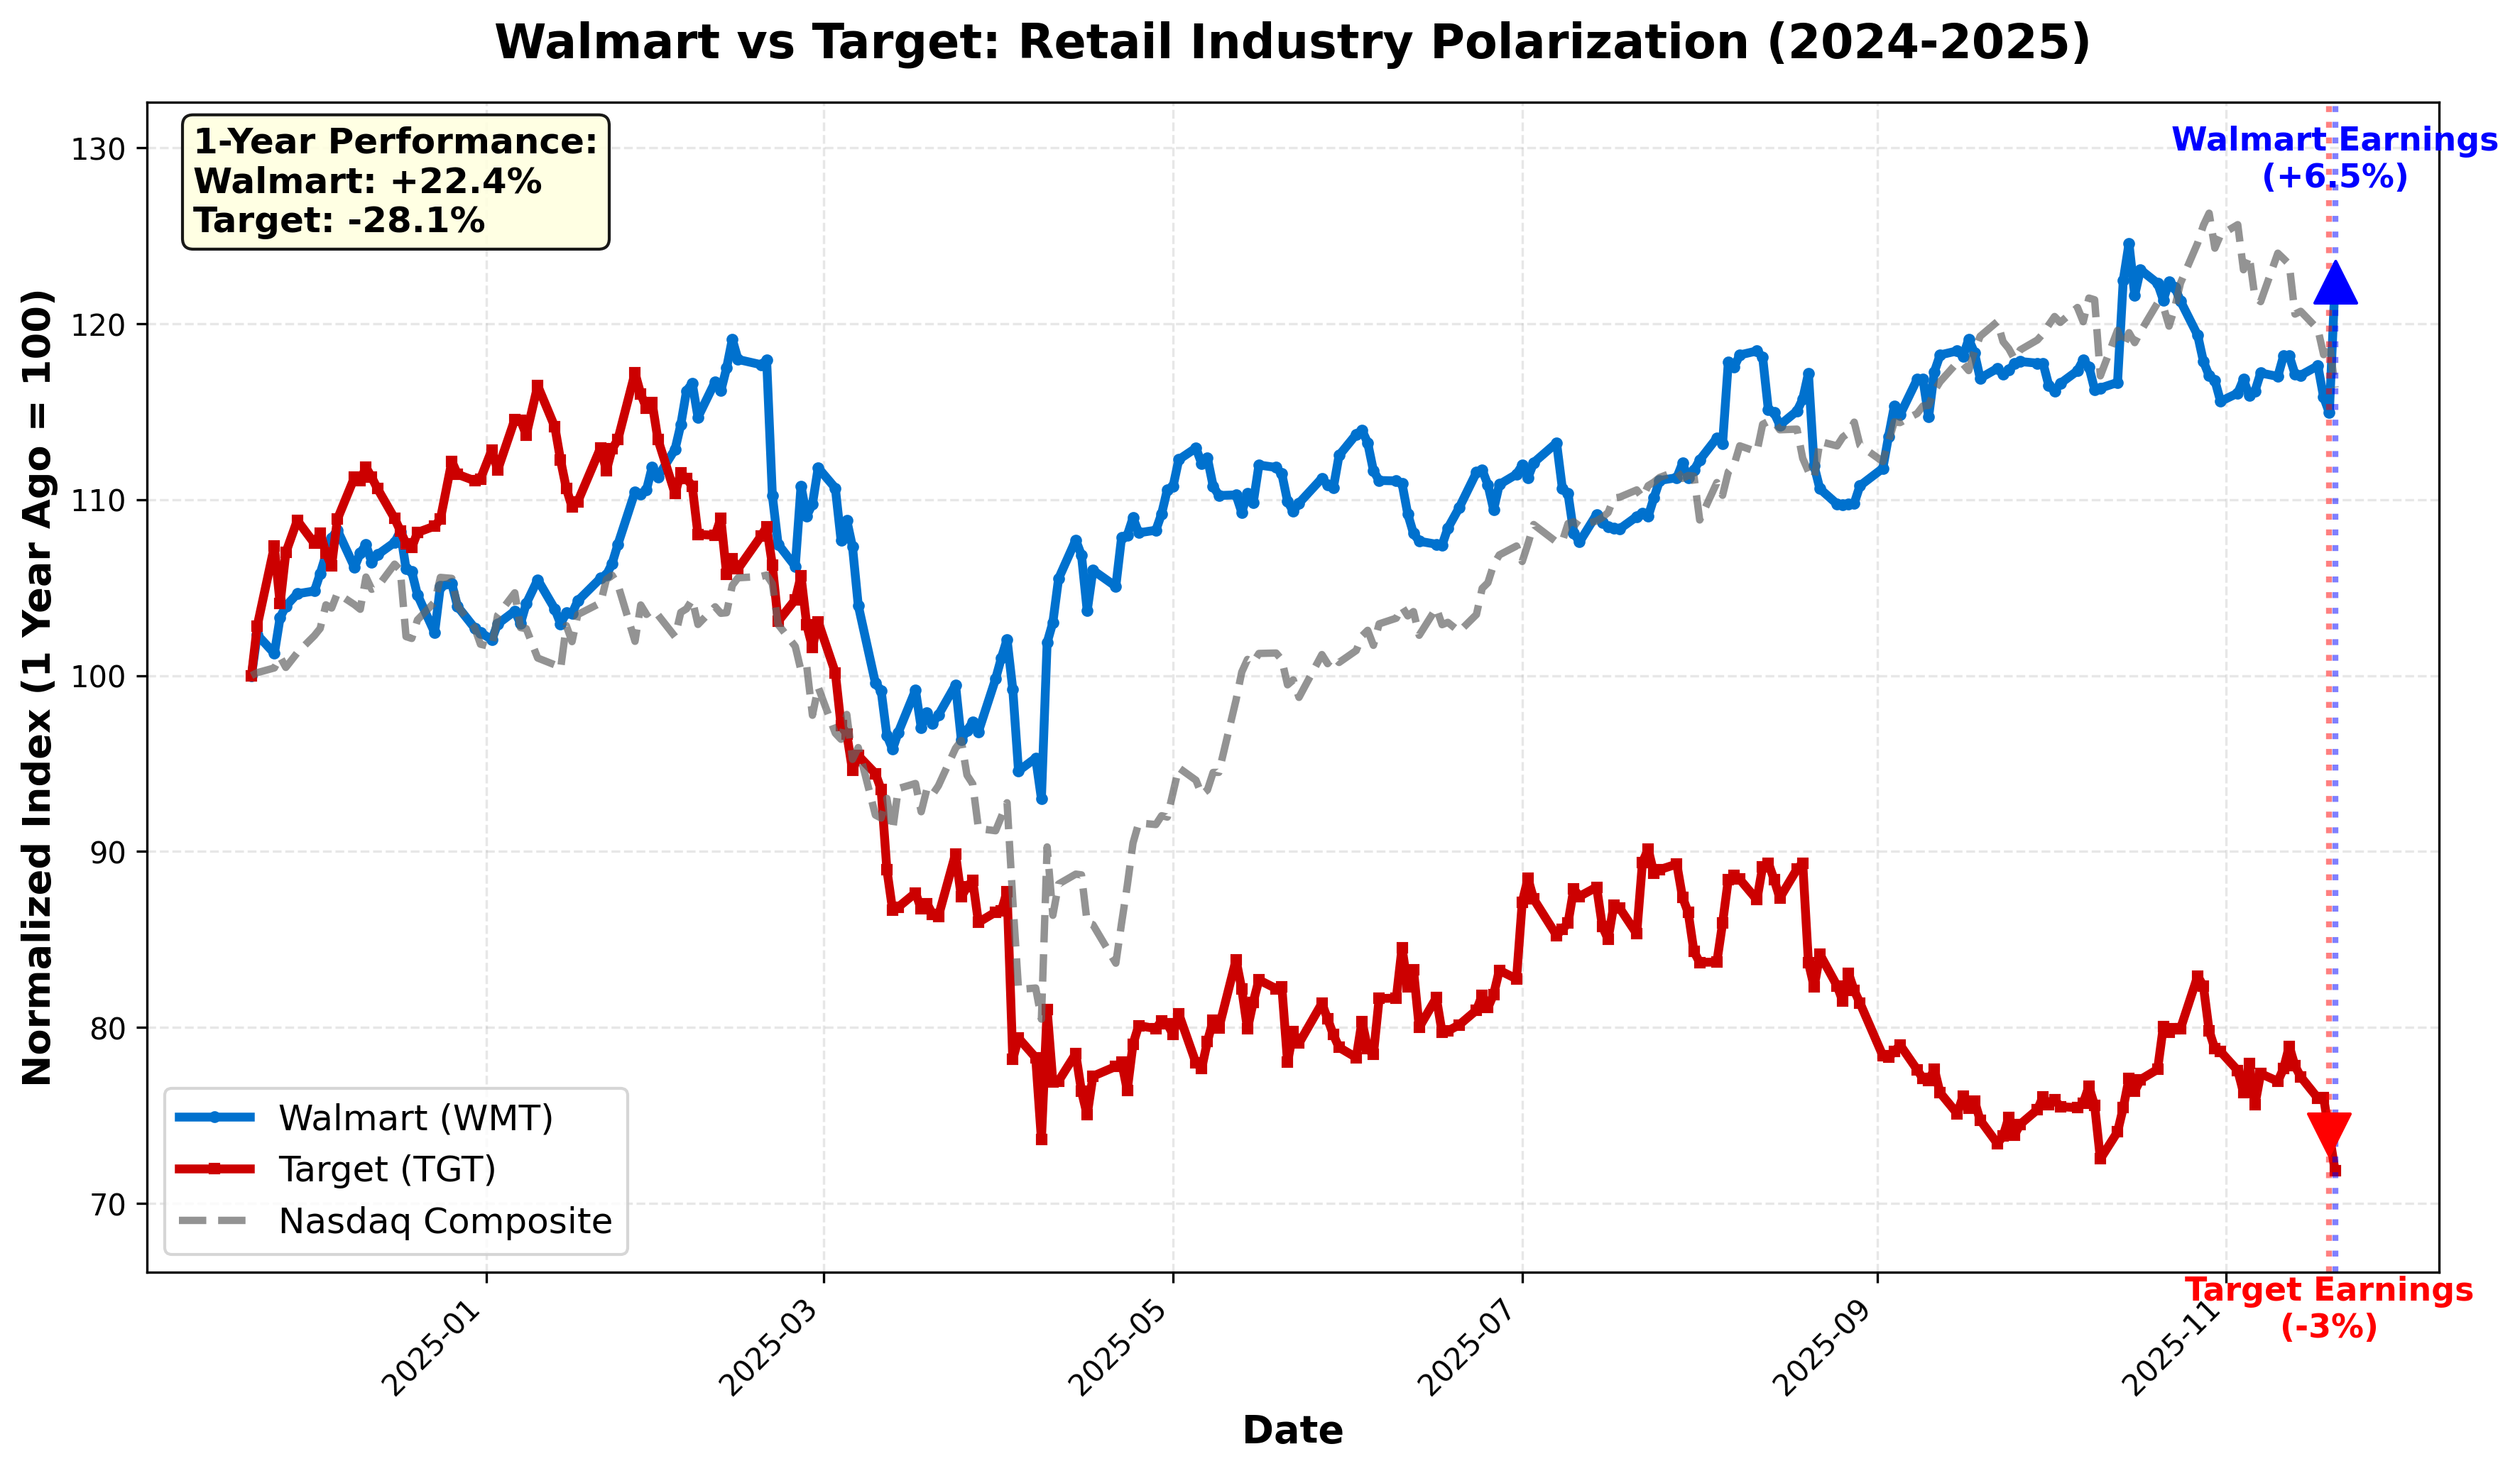
Chart 1 demonstrates how Walmart (blue line) significantly outpaced both the Nasdaq index and Target over the past year. The sharp spike on November 20, marked by the blue arrow, shows the market's enthusiastic response to the earnings beat.
Success Factors Analysis
Walmart's success stems from three core strategies:
-
High-Income Customer Acquisition: CFO John David Rainey stated, "We're gaining customers across all income levels, but the increase in higher-income households is particularly notable." In an inflationary environment, even households earning over $100,000 are gravitating toward Walmart's value proposition.
-
Ultra-Fast Delivery Infrastructure: One-to-three-hour delivery orders now account for one-third of total e-commerce, establishing logistics capabilities that rival Amazon's network.
-
Tech Platform Transformation: With advertising revenue up 53% year-over-year and expanding marketplace and AI initiatives, Walmart is evolving beyond traditional retail into a platform company. The announcement of its December 9 migration from NYSE to Nasdaq reinforces this "technology-focused company" image.
Market Implications
Chart 1's performance box (yellow box in upper left) shows Walmart's substantial positive return over the year while Target posted negative returns. This illustrates the lesson that companies with clear "value propositions" win during economic downturns. Walmart didn't rely solely on low prices—it diversified through delivery speed, membership (Walmart+), and advertising revenue streams to achieve sustainable growth.
2. Target's Decline: Four Years of Stagnation and Uncertain Future
Earnings Shock
Target's November 19 earnings release shocked the market:
- Revenue Decline: Down 1.5% year-over-year ($25.27 billion)
- Comparable Sales: Down 2.7%
- Net Income Plunge: Down 19%
- Stock Performance: Fell 3% post-earnings, hitting a 52-week low
Incoming CEO Michael Fiddelke offered an uncertain outlook, stating he "can't say when sales will start growing again." Despite this, the company announced plans to increase capital expenditures by 25% to $5 billion next year, though market confidence remained shaken.
Long-Term Decline Trend
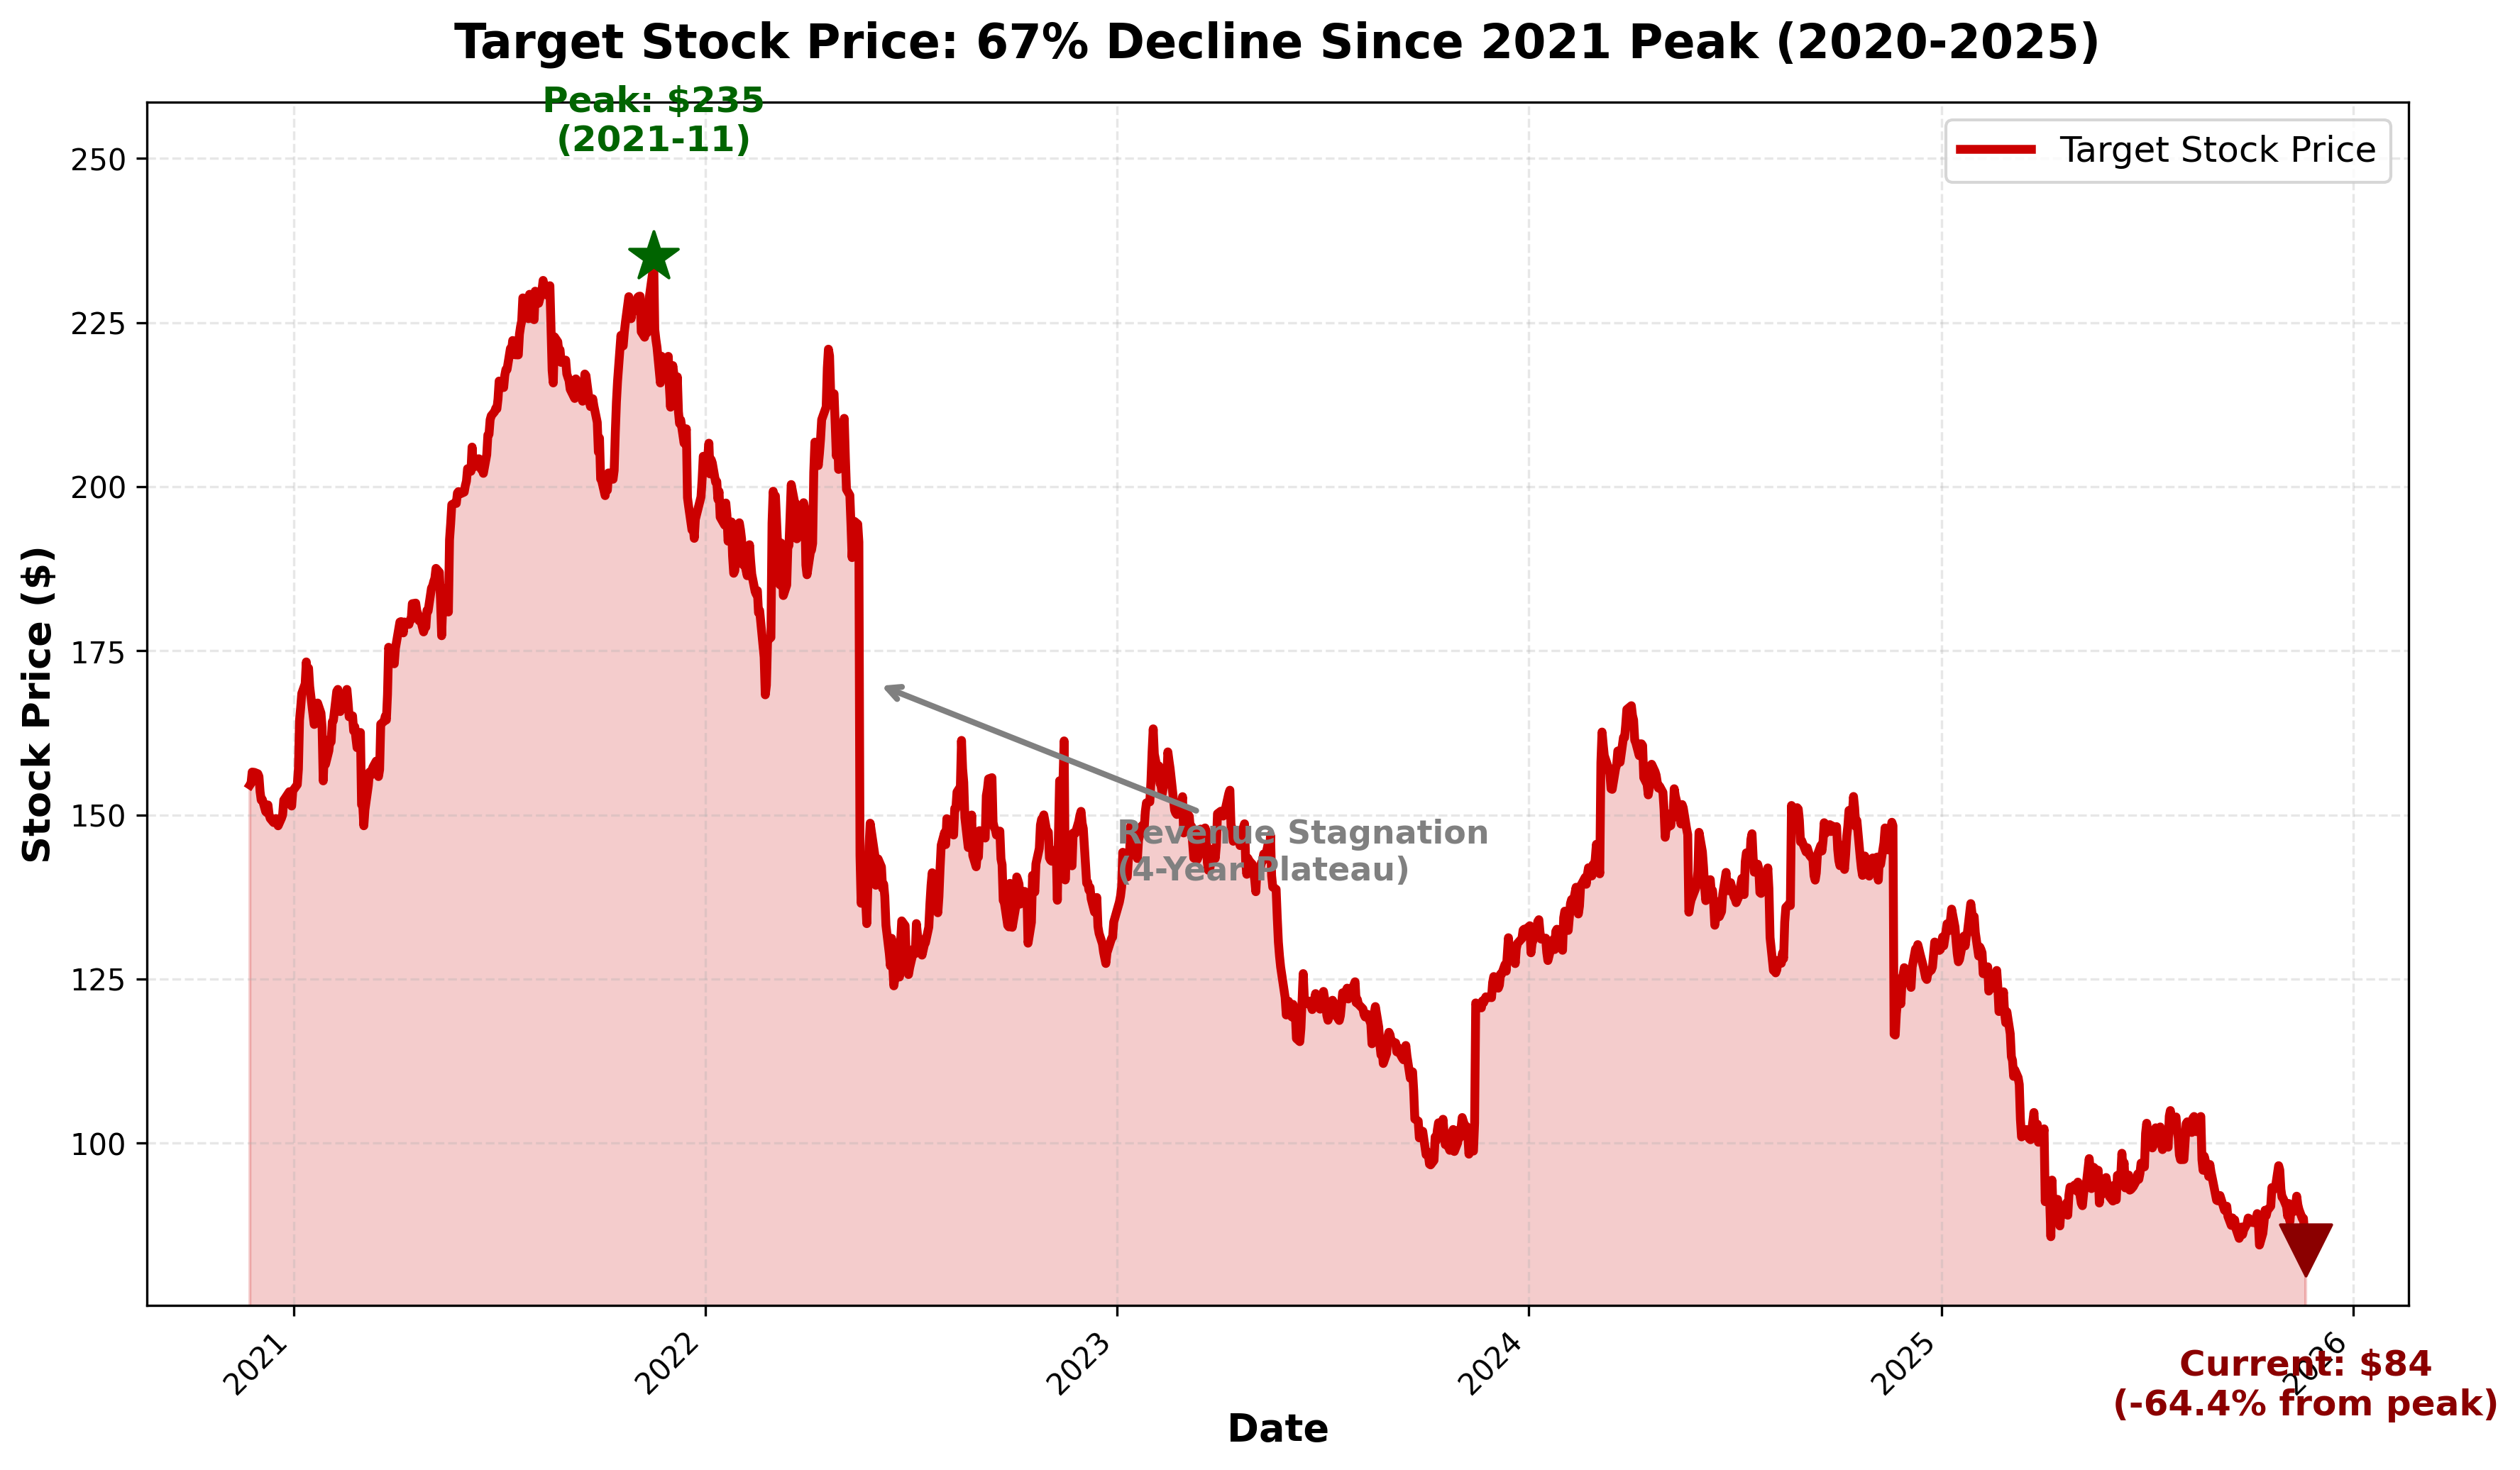
Chart 2 vividly illustrates Target's tragedy. The stock has plummeted 67% from its 2021 peak (green star) to the current price (red arrow), with four years of sideways movement indicating persistent revenue stagnation.
Key events marked on the chart:
- 2020-2021: COVID-19 online shopping boom drives stock to all-time high
- 2022 onwards: Revenue stagnation begins, entering 4-year plateau phase
- 2025: Current price down 67% from peak
Failure Factors
Target's decline stems from several structural issues:
-
Digital Transformation Lag: Target's digital sales grew just 2.4%, starkly contrasting with Walmart's 28% growth.
-
Weakened Brand Identity: Once beloved as "Cheap Chic," Target has suffered from deteriorating store conditions and weakened exclusive product lines.
-
Losing the Value Battle: In an inflationary era, consumers gravitate toward stores offering the trifecta of "convenience + price + inventory," and Target fell short on all three compared to Walmart.
-
Strategic Missteps: Consumer backlash over DEI policy reversals and slow e-commerce investment left Target lagging behind competitors in adapting to change.
Lessons Learned
Chart 2's long-term decline delivers a harsh lesson: "past success formulas don't guarantee future results." Brand image alone isn't sufficient. When competitors rapidly evolve, complacency or maintaining the status quo leads to market obsolescence. Target's lesson is that resting on laurels invites displacement.
3. Labor Market Fog: Delayed Data and the Fed's Dilemma
Seven-Week Delayed September Report
The Bureau of Labor Statistics (BLS) released the September jobs report on November 20—44 days after its originally scheduled October 3 publication date. The unprecedented delay resulted from the government shutdown.
Key Indicators:
- New Jobs: 119,000 (well above 50,000 market estimate)
- Unemployment Rate: Rose from 4.3% to 4.4%
- August Jobs Revised: From 22,000 to -4,000 (actual decline)
- July Jobs Revised: From 79,000 down to 72,000
- Wage Growth: 0.2% (monthly), 3.8% (annually)
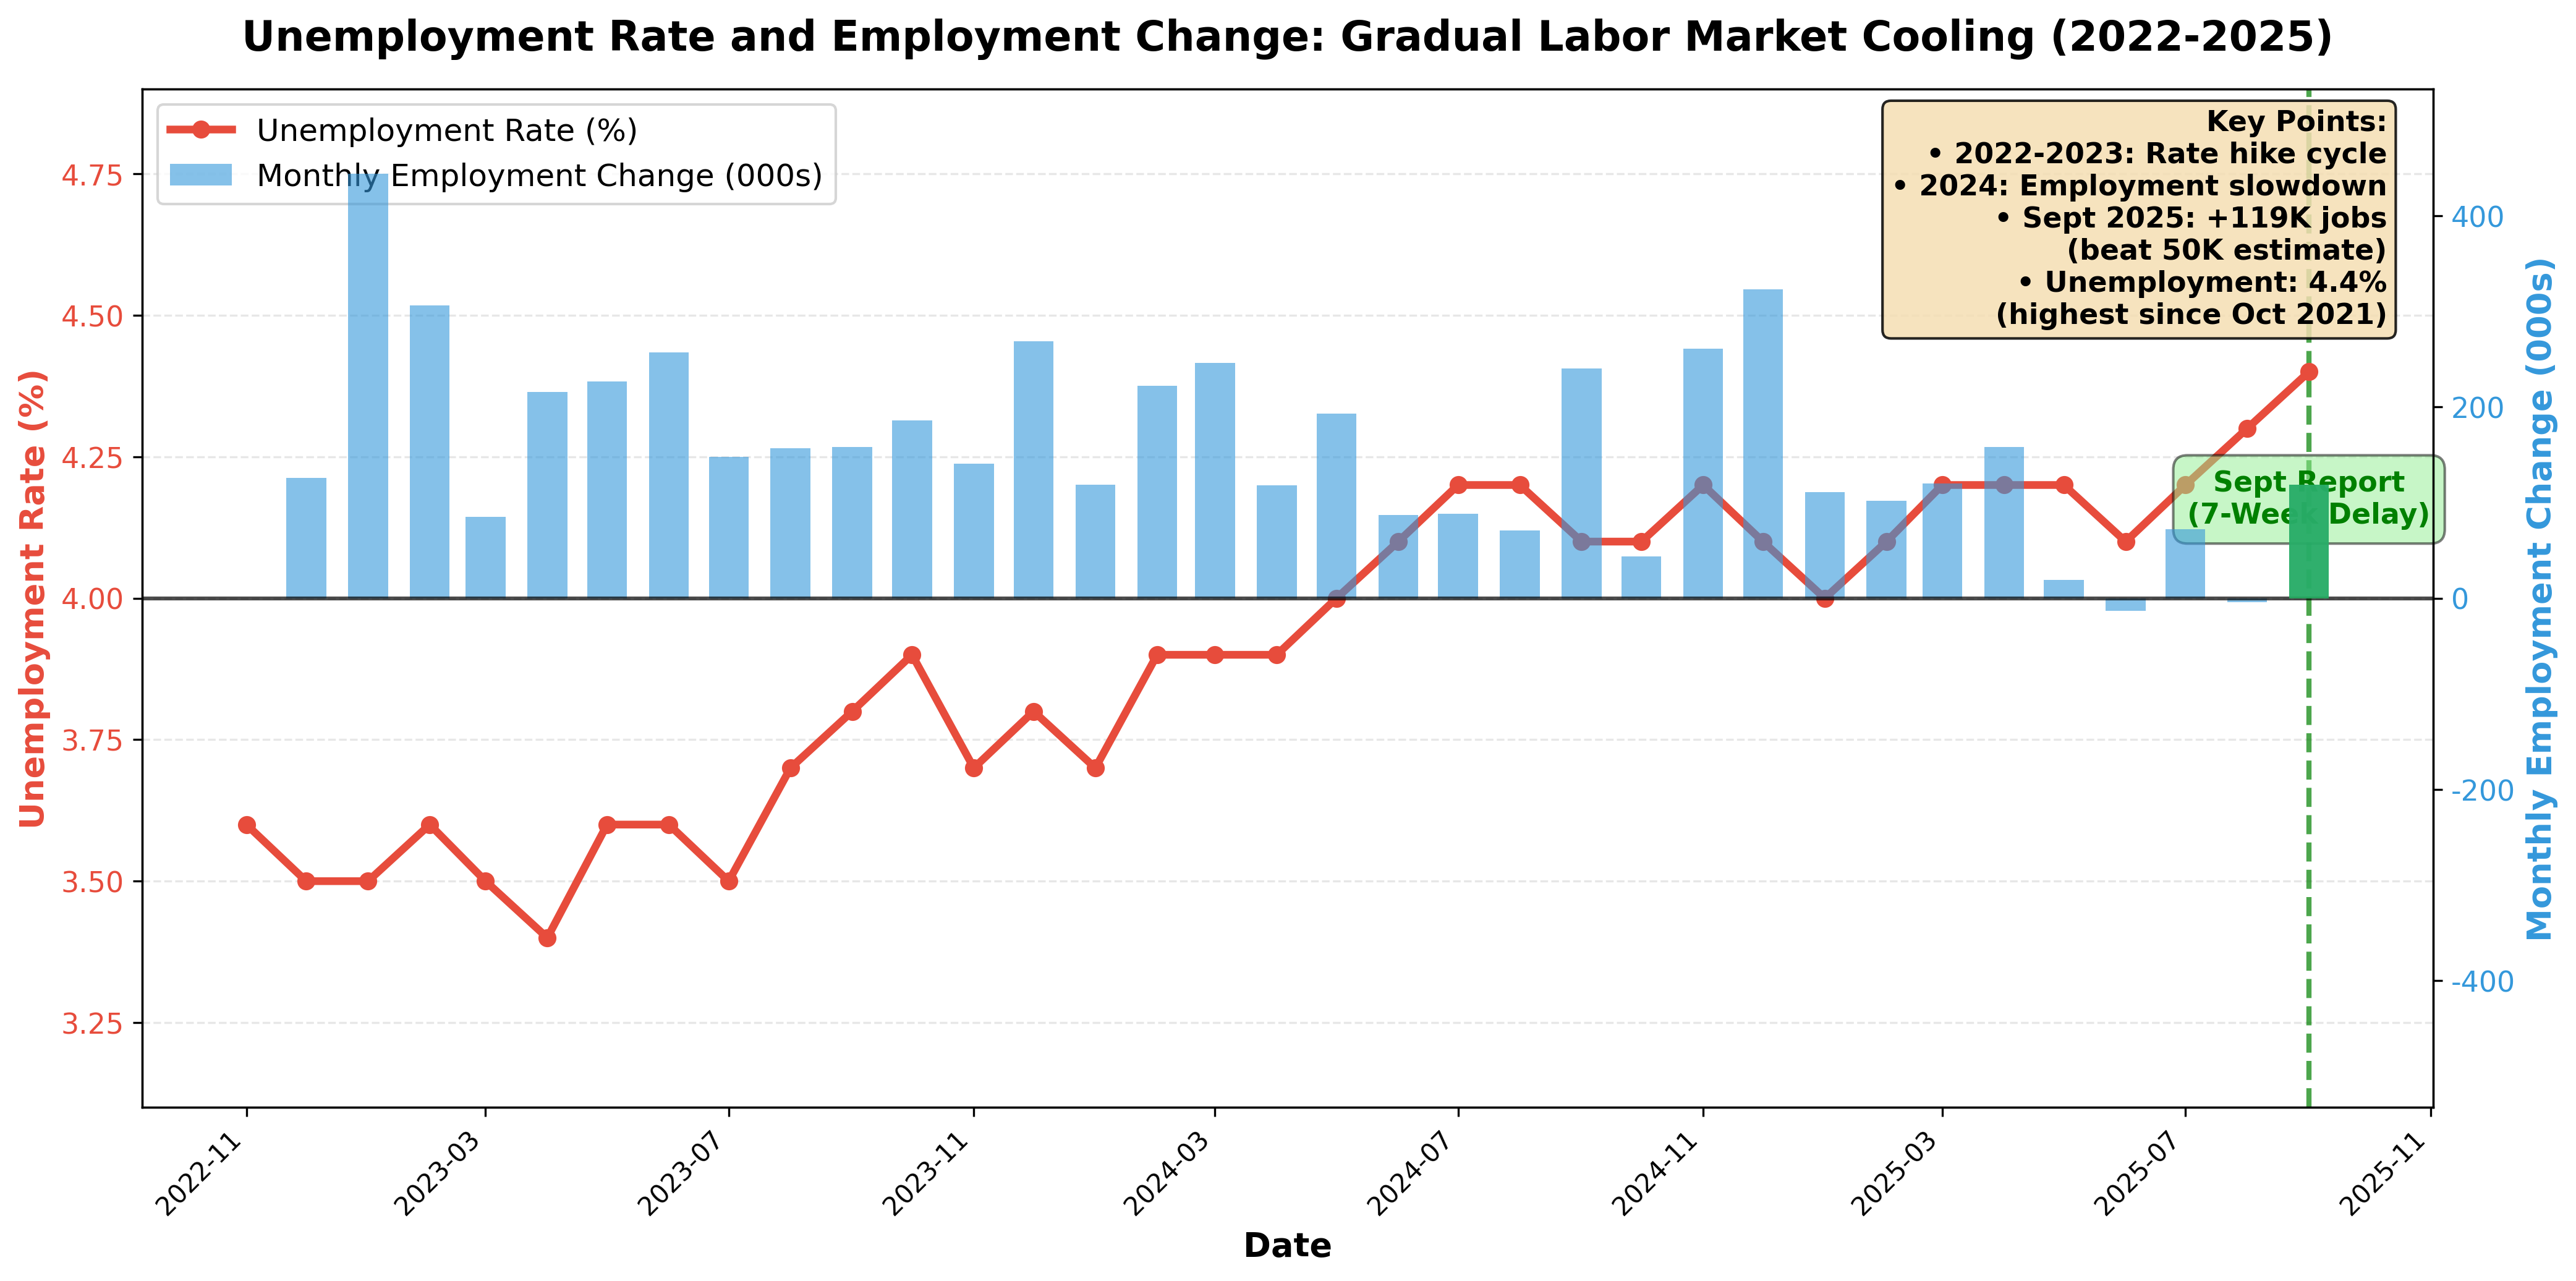
Chart 3 shows the gradual labor market cooling over the past three years. The red line represents unemployment, while blue bars show monthly employment changes. September 2025 data (119,000 jobs added), highlighted in green with an arrow and text box, marks the 7-week delayed report.
The wheat-colored box in the upper right shows:
- 2022-2023: Rate hike cycle driving employment volatility
- 2024: Employment slowdown begins
- September 2025: +119,000 jobs (beating 50,000 estimate)
- Unemployment: 4.4% (highest since October 2021)
The Fed's December Dilemma
The critical issue is that Chart 3 only displays data through September. The November jobs report releases on December 16—after the Fed's December 9-10 FOMC meeting. This means the Fed must make rate decisions without the latest employment data, facing a "driving in fog" scenario.
Fed Chair Powell used the analogy, "when driving in fog, you slow down," signaling a cautious approach. Markets interpreted this as signaling a potential December rate hold.
Market Impact
Chart 3's unemployment trend (red line) shows gradual increases from the 2022 low, but not a sharp deterioration. Employment changes (blue bars) fluctuate between positive and negative but show no massive declines. This suggests the labor market is in a phase of "gradual normalization" rather than "rapid cooling."
The September report's unemployment increase is explained by labor force entry (450,000 people) rather than job losses—interpreted as renewed job-seeking activity. This signals a still-healthy labor market, but the data gap makes it difficult for the Fed to make preemptive judgments.
4. Comprehensive Analysis and Investment Insights
Retail Sector: Winners and Losers Contrasted
Chart 1's comparison graph starkly illustrates how strategic differences within the same retail industry produced dramatically different stock performance. Walmart (blue line) trends upward, Target (red line) trends downward, diverging significantly from the Nasdaq index (gray dotted line).
Walmart's Winning Formula:
- Low prices + fast delivery + online convenience
- Broad customer base reaching high-income segments
- Revenue diversification through advertising and marketplace
- Reinforced tech company image (Nasdaq migration)
Target's Problems:
- Strategy over-reliant on brand image
- Digital transformation lag (2.4% vs Walmart's 28%)
- Poor store management and inventory shortages
- Slow change adaptation
Labor Market: Sustained Uncertainty
Chart 3's unemployment and employment change data indicate the labor market is undergoing "gradual normalization" rather than "rapid cooling." However, data gaps (October report canceled, November report mid-December) amplify market uncertainty.
The Fed's cautious approach amid data scarcity demonstrates the principle that "waiting beats guessing when uncertain." For investors, predicting direction before the December FOMC is difficult, requiring preparation for expanded volatility.
Investment Strategy Recommendations
-
Retail Sector: As Charts 1 and 2 clearly show, polarization within the same industry is intensifying. Focus on continuously innovating companies like Walmart rather than those plateauing for four years like Target.
-
Rate-Sensitive Stocks: Given Chart 3's employment data, aggressive rate cuts seem unlikely. If December holds rates steady, prioritize companies that can perform in higher-rate environments.
-
Defensive Positioning: Recognize that political events like government shutdowns can directly impact economic data and policy. When uncertainty is high, consider increasing cash positions or adding defensive stocks.
-
Tech-Transforming Companies: Walmart's Nasdaq migration and advertising business growth suggest traditional companies' tech transformations can trigger stock revaluations. Monitor business model innovation beyond simple valuations.
Conclusion: Market Truths Revealed by Data
This week's earnings and economic indicators confirm two core themes for the 2025 U.S. market.
First, adaptability determines survival during downturns. Comparing Charts 1 and 2 side-by-side reveals how starkly Walmart and Target's fates diverged. Target, complacent with past success, fell 67% from its 2021 peak (Chart 2), while continuously evolving Walmart outpaced even the Nasdaq (Chart 1).
Second, data gaps amplify market volatility. Chart 3 shows employment data only through September, yet the Fed must decide December rates without November data. This gap created by the government shutdown forces investors to "drive in fog."
The contrasts in retail and labor market uncertainty both convey the same lesson: only those who adapt quickly to change and judge carefully amid uncertainty will survive.
Chart Descriptions
This analysis includes three independent charts:
Chart 1: Walmart vs Target vs Nasdaq (1-Year Comparison)
chart1_walmart_vs_target.png
- Blue line (Walmart), red line (Target), gray dotted line (Nasdaq)
- Arrows marking November earnings announcement dates
- Yellow box summarizing 1-year performance
Chart 2: Target 5-Year Stock Price Trend
chart2_target_5year.png
- 2021 peak (green star) and current price (red arrow)
- Percentage decline from peak displayed
- Annotations for COVID shopping boom and revenue stagnation period
Chart 3: Unemployment Rate and Employment Change (3-Year)
chart3_employment.png
- Red line: Unemployment rate (left axis)
- Blue bars: Monthly employment change (right axis)
- Green highlight: 7-week delayed September report
- Wheat-colored box summarizing key points
Publication Date: November 21, 2025 Data Sources: Yahoo Finance (stock prices), FRED (employment data), company earnings releases
Comments (0)
No comments yet. Be the first to comment!