The Rule-Based Trading Trap: Why Your "Smart" Stop-Loss Strategy Is Quietly Destroying Your Returns
A data-driven reality check on mechanical trading rules
The Seductive Promise
You've probably heard it before. Maybe from a finance guru, a trading influencer, or that friend who "cracked the market":
"Just set a 10% stop-loss and 20% take-profit. Lock in your wins, cut your losses. It's that simple."
It sounds intelligent. Disciplined. Mathematical. You're protecting your downside while capturing upside. The math seems to work: win +20% when you're right, lose only -10% when you're wrong. As long as you win more than 33% of the time, you should come out ahead, right?
Wrong.
We backtested this exact strategy on 20 volatile stocks from 2015-2025. The results aren't just disappointing—they're devastating.
How the "Smart" Strategy Works
Before we reveal the results, let's understand exactly what this rule-based approach does. It's deceptively simple:
The Rules:
- Buy with all available cash when you're not in a position
- Monitor daily: Check if the price hits your exit triggers
- Stop-loss trigger: If the stock drops 10% from your entry price, sell everything
- Take-profit trigger: If the stock rises 20% from your entry price, sell everything
- Exit execution: When triggered, sell at the next day's opening price
- Cooldown period: After selling, wait 30 days before buying again (to "let volatility settle")
- Repeat: After the cooldown, buy back in and start monitoring again
Example walkthrough:
- You buy TSLA at $100
- Your stop-loss is set at $90 (10% below entry)
- Your take-profit is set at $120 (20% above entry)
- If TSLA's intraday low touches $90, you exit the next day at the open price
- If TSLA's intraday high touches $120, you exit the next day at the open price
- After exiting, you sit in cash for 30 days before re-entering
Sounds systematic and disciplined, right? The kind of strategy that protects you from devastating losses while capturing healthy gains.
That's the theory. Now let's look at what actually happened.
The Experiment: Stop-Loss vs. Buy & Hold
We tested this rule-based strategy on 20 volatile stocks from 2015-2025:
- TSLA, NVDA, AMD, PLTR, CELH, COIN, GME, AMC, MSTR, SHOP, and 10 others
The benchmark? Simple buy-and-hold: buy on day one and hold through all the volatility.
Here's what we found:
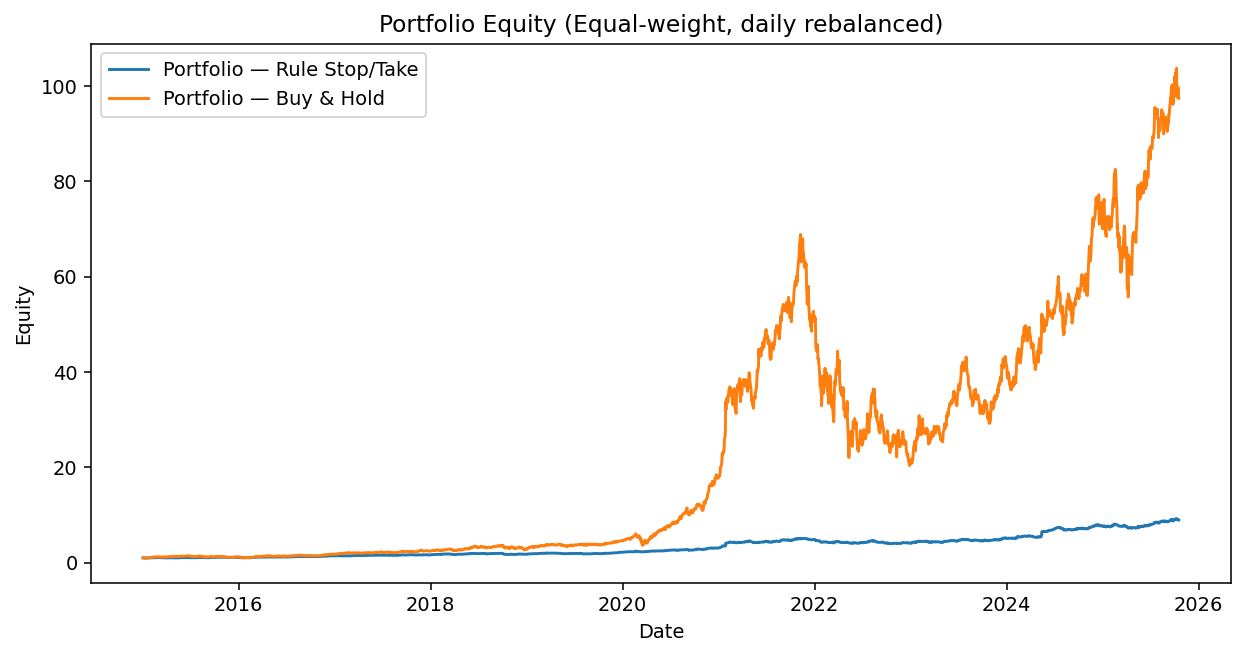 Caption: Portfolio equity curves comparing the 30-day cooldown rule-based strategy (blue line, flat at ~9x) vs. buy-and-hold (orange line, reaching 97x). The divergence is stark and devastating.
Portfolio Results (Equal-weight, 20 stocks, 2015-2025)
| Strategy | Final Equity | CAGR | Volatility | Sharpe | Max Drawdown |
|---|---|---|---|---|---|
| Buy & Hold | 97.5x | 53.0% | 40.5% | 1.25 | -70.4% |
| Rule-Based (30-day cooldown) | 8.9x | 22.6% | 14.8% | 1.45 | -21.8% |
The "smart" rule-based strategy delivered 8.9x returns while Buy & Hold delivered 97.5x.
That's not a typo. The disciplined, systematic approach destroyed 91% of potential gains.
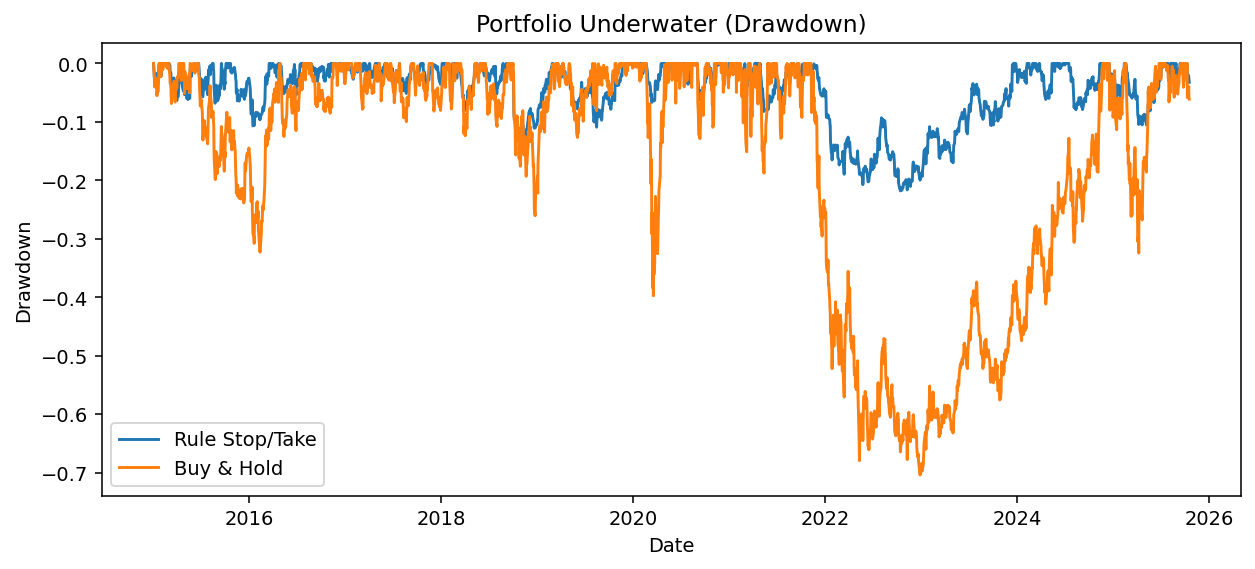 Caption: Drawdown comparison shows the rule-based strategy (blue) with shallower drawdowns, but at a catastrophic cost to returns. Notice how Buy & Hold (orange) experienced deeper drawdowns but recovered fully—while the rule strategy missed the recoveries.
Case Study: TSLA in 2023 - Where Smart Money Goes to Die
Let's zoom into one year (2023) for TSLA to see exactly how this strategy fails:
The Brutal Truth
- Strategy return: +22.6%
- Buy & Hold return: +129.9%
- Time in market: 38.4%
- Time in cash: 61.6%
You read that correctly. The "smart" rule-based strategy sat in cash for more than half the year while TSLA more than doubled.
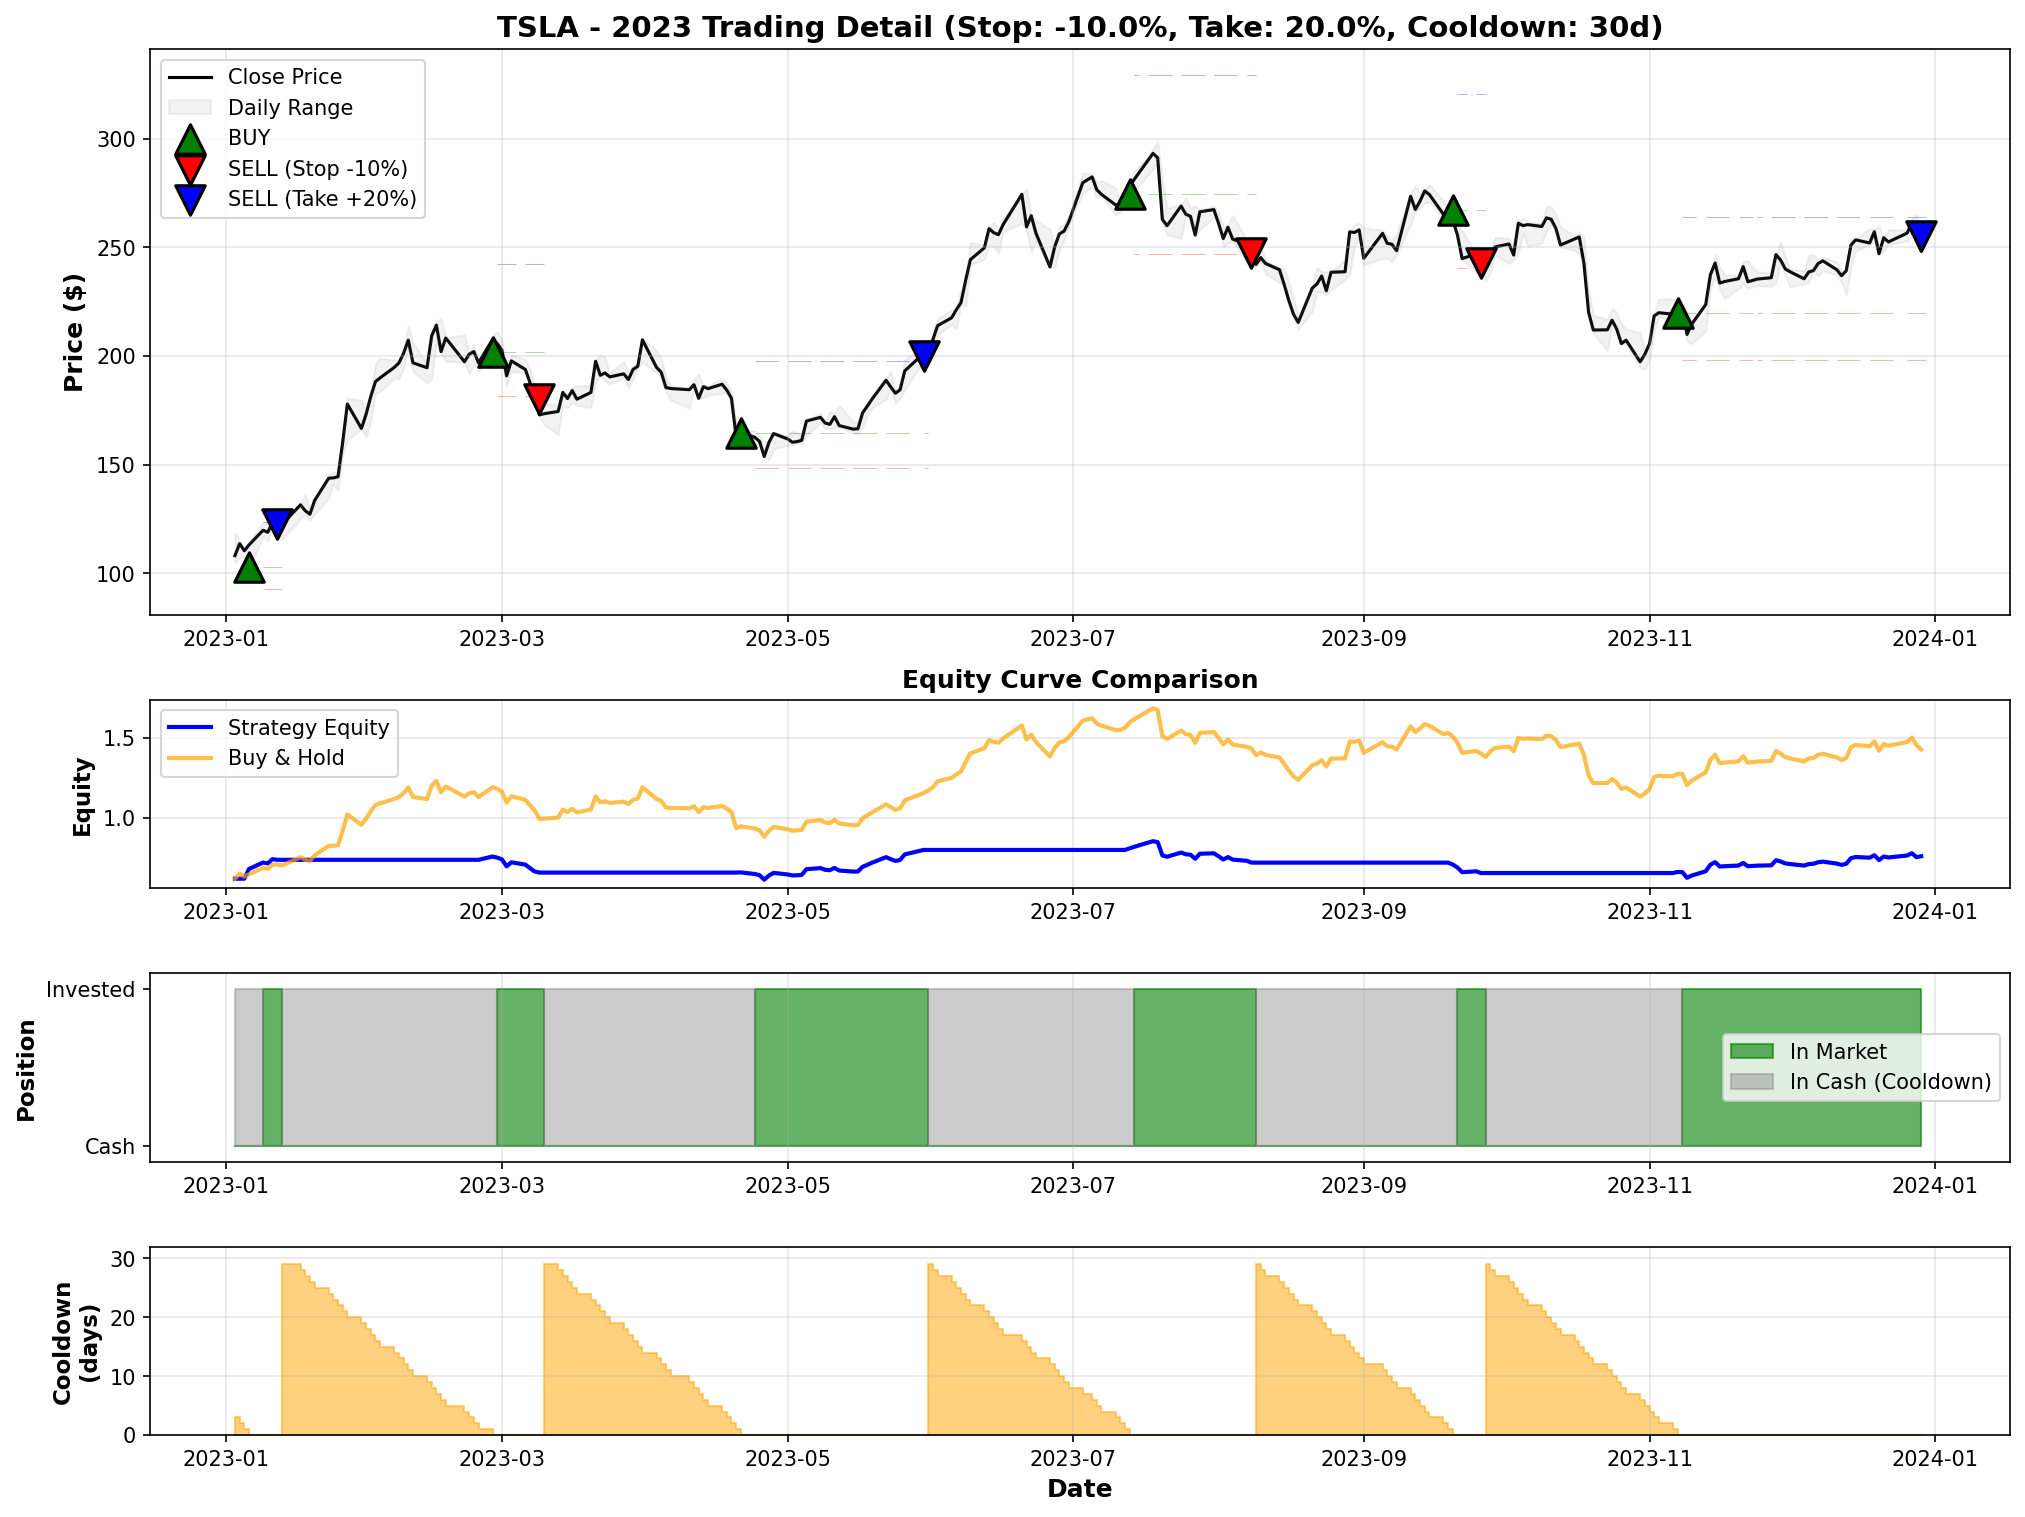 Caption: TSLA 2023 trading history breakdown. Top panel shows price with trade markers (green = buy, red = stop-loss, blue = take-profit). Second panel shows equity curves diverging dramatically. Third panel reveals the strategy spent 61.6% of the year in cash (gray). Bottom panel shows the 30-day cooldown countdown after each exit.
Trade-by-Trade Breakdown
Trade #3: The Perfect Example of Self-Sabotage
- April 21: Buy TSLA at $164.80
- May 30: Hit +20% take-profit, sell at $200.10 ✅ (Feeling smart!)
- May 31 - June 29: 30-day cooldown begins ⏳ (Cash earning 0%)
- Meanwhile, TSLA rallies to $270+ during your forced vacation 🚀
- July 13: Finally allowed to re-enter... at $274.59 (37% higher than your exit!)
- August 8: Get stopped out at $247.45 for -9.9% loss ❌
Net result of this "smart" sequence:
- Took +20% profit
- Missed +37% rally
- Lost -10% on re-entry
- Total opportunity cost: Turned a potential +60% gain into +10%
This happened repeatedly throughout the year.
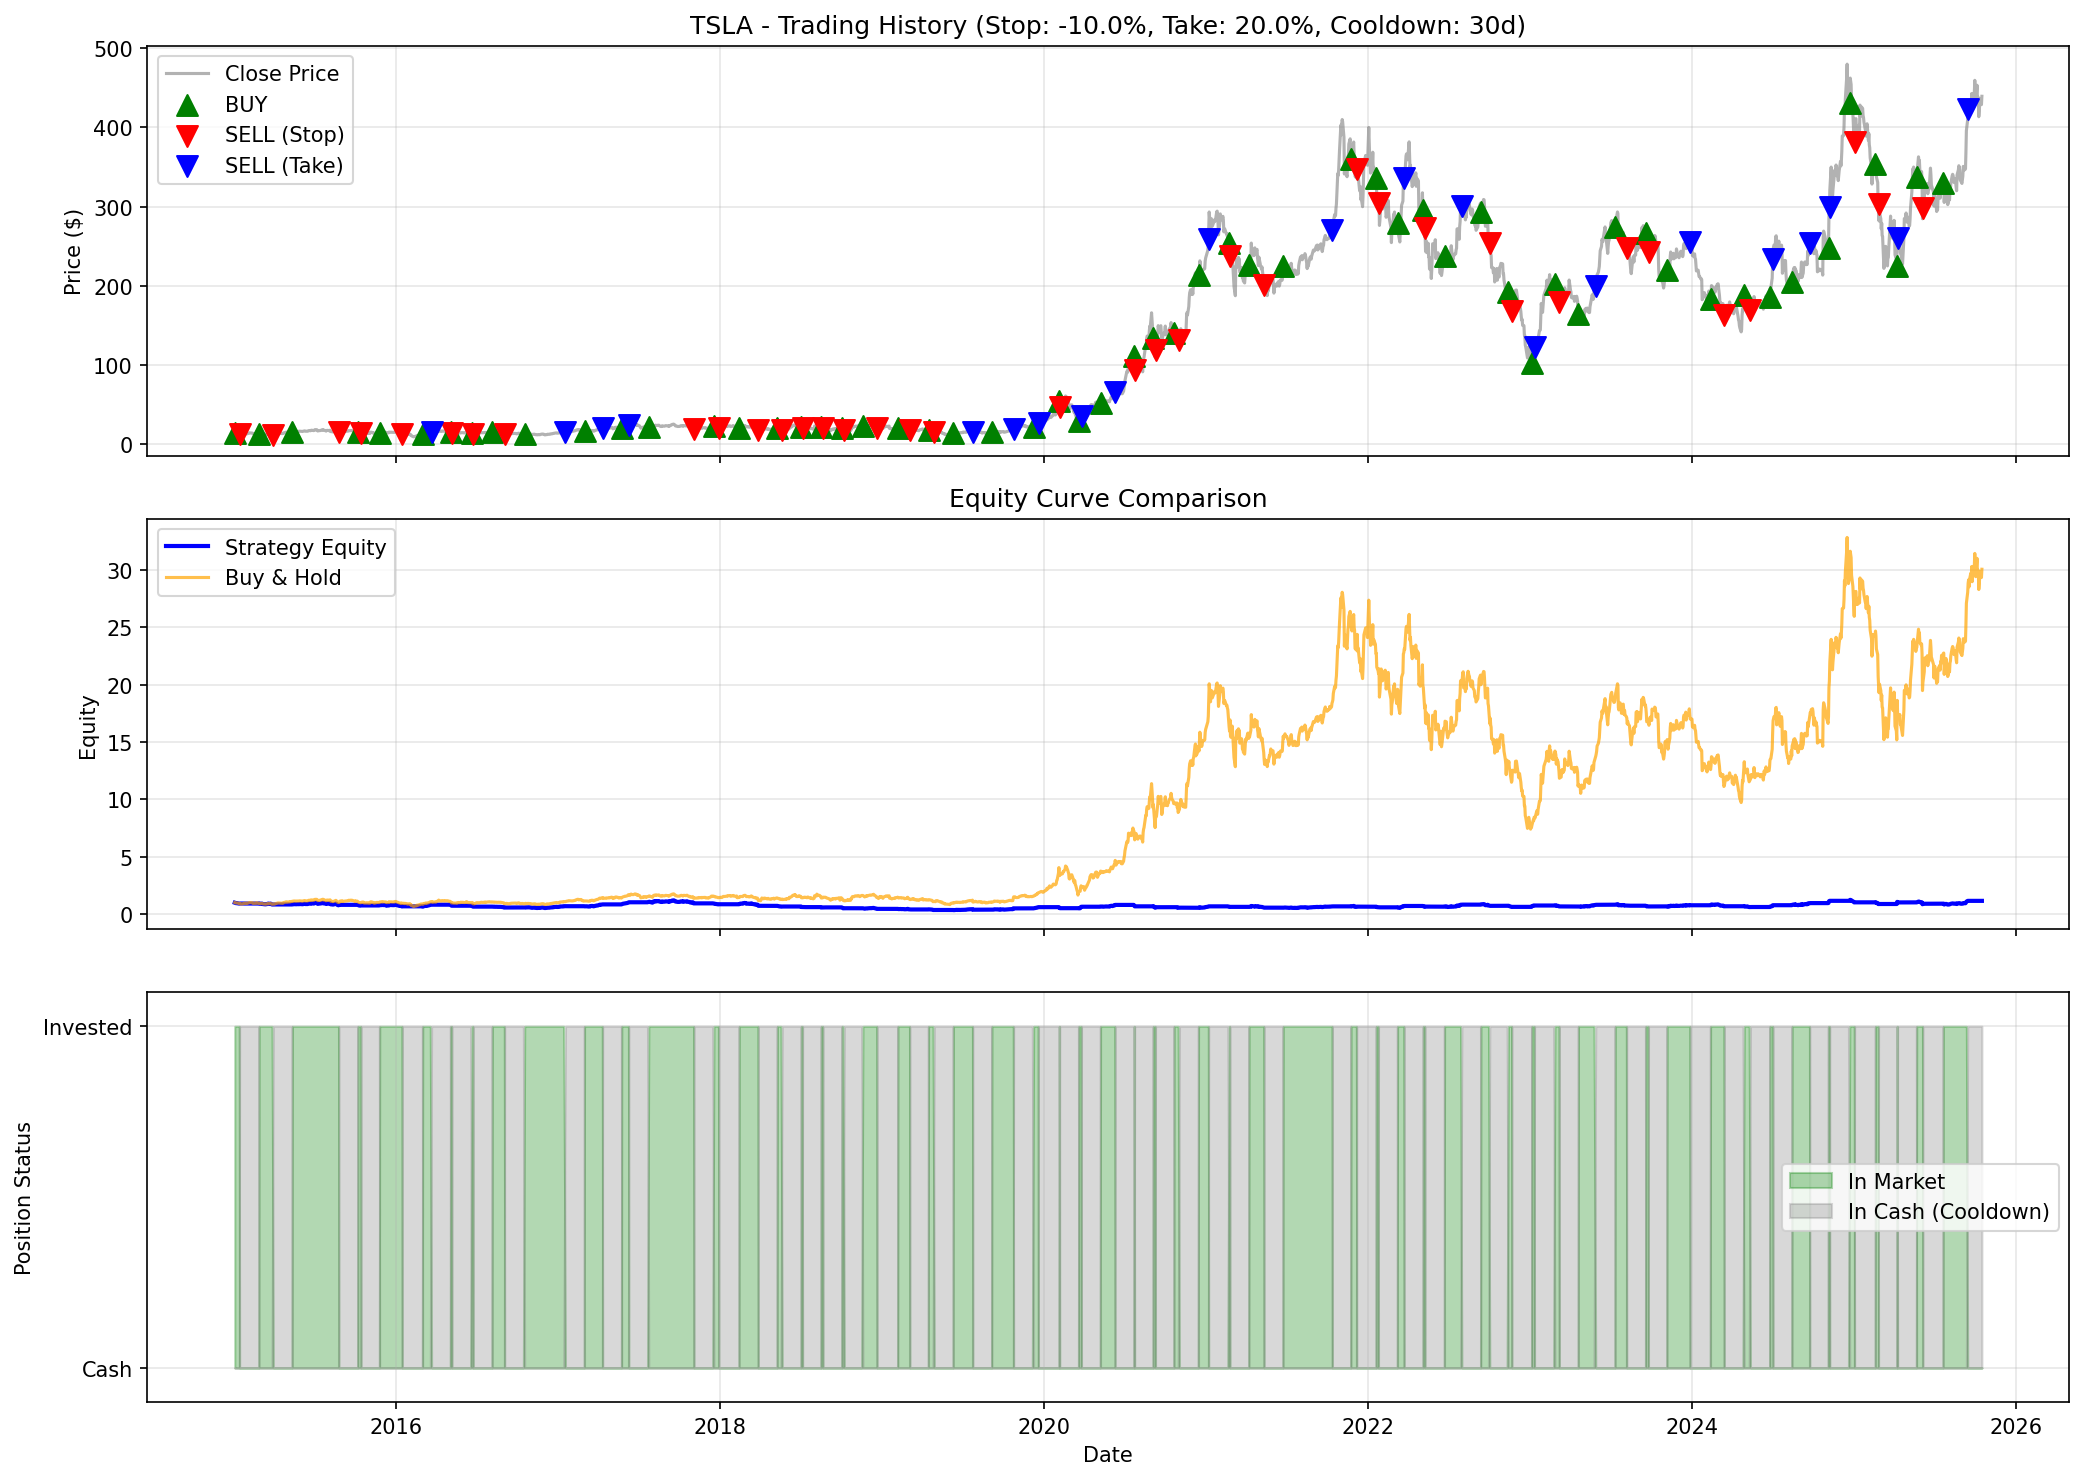 Caption: TSLA complete trading history (2015-2025) showing 58 total trades. Notice the overwhelming number of red triangles (stop-losses) versus blue triangles (take-profits). The equity curve (middle panel) shows the strategy ending at just 1.14x while Buy & Hold reached 30.05x—a 96% opportunity cost.
The Three Fatal Flaws of Rule-Based Trading
1. The Cash Drag Fallacy
Here's what nobody tells you: cash doesn't grow.
When you exit and enter a cooldown period, your money sits idle. In a bull market (which is most of the time historically), this is financial suicide.
TSLA 2015-2025 with 30-day cooldown:
- 58 trades total
- Win rate: 36.2%
- Average win: +21.7%
- Average loss: -10.1%
"Wait," you're thinking, "the wins are bigger than the losses! This should work!"
But you're forgetting: you were in cash 61.6% of the time.
- Buy & Hold final equity: 30.05x
- Rule-based final equity: 1.14x (only 14% total gain!)
The math that looked good on paper ignored the biggest cost: opportunity cost.
2. The Whipsaw Trap
Volatile stocks don't trend smoothly. They whipsaw. Here's what happens:
- Stock drops 10% → you get stopped out ✅ (Following the rules!)
- Stock immediately rebounds 15% → you're in cooldown 😐
- Cooldown ends, you re-enter near the top 📈
- Stock drops 10% again → stopped out again ❌
- Repeat forever
Real example from TSLA (2018):
- Got stopped out 8 times in rapid succession
- Each loss: -8% to -13%
- While Buy & Hold would have weathered the storm and caught the recovery
Your "smart" stop-loss becomes a forced seller at the worst possible moments.
3. The Cooldown Paradox
The 30-day cooldown period is supposed to "let volatility settle" before re-entering. Sounds prudent, right?
Here's what actually happens:
The vicious cycle:
- You get stopped out or take profit → forced to sell
- You sit in cash for 30 days → earning 0% while markets move
- Major price movements happen during your forced vacation
- You finally re-enter 30 days later → often buying near a local high
- The cycle repeats → you keep missing rallies and buying tops
The result:
- You sit out rallies → miss major gains
- You re-enter after moves are over → buy high
- Catastrophic underperformance: 8.9x vs 97.5x
The "prudent" waiting period becomes a wealth destruction machine.
"But What About Risk Control?"
The most common defense: "Sure, returns are lower, but I'm managing risk!"
Let's check the results:
- Max drawdown: -21.8% (Rule-based) vs -70.4% (Buy & Hold) ✅
Yes, you cut max drawdown by 69%. The rule-based strategy never experienced a drawdown worse than -22%. Impressive!
But at what cost?
- Final equity: 8.9x vs 97.5x
- You sacrificed 91% of your gains to avoid a temporary drawdown
Think about that trade-off:
- You protected yourself from a temporary -70% drawdown that eventually recovered
- In exchange, you permanently gave up 91% of your potential wealth
Remember: drawdowns are temporary. Missing gains is permanent.
The 2022 drawdown in Buy & Hold recovered by 2024. The gains you missed during your 30-day cooldown periods? Gone forever.
Why a 30-Day Cooldown Is Catastrophic
You might think: "Maybe a shorter cooldown would work better?"
We tested that too. Here's what we found across different cooldown periods:
| Cooldown Period | Final Equity | Performance vs Buy & Hold |
|---|---|---|
| 0 days (immediate re-entry) | 97.5x | Same as Buy & Hold |
| 1 day | 124.1x | +27% better ✅ |
| 7 days | 20.7x | -79% worse ❌ |
| 30 days | 8.9x | -91% worse ❌ |
The pattern is clear: the longer you stay in cash, the worse you perform.
Even a 1-day cooldown (which slightly beat Buy & Hold) comes with massive hidden costs:
- Constant monitoring: Watching for daily entry/exit signals
- Trading fees: Commissions, bid-ask spreads, slippage (not modeled in our backtest)
- Tax inefficiency: Short-term capital gains on every trade instead of long-term rates
- Stress: The emotional toll of active trading
The 30-day cooldown magnifies all these problems while adding a catastrophic opportunity cost.
The Uncomfortable Truth
People love rule-based strategies because they provide the illusion of control.
- "I have a system!"
- "I'm managing my risk!"
- "I'm not just a passive investor!"
- "I'm following the data and being disciplined!"
But the actual data shows what your ego doesn't want to hear:
Your "smart" 30-day cooldown strategy destroyed 91% of potential wealth.
This isn't risk management. It's wealth destruction masquerading as discipline.
You feel smart setting stop-losses and take-profits. You feel prudent waiting 30 days to "let volatility settle." But you're actually:
- Selling low (stop-losses triggered during dips)
- Missing rallies (sitting in cash for 30 days)
- Buying high (re-entering after the move is over)
That's not discipline. That's a systematic way to do exactly what you shouldn't.
Real Talk: Who Actually Benefits from Stop-Losses?
Stop-losses aren't useless in every context. They can work for:
- Day traders: Operating on minutes/hours, not months/years
- Leveraged positions: Where a 10% move could wipe you out
- Single-stock concentration: If you're irresponsibly all-in on one ticker
- Traders who can monitor constantly: And re-enter within hours, not days
But if you're a long-term investor in a diversified portfolio? Stop-losses are pure self-sabotage.
The Humbling Lesson
We ran this backtest expecting to find some configuration that worked. Maybe 5% stops with 15% takes. Maybe 15% stops with 30% takes. Maybe a 3-day cooldown.
We tested multiple variations. The result was always the same:
The simpler strategy won.
No stops. No takes. No cooldowns. No "system."
Just buy, hold, and ignore the noise.
What About Individual Stock Examples?
Let's look at a few standouts to drive the point home:
CELH (Celsius Holdings)
| Strategy | Final Equity | Return |
|---|---|---|
| Buy & Hold | 389.2x | +38,820% |
| Rule (1-day) | 571.5x | +57,052% |
| Rule (30-day) | 6.2x | +516% |
The 30-day strategy turned a 38,820% gain into 516%. You'd need therapy after realizing that.
NVDA (Nvidia)
| Strategy | Final Equity | Return |
|---|---|---|
| Buy & Hold | 364.1x | +36,307% |
| Rule (1-day) | 508.0x | +50,700% |
| Rule (30-day) | ~20x | ~+1,900% |
Even the 1-day strategy couldn't consistently beat Buy & Hold on individual stocks—it just got lucky on a few.
AMC (The Meme Stock Test)
| Strategy | Final Equity | Return |
|---|---|---|
| Buy & Hold | 0.01x | -98.9% |
| Rule (1-day) | 0.36x | -64.0% |
| Rule (30-day) | 2.42x | +142% |
Finally, a win for the rule-based approach! By cutting losses on a dying stock, the 30-day strategy "only" lost -64% instead of -99%.
But here's the thing: AMC was one stock out of 20. If you're holding a diversified portfolio, your AMCs get offset by your NVDAs. The stop-loss "saved" you on one position while costing you massively on the 15 winners.
The Psychology Behind the Trap
Why do smart people fall for this?
1. Loss Aversion
Losses hurt more than gains feel good. A 10% stop-loss feels protective. But it ignores that cutting a loss often means selling before the recovery.
2. Action Bias
Doing something feels better than doing nothing. Trading gives you the illusion of control. But in investing, activity is often the enemy of returns.
3. Hindsight Bias
"If I had just sold in 2021 when TSLA hit $400, I'd have avoided the crash to $100!"
Sure. And if you'd held through, you'd be back at $250+ in 2023. Plus, you'd have to predict when to buy back in—which nobody can do consistently.
4. Complexity Bias
We assume complex strategies must be superior to simple ones. But markets reward patience and discipline, not cleverness.
The Visualization That Says It All
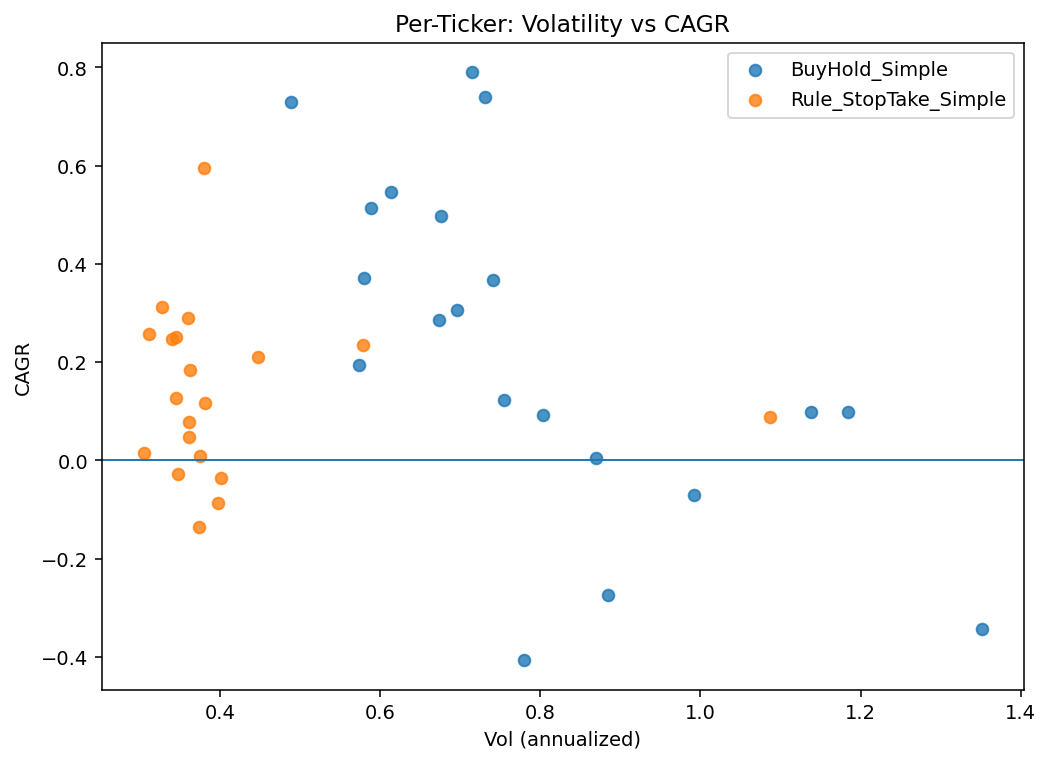 Caption: Scatter plot of volatility vs. CAGR for all 20 stocks. Each ticker has two points—one for rule-based strategy, one for buy-and-hold. Notice how the strategies cluster similarly on volatility, but buy-and-hold consistently achieves higher returns for the same risk level.
Look at the TSLA 2023 chart (shown earlier):
Top panel: Price chart with trades marked
- Green triangles ▲: Buys
- Red triangles ▼: Stop-loss exits
- Blue triangles ▼: Take-profit exits
You'll see trades clustered around... nothing. No pattern. Just random entries and exits driven by arbitrary price movements.
Middle panel: Equity curves
- Orange (Buy & Hold): Smooth climb to 1.5x
- Blue (Strategy): Flat line at 0.76x
Bottom panel: Position status
- Green: Invested
- Gray: Cash (cooldown)
More than half the chart is gray. You were on the sidelines while TSLA doubled.
What Should You Do Instead?
If rule-based stop-losses don't work, what does?
1. Diversify Properly
Instead of trying to "manage risk" with stops, spread your bets across:
- 20+ stocks (like our test portfolio)
- Multiple sectors
- Different geographies
- Asset classes (stocks, bonds, real estate, etc.)
2. Size Your Positions Appropriately
If a 10% loss on a single stock would devastate you, your position is too big.
Better approach: Size each position so that even a -50% loss is tolerable.
3. Rebalance Periodically (Not Mechanically)
Instead of daily stop-checks, rebalance quarterly or annually:
- Trim winners that have grown too large
- Add to losers if fundamentals haven't changed
- Stay close to your target allocation
4. Ignore Short-Term Volatility
TSLA dropped from $400 to $100 in 2022. If you held through, you recovered. If you panic-sold at $100, you locked in the loss.
The market rewards patience, not panic.
5. Accept Drawdowns as the Price of Admission
The -70% max drawdown in Buy & Hold? That's not a bug. It's a feature.
If you want 50%+ annual returns, you must stomach 50%+ drawdowns.
There's no free lunch. Stop-losses don't eliminate risk—they eliminate returns.
The Bottom Line
We tested rule-based stop-loss/take-profit strategies on 20 volatile stocks over 10 years. The results were clear:
The "smart" disciplined approach destroyed 79-91% of potential gains (depending on cooldown period) while providing minimal meaningful risk reduction.
The math that looks good on paper collapses in reality because:
- Cash drag kills compounding
- Whipsaws force you to sell low, buy high
- Cooldown periods make you miss rallies
Meanwhile, the "dumb" strategy—buy and hold—delivered 97.5x returns with zero effort, zero stress, and zero complexity.
Your Move
You can keep believing you're smarter than the market. You can keep setting stop-losses and take-profits, feeling disciplined and systematic.
Or you can look at the data and admit the uncomfortable truth:
Your rules aren't protecting you. They're destroying your wealth.
The market doesn't reward cleverness. It rewards patience.
The sooner you accept that, the richer you'll be.
Appendix: Full Backtest Results
Portfolio Summary (Equal-weight, 20 stocks, 2015-2025)
| Strategy | Final Equity | CAGR | Volatility | Sharpe | Max DD |
|---|---|---|---|---|---|
| Buy & Hold | 97.5x | 53.0% | 40.5% | 1.25 | -70.4% |
| Rule-Based (30-day cooldown) | 8.9x | 22.6% | 14.8% | 1.45 | -21.8% |
Key Metrics:
- Win Rate: 36.2% (winning trades / total trades)
- Average Win: +21.67%
- Average Loss: -10.11%
- Time in Market: ~38%
- Time in Cash: ~62%
Individual Stock Highlights (30-day cooldown)
| Ticker | Buy & Hold | Rule (30d) | Difference |
|---|---|---|---|
| CELH | 389.2x | 6.2x | -98.4% |
| NVDA | 364.1x | ~20x | -94.5% |
| AMD | 87.3x | 11.2x | -87.1% |
| PLTR | 17.8x | ~3x | -83.1% |
| SHOP | 92.8x | ~15x | -83.8% |
| GME | 2.7x | 9.7x | +259% ✅ |
| AMC | 0.01x | 2.4x | +23,900% ✅ |
The rule-based approach "saved" you on 2 dying stocks while costing you massively on every winner.
Final Thought
The greatest investors in history—Buffett, Munger, Lynch—didn't use stop-losses.
They bought great companies and held through volatility.
Maybe that's not exciting. Maybe it doesn't make you feel smart.
But it works.
And that's all that matters.
This analysis is based on a real backtest of 20 volatile stocks from 2015-2025 using daily OHLCV data. Past performance does not guarantee future results. This is educational content, not investment advice.
Comments (0)
No comments yet. Be the first to comment!