Recreating the 2015 Investment Portfolio: US ETF·TSLA Strategy Rebalancing Backtest (2015–2025)
Investing rationally with only the data visible at the time, without knowing the outcome
Introduction This article reconstructs the portfolio I would have reasonably built based solely on publicly available news and data from 2015, without any knowledge of the future. Rather than complex theories, I've written this as a story about how that year's market atmosphere—the Fed's first rate hike, Europe's quantitative easing, the China-driven crash, low oil prices, and the technology and consumption innovations driving the Nasdaq—would have shaped my account. The key isn't "getting the answer right," but rather riding the visible changes with balance and designing for resilience when things go wrong.
Let's go back to 2015. While getting ready for work, the news on the radio was always similar. "The Fed might finally raise rates." "Europe is printing more money." "The Chinese market is shaking." Stock prices fluctuated repeatedly, and oil prices dropped enough to notice on gas station signs. Meanwhile, the world on our phone screens got faster. We watched movies on Netflix, ordered with a single click on Amazon, and photos and files went into an invisible warehouse called "the cloud."
At that time, I thought: "Not knowing the future doesn't mean I can't do anything. Let's bet on the changes right in front of my eyes."
The Atmosphere I Could Feel Back Then
The US raised rates in December for the first time since 2006. "So real normalization is finally starting." Meanwhile, Europe and Japan expanded quantitative easing, and the dollar strengthened. Oil prices slid into the $30s, and China devalued the yuan in the summer as its stock market collapsed. The news constantly invoked "uncertainty."
But looking at the market's underbelly revealed a different picture. While the year-end S&P 500 was essentially flat, the Nasdaq was clearly positive. Four words dominated the 2015 headlines: internet, cloud, semiconductors, and electric vehicles. Amazon seriously mentioned "profit" for the first time, and Netflix turned streaming into a popular habit. Nvidia sold gaming chips while subtly weaving in unfamiliar phrases like "data centers" and "autonomous driving," and Tesla unveiled wall-mounted batteries and an SUV with falcon-wing doors. In other words, technologies changing how we live were already emerging.
So Here's How I Divided My Account
First, I centered everything on the US. The Fed was turning toward normalization, and with the dollar strengthening, I didn't want to take on major currency risk. However, just holding "the entire US" and forgetting about it seemed unwise given the clear changes happening. So I built a structure with a solid core and innovation satellites orbiting around it.
-
The core had two pillars. One was a broad US market ETF like VOO—riding "the backbone of the US economy." The other was QQQ, reflecting the Nasdaq, the only index that rose in 2015—the engine of big tech.
-
Innovation satellites had three branches. I allocated one to semiconductors via SOXX, another to internet/platforms via FDN, and a third to electrification and autonomous driving via TSLA (or ARKQ). The mindset was, "I don't know the answer, but at least one of these three will be right."
-
I also captured the spillover from everyday life. When oil prices drop, people have extra money. I expected that money to flow into consumer discretionary (XLY) and healthcare (XLV)—the services and products we actually used more frequently.
-
I included a counterbalance. If rates rose even slowly, value stocks (VTV) might have their moment, so I kept a small allocation as support.
-
Finally, 10% cash (or short-term bonds). This was ammunition to boldly buy more core holdings when things dropped too far "for no good reason," like the China-driven crash in August. On days when ETFs were temporarily underpriced (which actually happened in August that year), I decided to slowly buy only the large ETFs.
In numbers, it looked like this: QQQ 20%, SOXX 10%, FDN 10%, TSLA/ARKQ 10%, VOO 10%, XLY 7.5%, XLV 7.5%, VTV 10%, cash/short-term bonds 10%, and for Europe just 5% in currency-hedged ETFs—Europe printing more money was positive, but I wanted a minimal mechanism to prevent those benefits from evaporating through currency weakness.
I also completely excluded certain things: emerging markets and energy. The yuan devaluation, China's crash, and commodity slump were 2015 realities, and my answer was "not now." I'd revisit when clearer signs of a trend revival appeared.
Rebalancing by Rules, Keeping Greed Outside
The management rule was simple: Once a year at year-end, restore positions to original weights if they drifted by more than 5 percentage points. Avoid touching things in between. Only during major market disruptions—like August 2015—deploy 3-5% cash slowly into core holdings (VOO·QQQ). Leave satellites mostly alone; just reinforce the center.
Having this rule in place kept my mind steadier on noisy days. "My remote control only gets pressed once at year-end, and during crashes." Investing ultimately comes down to discipline.
Why This Was Rational Even "Back Then"
First, the policy direction was clear. The US was normalizing, Europe and Japan were stimulating. The logic of dollar strength and the necessity of a US core both had credibility. Second, prices told a story I couldn't ignore. Oil was low, and the Nasdaq was positive. The center of gravity for technology and consumption had already moved inside the market. Third, the face of risk was clear. China and commodities. "Avoid them for now" was the safe call, and that judgment was entirely reasonable based on 2015 headlines alone. Fourth, the era of investment tools had changed. Money was flowing into ETFs, and even accounting for the drawback exposed on certain days (price dislocation), simplifying around large, liquid options made sense.
The key point is this: Don't try to predict the future. Instead, position yourself for the changes happening right now—policy asymmetry, dollar direction, the habituation of technology and consumption—and design to avoid major damage when you're wrong. So I anchored the core in the US, placed the engine in technology, and pinned the safety catch on cash and value.
A Short Note to My 2015 Self
"The news will scare you again today. But look where we're actually spending our time. On screens, in delivery boxes, in batteries and chips—a new everyday life is already growing. Keep the core, participate in innovation, but save cash. Press the remote once at year-end. That's the most human form of investing we can do."
This was the conclusion I could reach just by looking at the 2015 atmosphere, headlines, and numbers.
Rebalancing in Action (2017·2020·2022)
The graphs below show rebalancing dates (end of December each year, gray dashed lines). The first shows normalized prices of all holdings, the second shows cumulative portfolio value decomposed by asset, and the third shows portfolio vs QQQ/VOO comparison.
Chart 1 — Normalized Prices of All Holdings (2015-01=1)
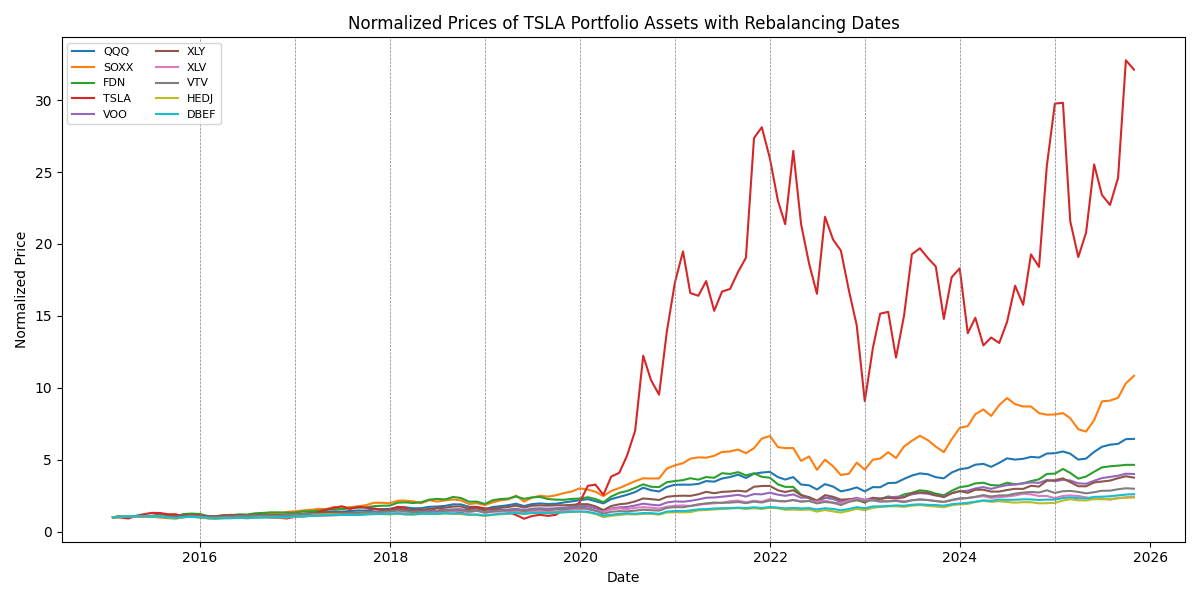
Chart 2 — Cumulative Portfolio Value Decomposition (Contribution by Asset)
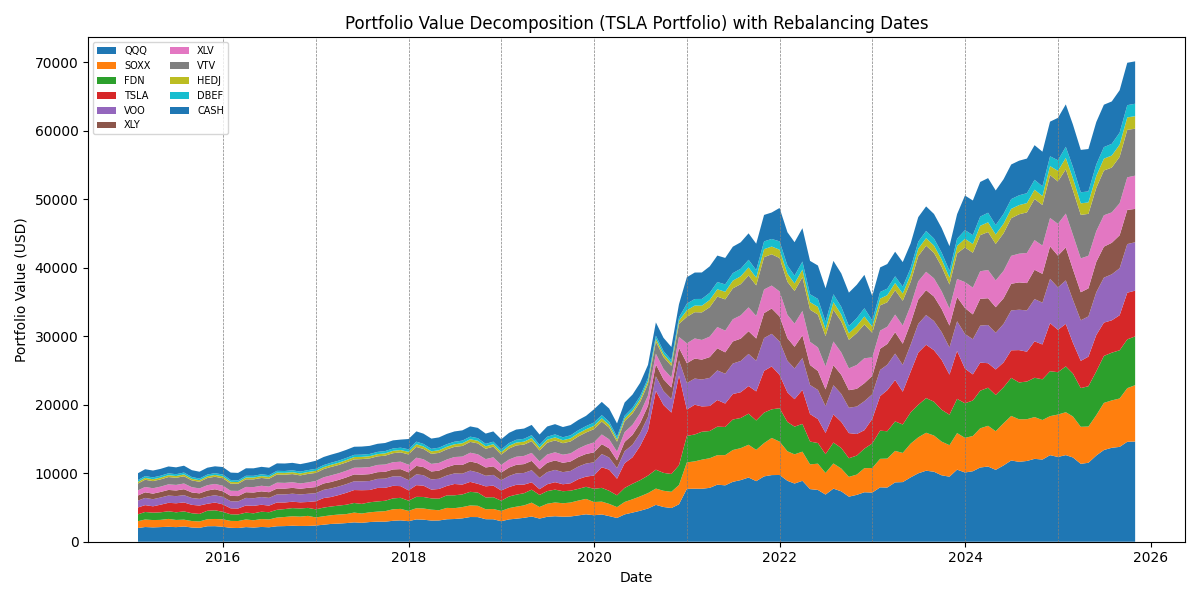
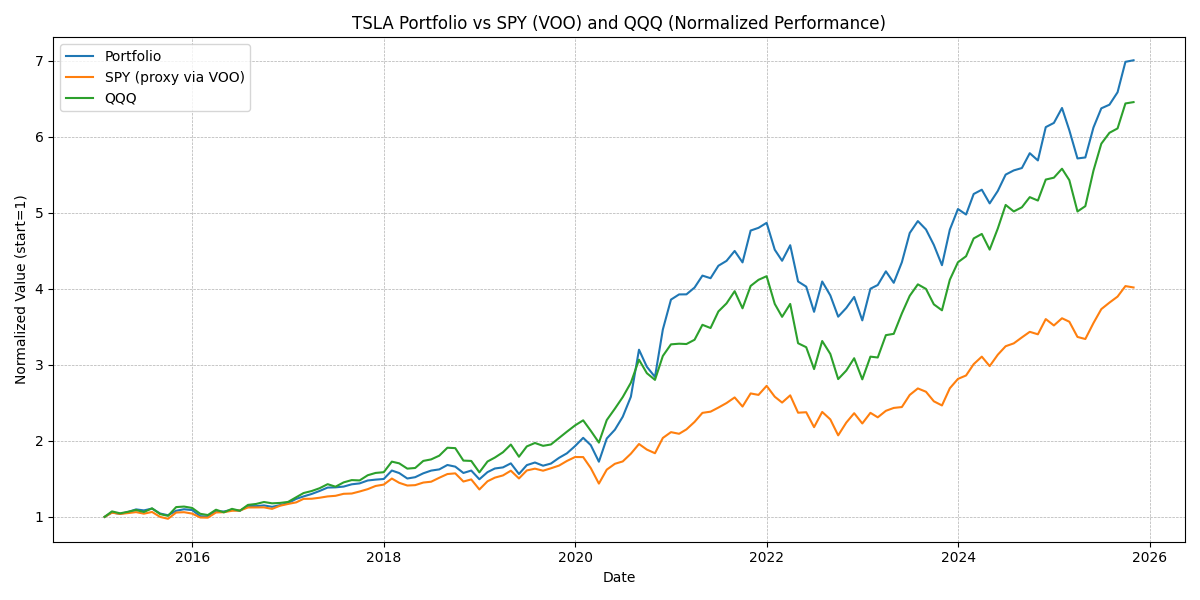
Chart 3 — Portfolio vs QQQ vs SPY(VOO)
📍 Rebalancing Example 1 — December 2017
- Situation: 2017 saw a tech rally. Annual returns of TSLA +45.7%, SOXX +39.8%, QQQ +32.7% exceeded target weights.
- Chart Hint: In Chart 2, before the last dashed line in 2017, TSLA·SOXX·QQQ areas became relatively thicker.
- Action: Sell — TSLA 2.17pp, QQQ 1.34pp, SOXX 1.49pp / Buy — VTV 1.12pp, XLV 0.44pp, XLY 0.35pp, cash 3.09pp.
- Rationale (Strategy Applied): "Pursue innovation, but don't tilt too heavily toward one holding." Lock in gains from overheated names and increase value·healthcare·cash to prepare for 2018 volatility.
📍 Rebalancing Example 2 — December 2020
- Situation: 2020 EV boom. TSLA +743% surged to 42% of portfolio (concentration risk), SOXX +52.7%, QQQ +48.4%.
- Chart Hint: In Chart 2, just before the last dashed line in 2020, TSLA area expanded to nearly half the portfolio.
- Action: Large-scale sell — TSLA 121.13pp (restore to 10% target) / Broad buys — VTV 18.34pp, XLV 12.21pp, XLY 9.91pp, QQQ 19.35pp, SOXX 8.86pp, FDN 8.89pp, VOO·HEDJ·DBEF·cash, etc.
- Rationale (Strategy Applied): "Lock in explosive gains and diversify risk." Capture profits and reallocate across diverse assets to eliminate structural concentration.
📍 Rebalancing Example 3 — December 2022
- Situation: Tightening and inflation shock. TSLA −65.0%, SOXX −35.1%, QQQ −32.6%—innovation weights plummeted.
- Chart Hint: In Chart 2, before the last dashed line in 2022, TSLA·SOXX areas noticeably thinned.
- Action: Buy at discount — TSLA +18.35pp, FDN +9.10pp, QQQ +5.90pp, SOXX +4.14pp / Reduce — VTV −11.52pp, XLV −8.64pp, VOO −3.89pp, cash −12.51pp.
- Rationale (Strategy Applied): "Buy innovation cheaply in downturns." Return defense·cash accumulated during upturns to re-enter innovation → participate in the 2023 rebound.
Bottom Line
In bull markets, trim overheating to build diversification and defense; in bear markets, reduce cash and defense to buy innovation back. This discipline enabled the portfolio to achieve superior performance vs QQQ·SPY over a decade.
Comments (0)
No comments yet. Be the first to comment!