October 2025 US Stock Market: Intel, Nokia, NVIDIA (Part 2)
Continued from Part 1...
In Part 1, we explored Beyond Meat's meme stock frenzy and gold's flash crash. In Part 2, we examine Intel and Nokia's dramatic comebacks, and the practical investing lessons from October.
Event 3: Big Tech's Strategic Bets - The Revival of Intel and Nokia
What Happened?
October was a "salvation month" for some companies. Intel and Nokia, in particular, found their savior in NVIDIA.
Intel Timeline:
- Background: 60% stock price collapse in 2024, falling behind in semiconductor competition
- March 2025: New CEO Lip-Bu Tan appointed
- October 23rd:
- Q3 earnings release: $4.1B net income (vs $16.6B loss in prior year - returned to profitability)
- NVIDIA $5B + SoftBank $2B investment announced
- Stock price +3.36%
- October Result: +90% YTD
Nokia Timeline:
- Background: Once a mobile phone empire, now transformed to 5G equipment provider
- Tuesday, October 28th:
- NVIDIA $1B investment announced ($6.01/share, 2.9% stake)
- Partnership to optimize 5G/6G software for NVIDIA chips
- Stock price +22.8% in a single day (largest gain in 10 years)
- Market cap $41.8B (highest in 10 years)
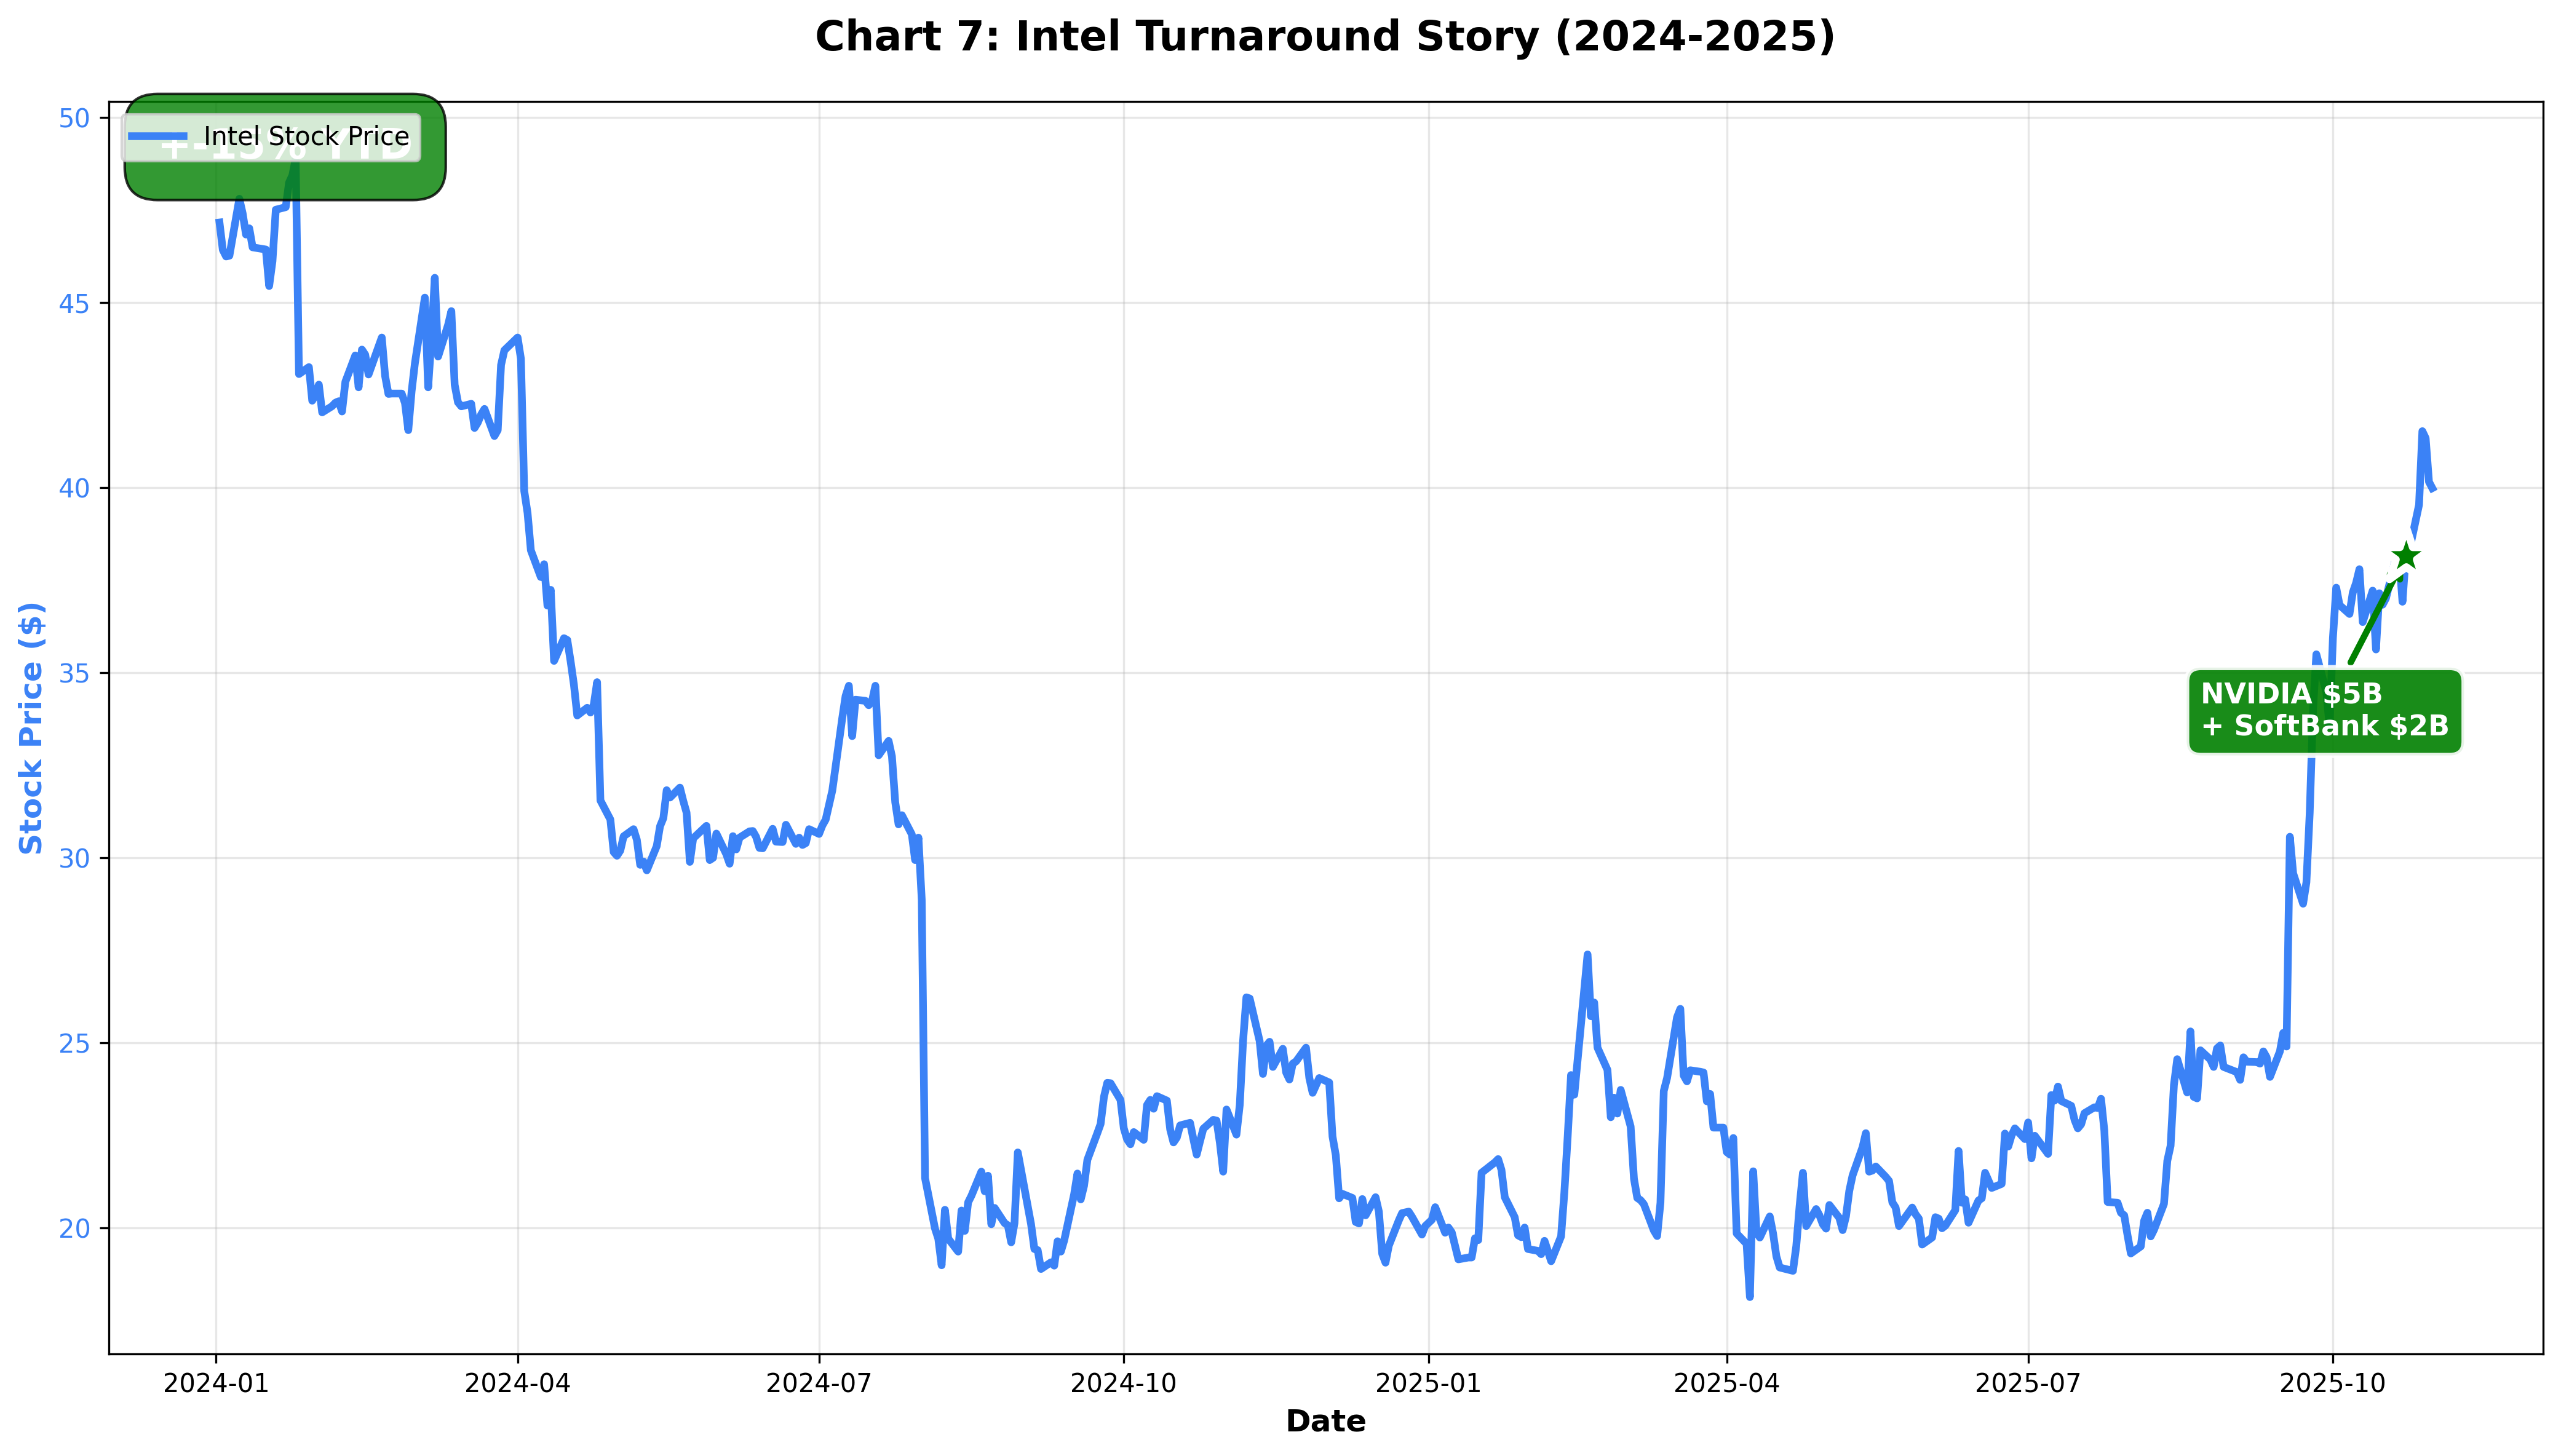
The chart above shows Intel's dramatic reversal story. The stock price trend (blue line) shows a declining trend throughout 2024, then begins to rebound starting in March 2025 with the new CEO appointment. The orange star marks the CEO appointment, while the green star indicates the October announcement of NVIDIA's $5B and SoftBank's $2B investments. These strategic investments boosted market confidence, leading to an impressive ~90% YTD gain.
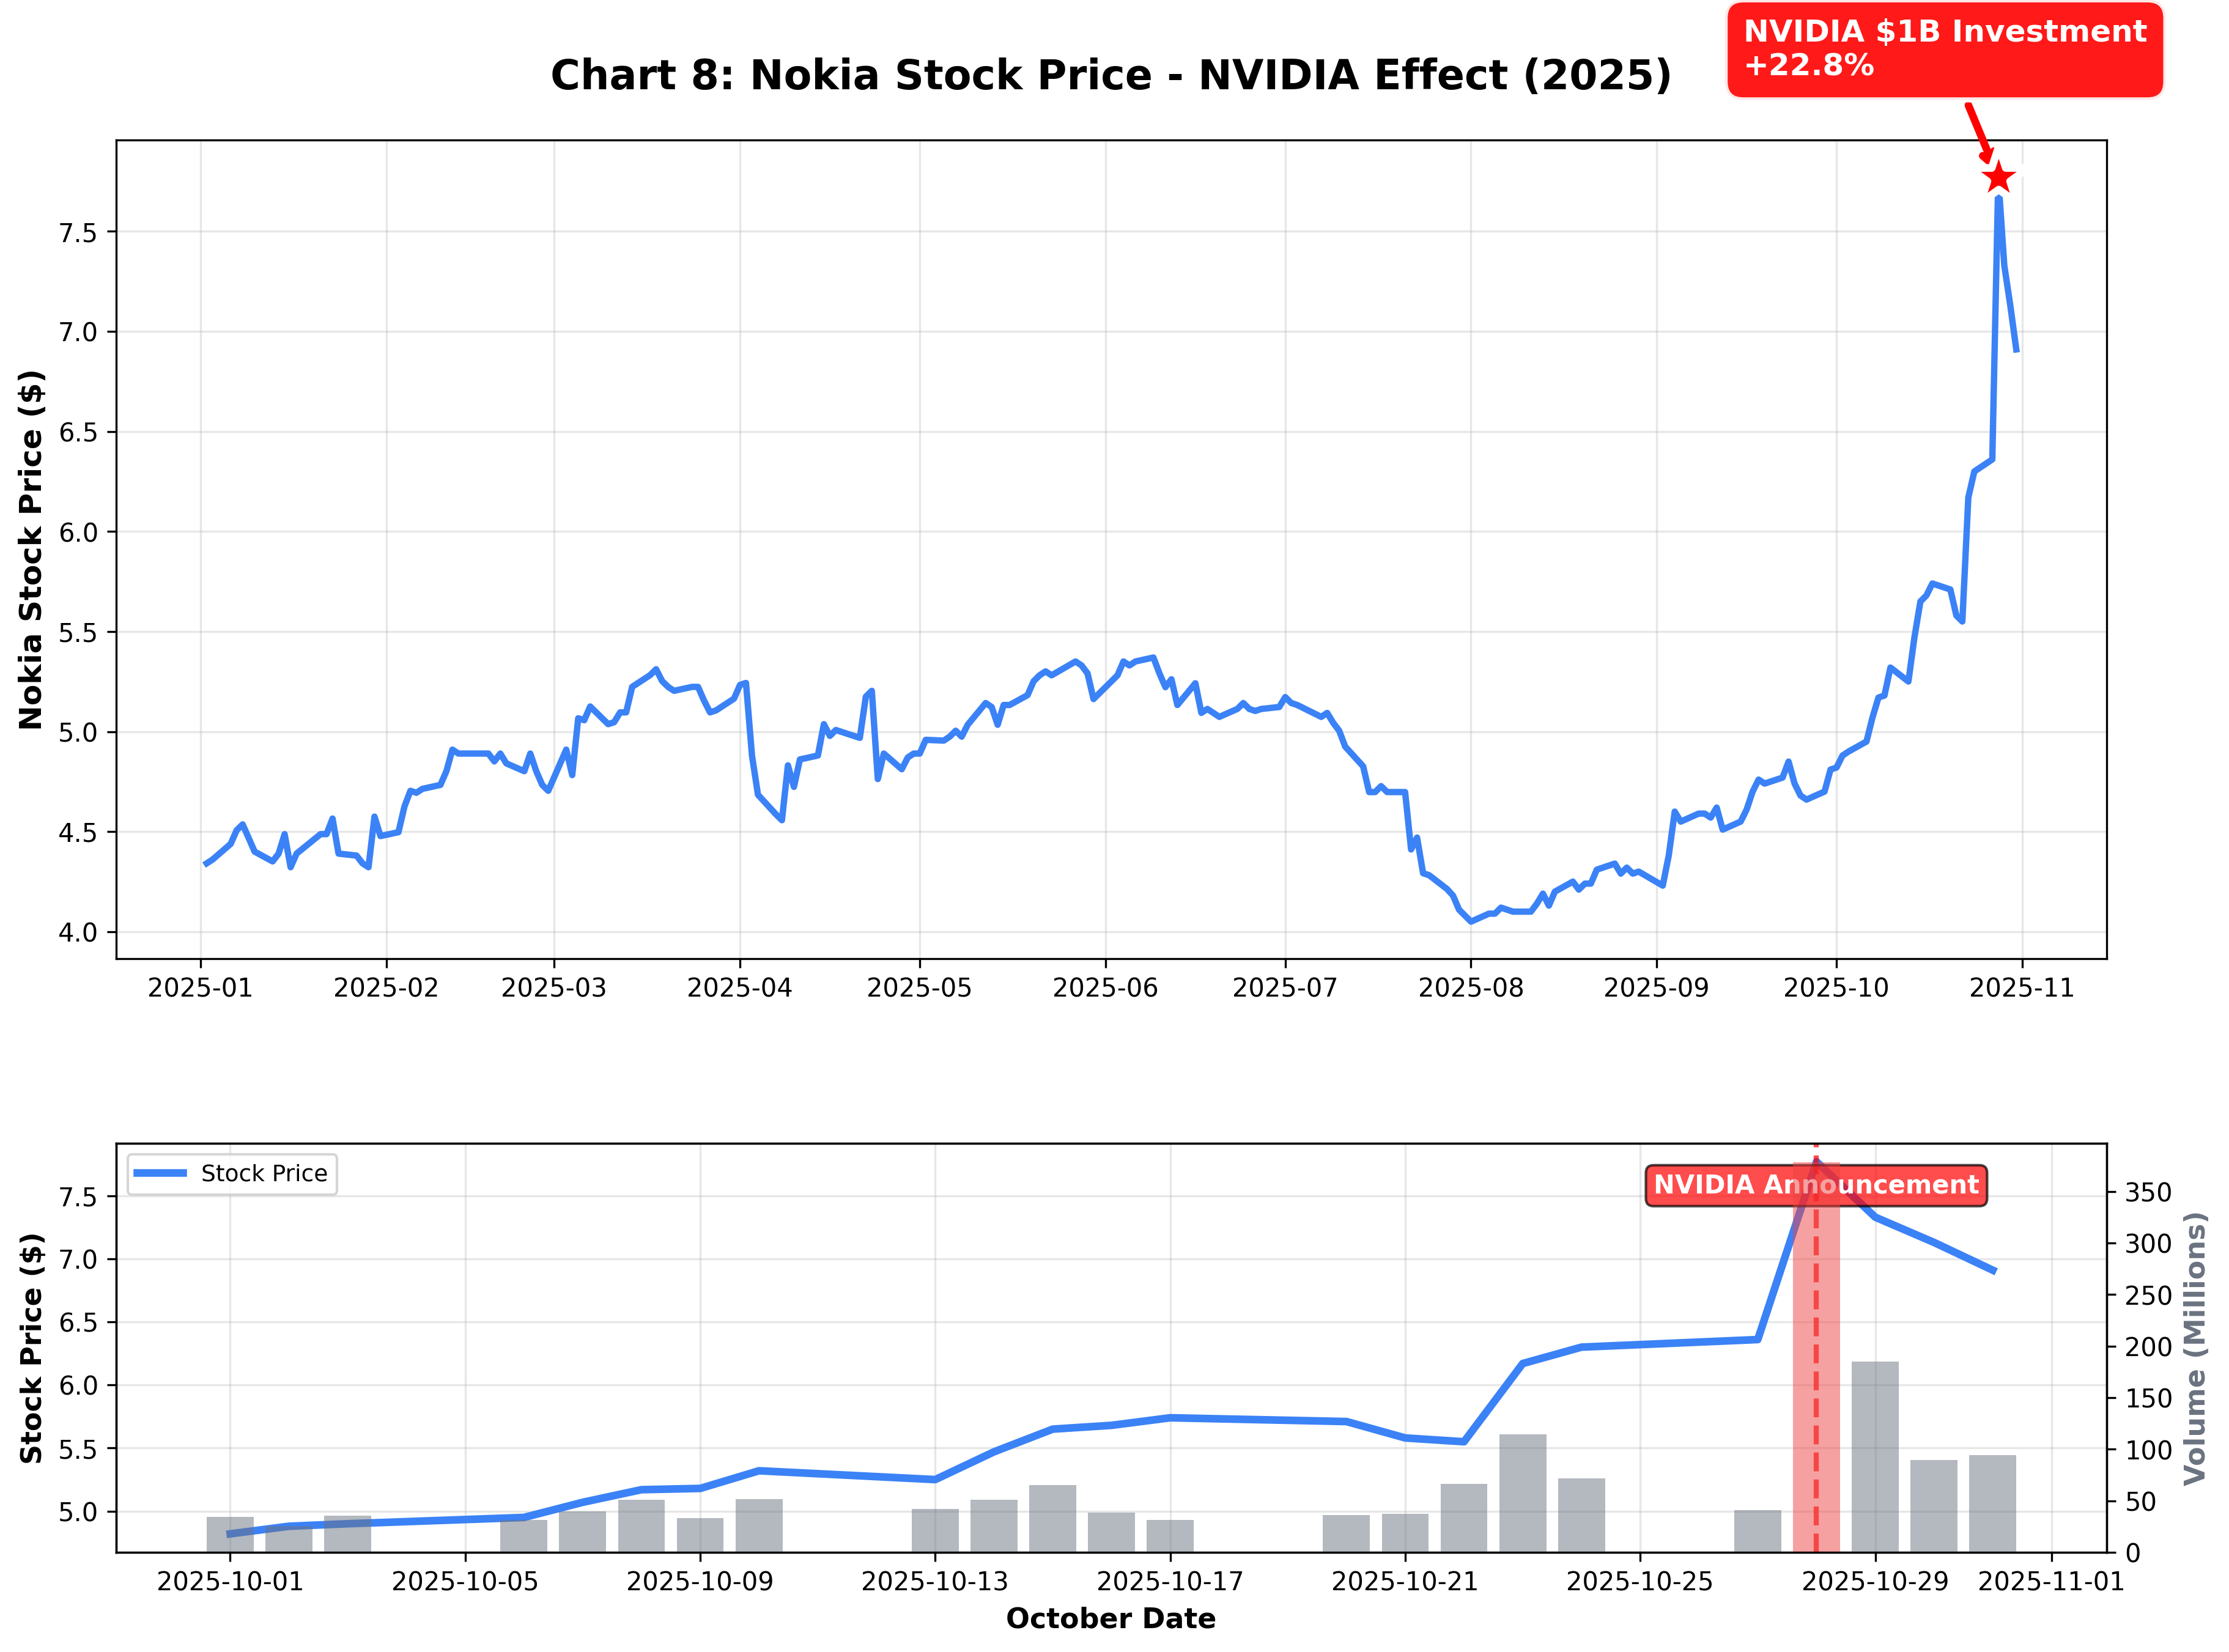
The chart above consists of two parts. The top chart shows Nokia's full 2025 stock price trend, with a red star highlighting the surge on October 28th when NVIDIA's $1B investment was announced. The bottom chart zooms into October, showing the price line along with volume (gray bars). On October 28th (red bar), volume exploded and the stock price rose 22.8% in a single trading day, recording the largest gain in 10 years. This is a perfect example of how strategic partnerships can have an immediate and powerful impact on stock prices.
Why Did Big Tech Invest in 'Laggards'?
NVIDIA's investments aren't just financial investments. The strategic purpose is clear.
1. Building an AI Ecosystem NVIDIA isn't just a chip company. It's trying to control the entire infrastructure where AI operates:
- Chips (its own GPUs)
- Software (CUDA platform)
- Network (Nokia's 5G/6G) ← New territory
- Manufacturing (Intel foundry) ← Risk diversification
2. Past Success Stories NVIDIA achieved great success with similar investments in 2024-2025:
- CoreWeave (cloud): Stock tripled after IPO
- Arm Holdings (chip design): +50% in 2025 alone
3. Nokia's Hidden Value Nokia possesses:
- 5G patent portfolio
- Relationships with telecom carriers
- Early 6G technology
Nokia CEO Justin Hotard stated the goal is "putting an AI data center in everyone's pocket." NVIDIA is betting on this vision.
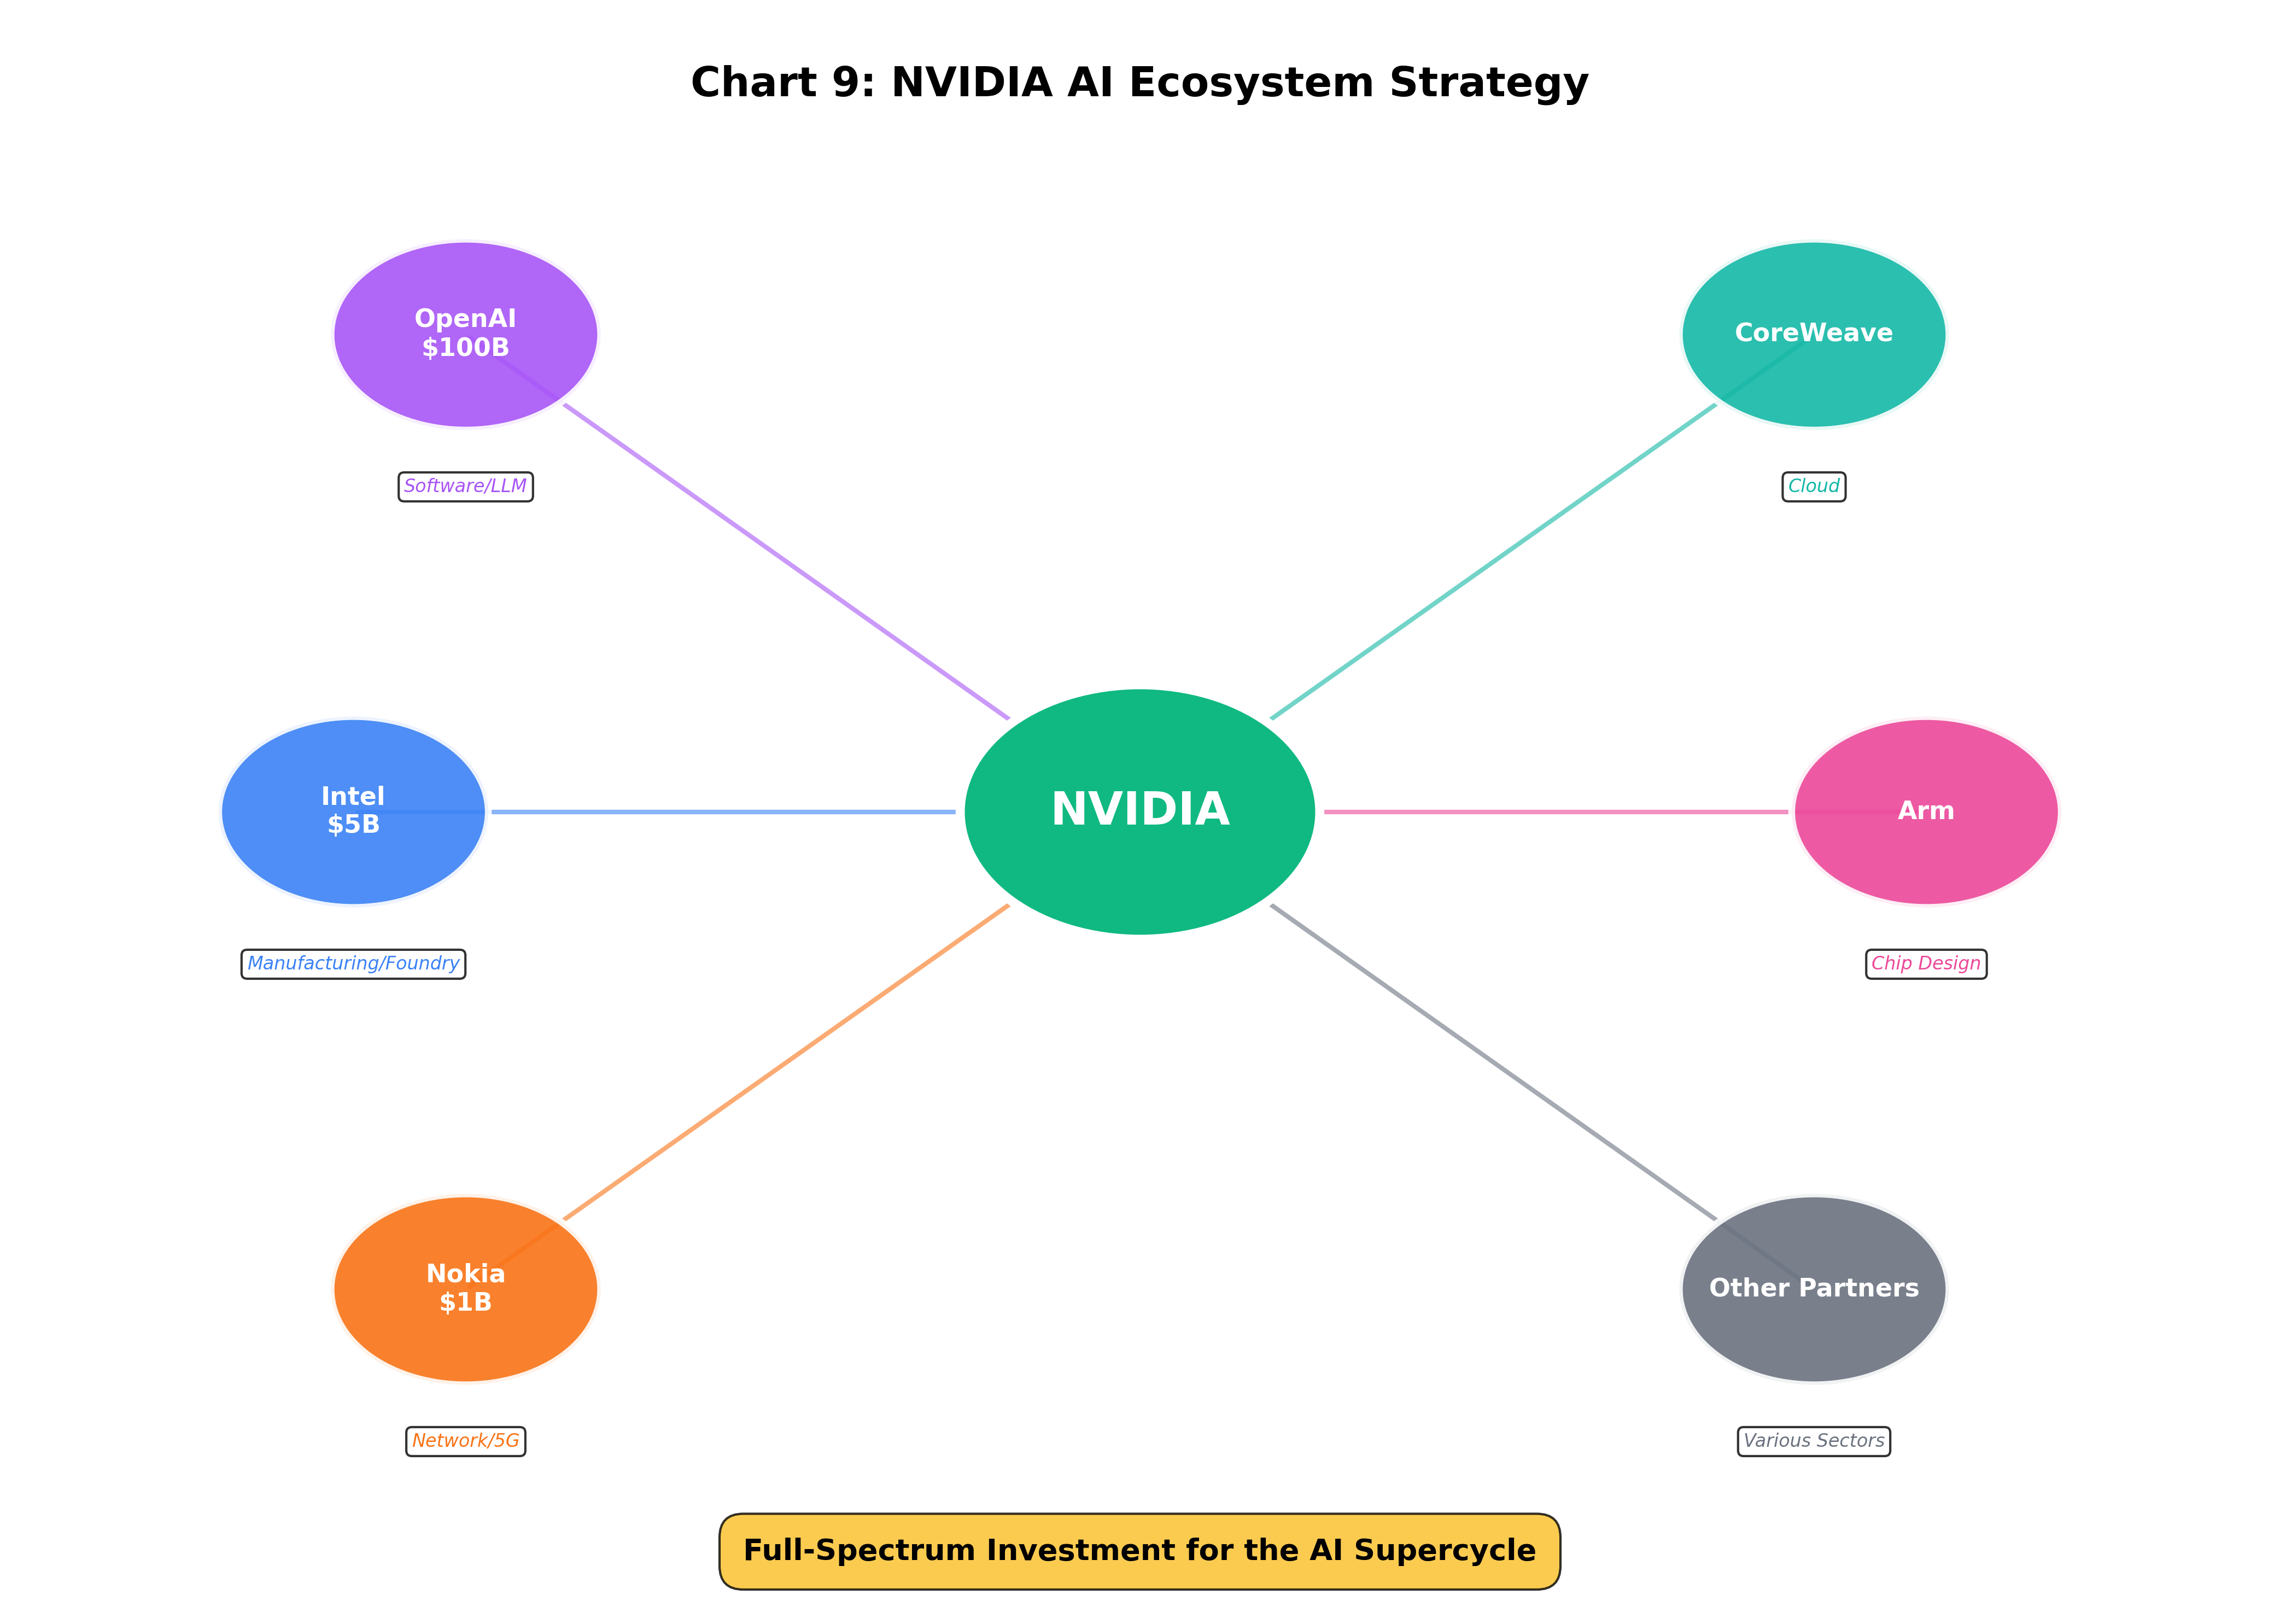
This network diagram visualizes NVIDIA's AI ecosystem building strategy. The central green circle is NVIDIA, surrounded by various colored circles representing companies NVIDIA has invested in or partnered with. OpenAI (purple, $100B) handles Software/LLM, Intel (blue, $5B) handles Manufacturing/Foundry, and Nokia (orange, $1B) covers Network/5G. CoreWeave handles Cloud, and Arm manages Chip Design.
The arrows from each partner to NVIDIA show they're all being integrated into NVIDIA's AI ecosystem. NVIDIA isn't just making GPUs - it's executing a strategy to dominate the entire infrastructure of the AI era. This is the "full-spectrum investment for the AI supercycle" strategy.
Lesson: Turnarounds Are Possible But Not Easy
Intel's Case:
- ✅ What they did: Hired strong CEO, massive restructuring (13% workforce reduction), divested non-core businesses
- ✅ Result: Returned to profitability after 6 quarters, +90% stock price
- ⚠️ Caution: Still behind in AI chip market, long-term competitiveness uncertain
Nokia's Case:
- ✅ What they did: Complete business transformation from mobile phones to network equipment (took 10 years)
- ✅ Result: Secured NVIDIA as partner
- ⚠️ Caution: NVIDIA previously invested in SoundHound and Serve Robotics, then quickly divested
Key Lessons:
- Turnarounds are gradual. Intel rebounded after 3 years of pain.
- Strong leadership is essential. The new CEO's role was decisive.
- Strategic partners can be game changers. But there's risk of increased dependency.
October's Common Lessons: Living in the Age of Volatility
The three events seem different, but they share common threads.
1. Algorithms Rule the Market
Beyond Meat's meme stock frenzy and gold's flash crash were both amplified by algorithmic trading.
- Initial movement → Algorithm detection → Automated buying/selling → Acceleration
- Studies show 70%+ of trading volume is generated by algorithms
How to respond:
- Don't react immediately to spikes/crashes
- Wait a day or two for the dust to settle
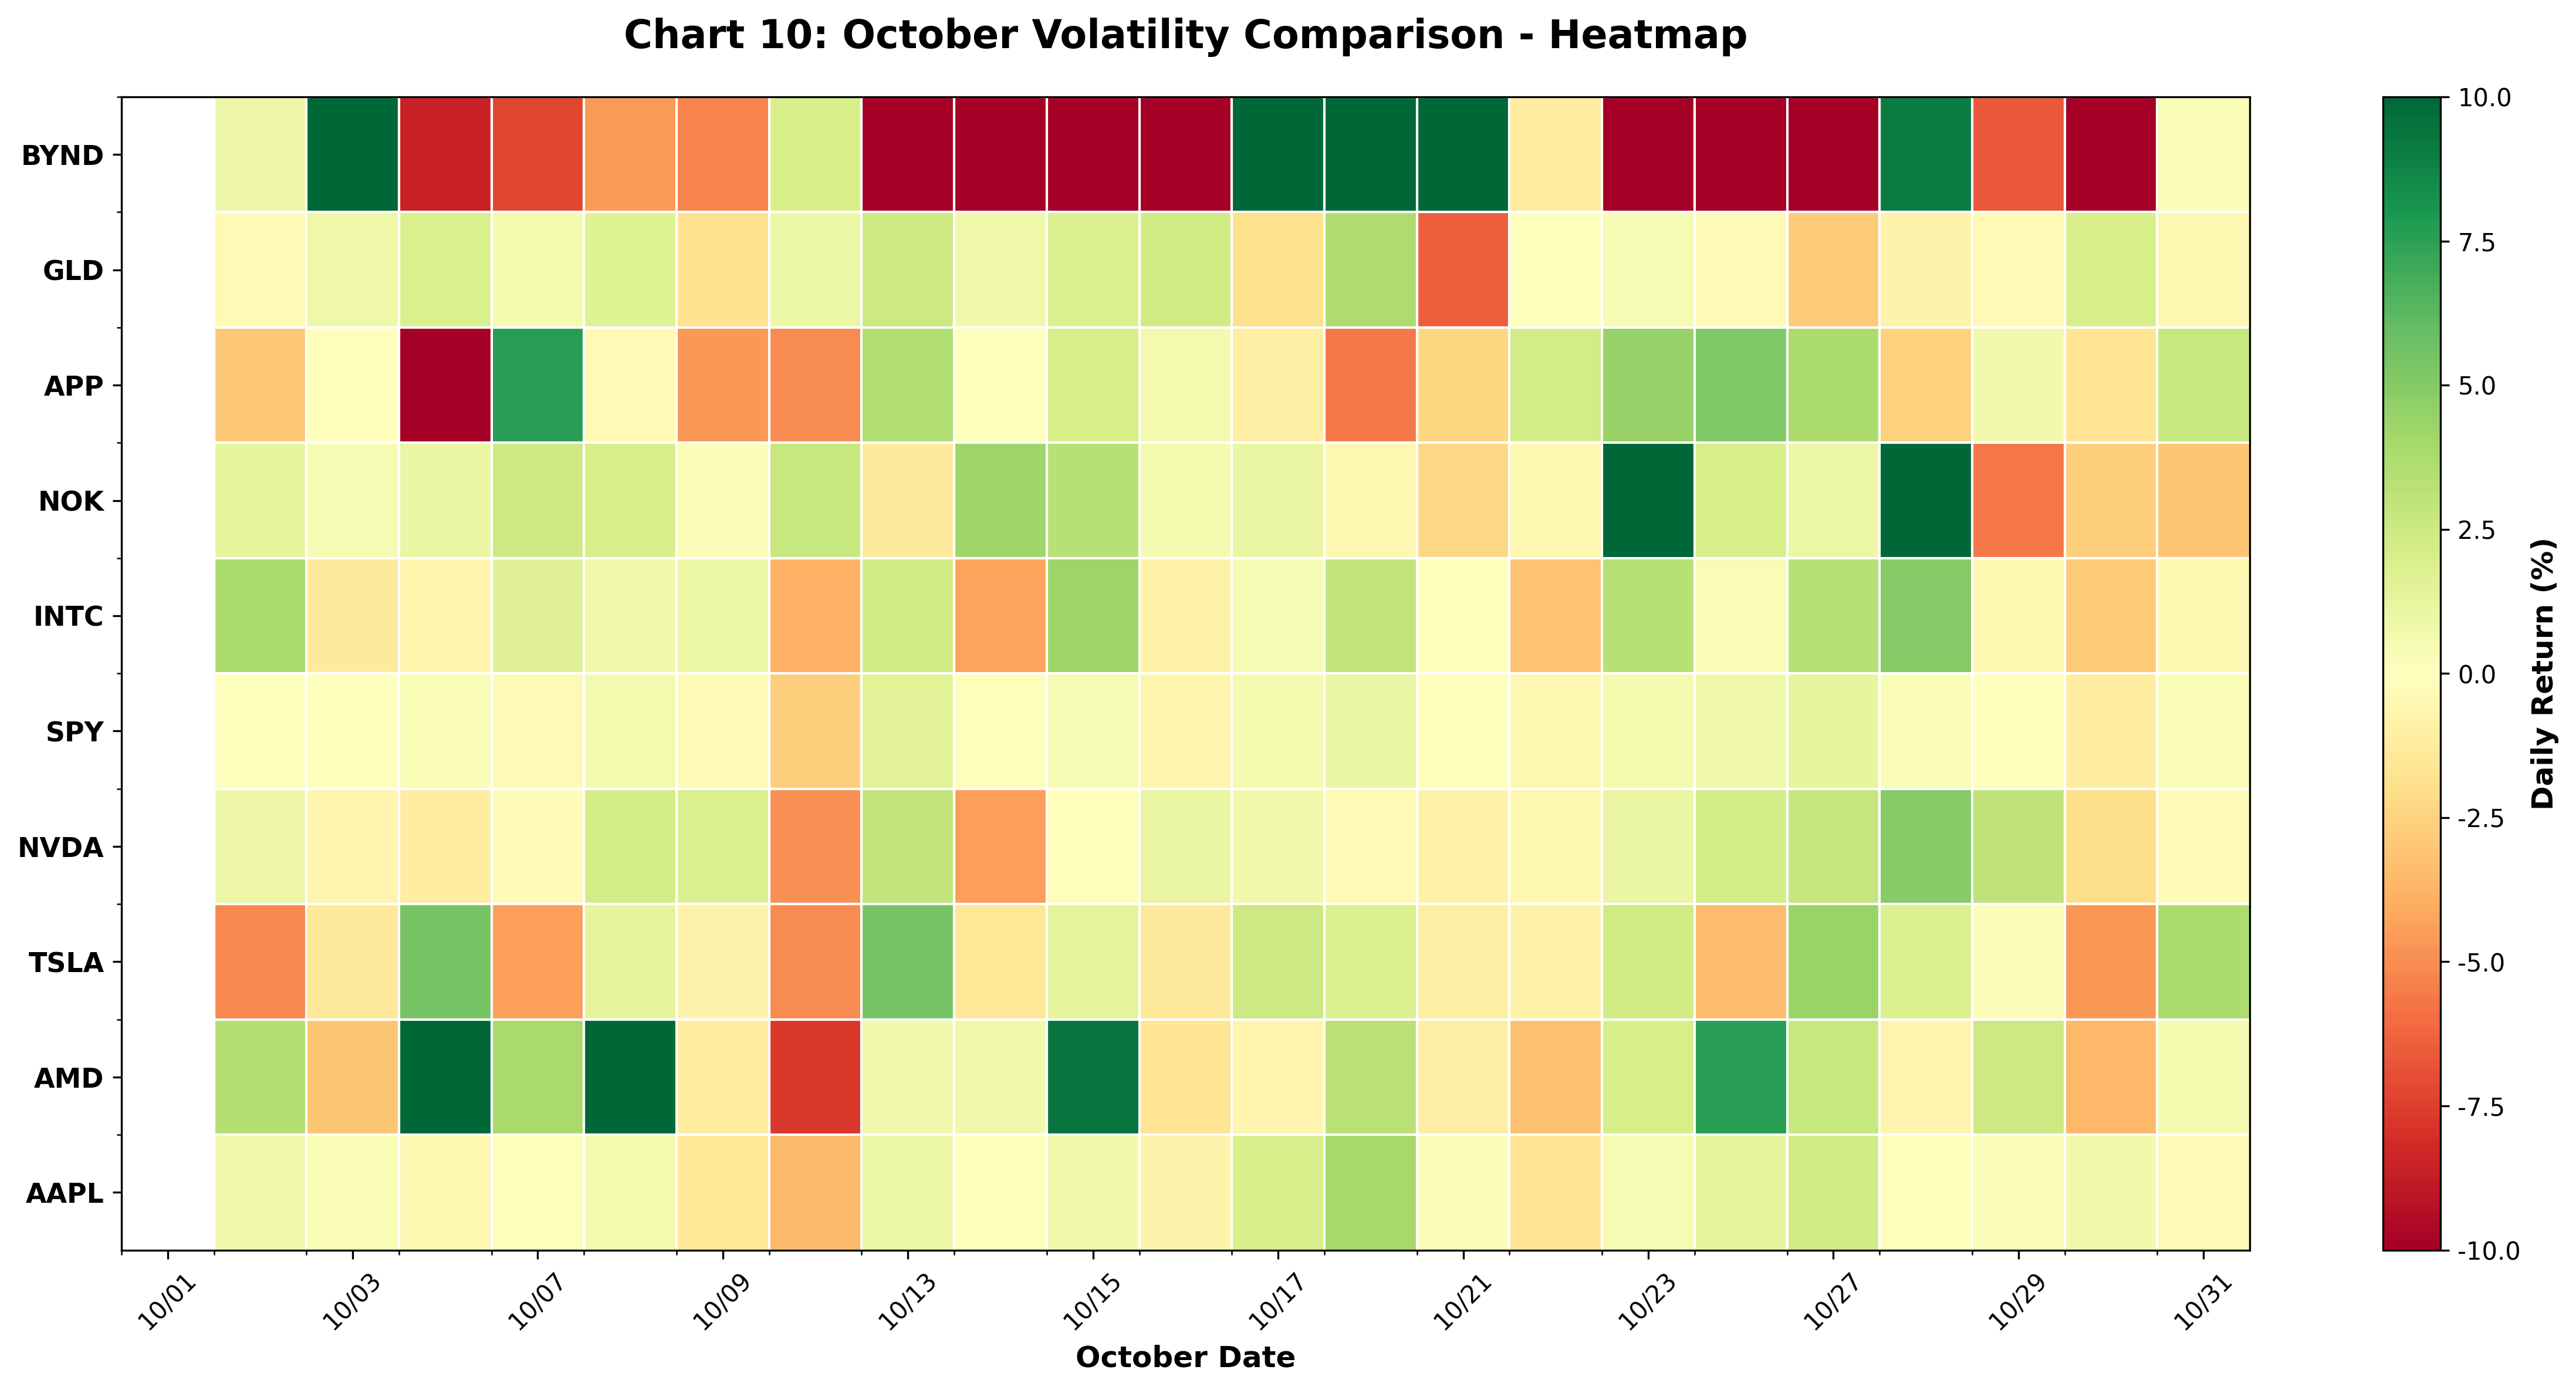
This heatmap visualizes daily volatility of major stocks throughout October using colors. The vertical axis shows tickers (BYND, GLD, APP, NOK, INTC, SPY, etc.), the horizontal axis shows dates. Green means up, red means down, gray is flat, and darker colors indicate larger moves.
Looking at the BYND row, you can see extreme color changes (green → red → green → red), showing the meme stock's severe volatility at a glance. The October 21st column shows GLD (gold) in red, indicating the flash crash. October 28th shows NOK and NVDA in dark green, highlighting the impact of the partnership announcement. In contrast, SPY (S&P 500) shows a relatively stable color pattern.
2. Social Media Is a Double-Edged Sword
Beyond Meat rose 600% thanks to social media, but fell 70% for the same reason.
Warning Signs:
- Slogans like "To the Moon!"
- Posts overflowing with rocket emojis (🚀)
- Spikes unrelated to fundamentals
How to respond:
- Don't ride the social media wave
- "Be fearful when others are greedy" (Warren Buffett)
3. Fundamentals Win Eventually (But It Takes Time)
- Beyond Meat: Revenue -19%, operating loss... eventually crashed
- Intel: Returned to profitability, cost reduction... +90%
- Nokia: 5G technology, strategic value... secured partner
How to respond:
- Don't get swayed by short-term volatility
- Look at company performance, competitiveness, strategy
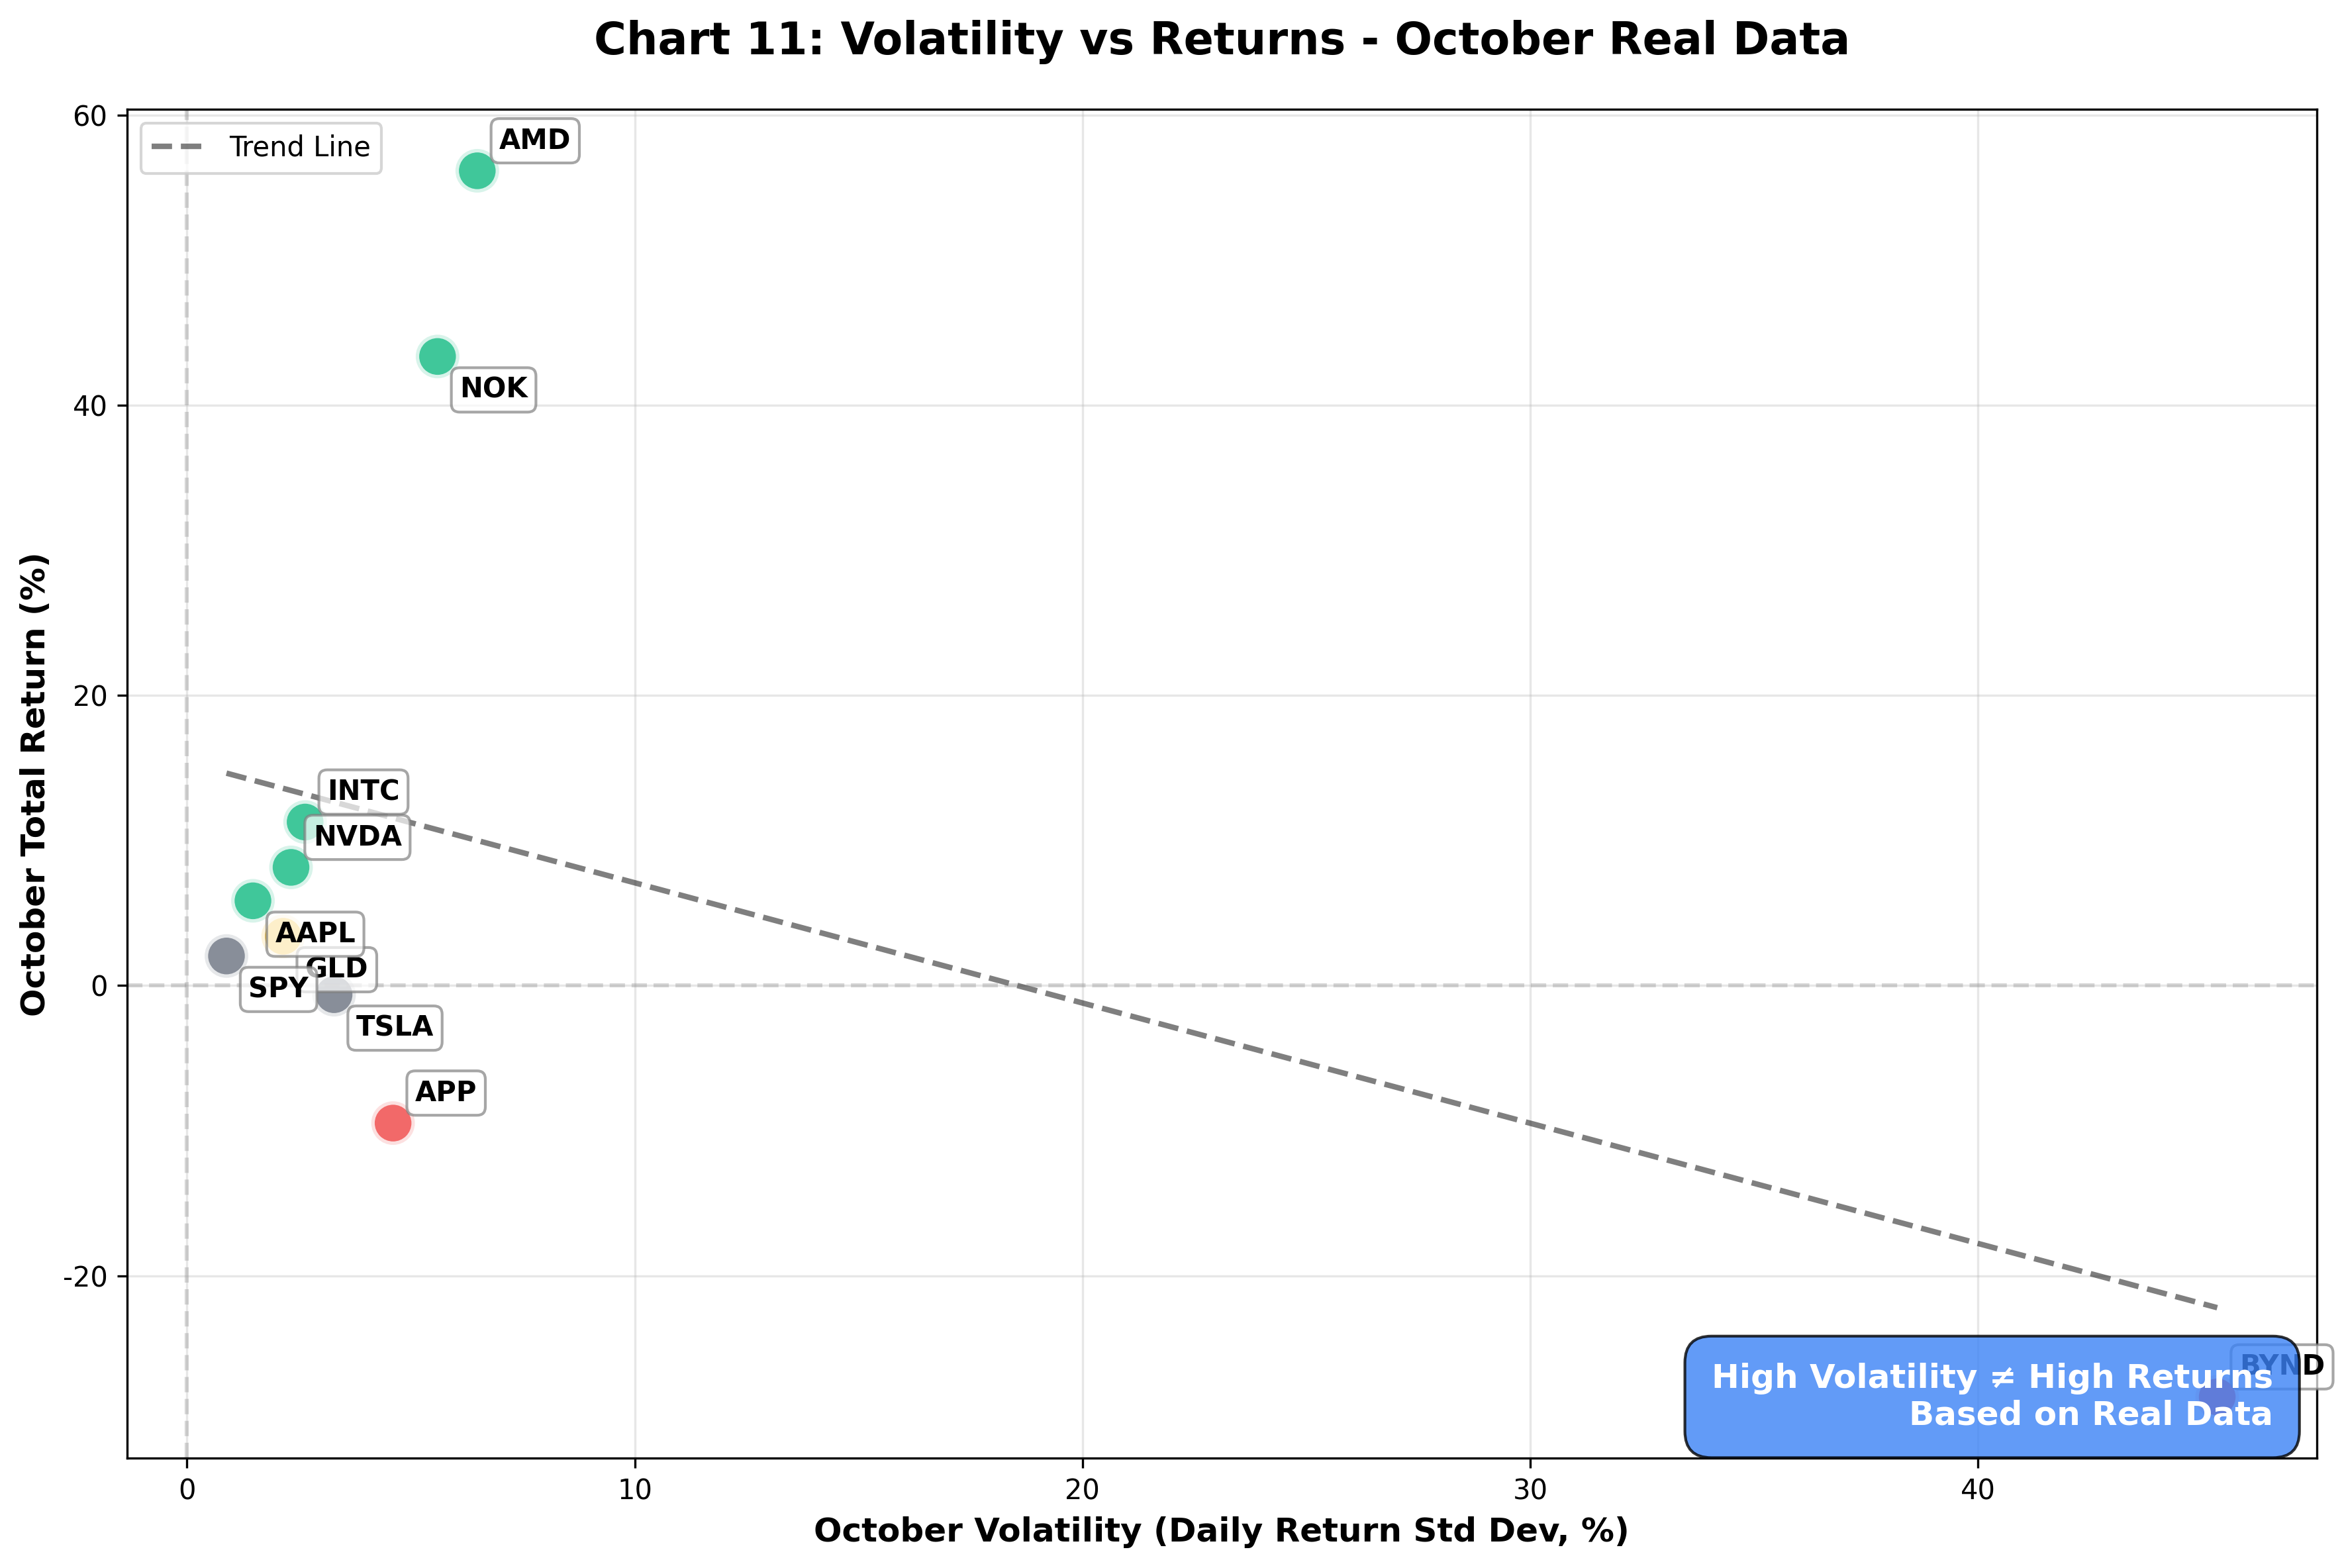
This scatter plot shows the relationship between October volatility and October actual returns using real market data. The X-axis represents daily volatility (standard deviation) during October, the Y-axis shows October total return. Each dot is a stock, with all tickers labeled.
Key Findings:
- High volatility ≠ High returns: High volatility doesn't guarantee high returns
- Some high-volatility stocks like BYND recorded negative returns
- The dotted trend line shows weak correlation between volatility and returns
- Green dots (high returns) are distributed regardless of volatility level
The chart's key message: Volatility itself doesn't mean investment opportunity; actual returns depend more on company fundamentals and market conditions than volatility.
4. Trade Policy Changes Everything
Early October tariff fears crashed everything, then late October trade negotiation hopes rebounded everything.
Timeline Summary:
- October 10th: Trump administration hints at massive China rare earth tariff increase
- Major indexes plunge ("All 3 Major Indexes Take Major Dive")
- Tech, industrials, consumer discretionary lead decline
- October 27th: Trump "Meeting with Xi on 29th, confident deal will happen"
- Dow +0.7%, Nasdaq +1.9% all-time high
- Gold falls (safe-haven demand decreases)
- Stocks rise (risk-on)
How to respond:
- Can't ignore macroeconomic news
- But don't overreact to short-term news
- Diversify portfolio to spread specific policy risks
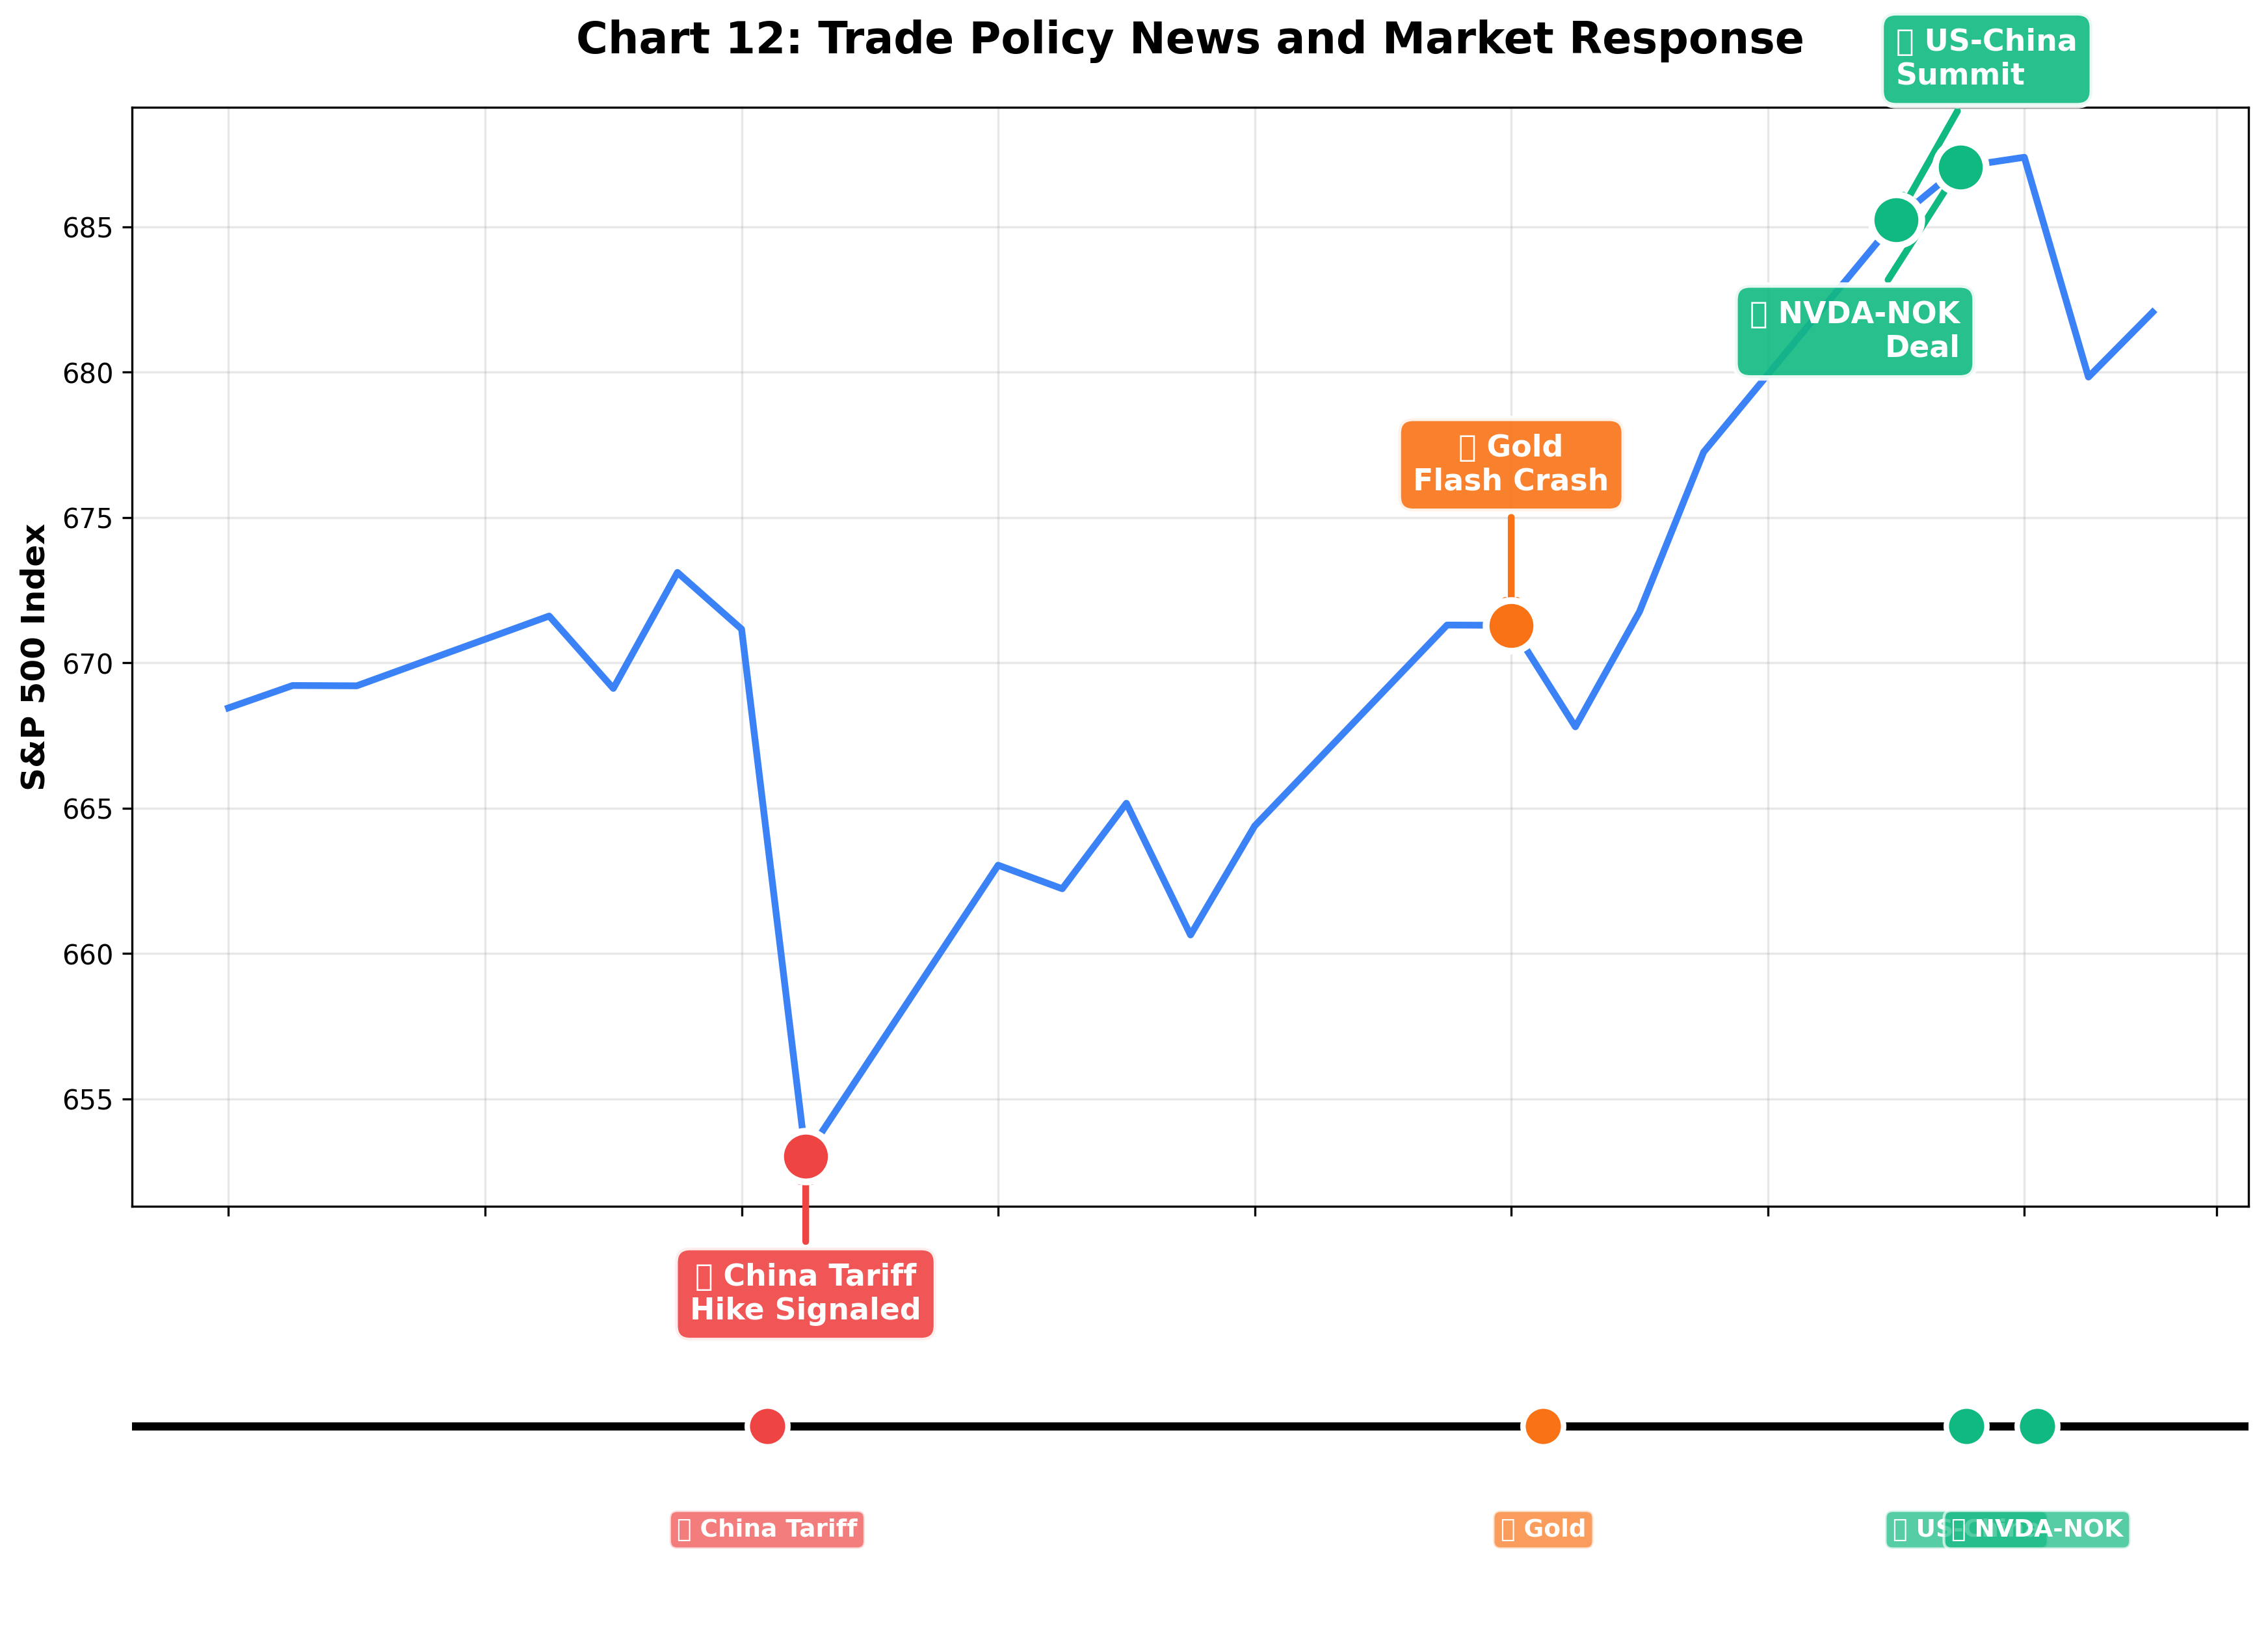
This dual-panel chart shows the clear causal relationship between trade policy news and market reactions. The top chart shows the S&P 500's October movements, the bottom shows major news event timeline.
Key Connections:
- October 10th: China tariff hike signaled (red circle) → S&P 500 plunges
- October 21st: Gold flash crash (orange circle) → Market anxiety increases
- October 27th: US-China summit announced (green circle) → Market rally begins
- October 28th: NVDA-NOK partnership announced (green circle) → Additional gains
Each event is clearly marked on the bottom timeline and precisely matches the price movements in the top chart. This shows macroeconomic news, especially trade policy, can drive the entire market. You can see the market moving several percent on single news items.
5. Valuation Matters
Beyond Meat's Lesson:
- Market cap: $170M (at low)
- Revenue: $320M annually
- Net loss: $160M annually
- Price-to-Sales ratio: 0.5x → Looked attractive on valuation but...
- Unprofitable company fundamental problem
Intel's Lesson:
- Valuation: P/E 88x (trailing), 56x (forward)
- Looks more expensive than NVIDIA but...
- Return to profitability and successful restructuring inflection point
Key: Low valuation isn't always an opportunity. There's a "reason it looks cheap."
Conclusion: What October 2025 Left Us
One month in October vividly showed a cross-section of modern financial markets.
7 Things to Remember as Investors
-
Meme stocks are gambling: Like Beyond Meat, they can rise 600% or fall 70%. Stay away if there are no fundamentals.
-
Safe havens aren't safe: Gold can crash 5%. Diversification is the only answer.
-
You can't beat the algorithms: Don't get involved in short-term volatility games. Be a long-term investor.
-
Beware of social media: 🚀 emojis and "To the Moon!" slogans are warning signs.
-
Turnarounds are possible but difficult: Like Intel, it can take 3 years. Patience is required.
-
Strategic partnerships matter: Like Nokia, the right partner can change the game.
-
Don't ignore macroeconomics: A single trade policy can flip the entire market.
Heading into November
October's storm has passed. Beyond Meat trades quietly in the $2 range, gold is finding new equilibrium near $4,000, and Intel and Nokia dream of comebacks with big tech support.
History repeats, but not in the same way. We can't predict what the next meme stock will be or where the next flash crash will come from. But one thing is certain:
"In the short run, the market is a voting machine, but in the long run, it is a weighing machine." - Benjamin Graham
Fundamentals, patience, and emotional control. Remember these three things, and you can survive storms like October.
Appendix: October Key Metrics Summary
| Item | Value |
|---|---|
| S&P 500 Monthly Return | +3.6% |
| Nasdaq Monthly Return | ~+4-5% |
| Beyond Meat Max Move | $0.52 → $7.69 (1,379%) → $2 range |
| Gold Max Decline | Oct 21 -5%+, 2-day -6% |
| Nokia Single Day Gain | +22.8% (10-year high) |
| Intel YTD | +90% |
| AppLovin Volatility | 30-day 9.76% |
| Trade Deal Effect | 10/27-28 Dow +0.7%, Nasdaq +1.9% |
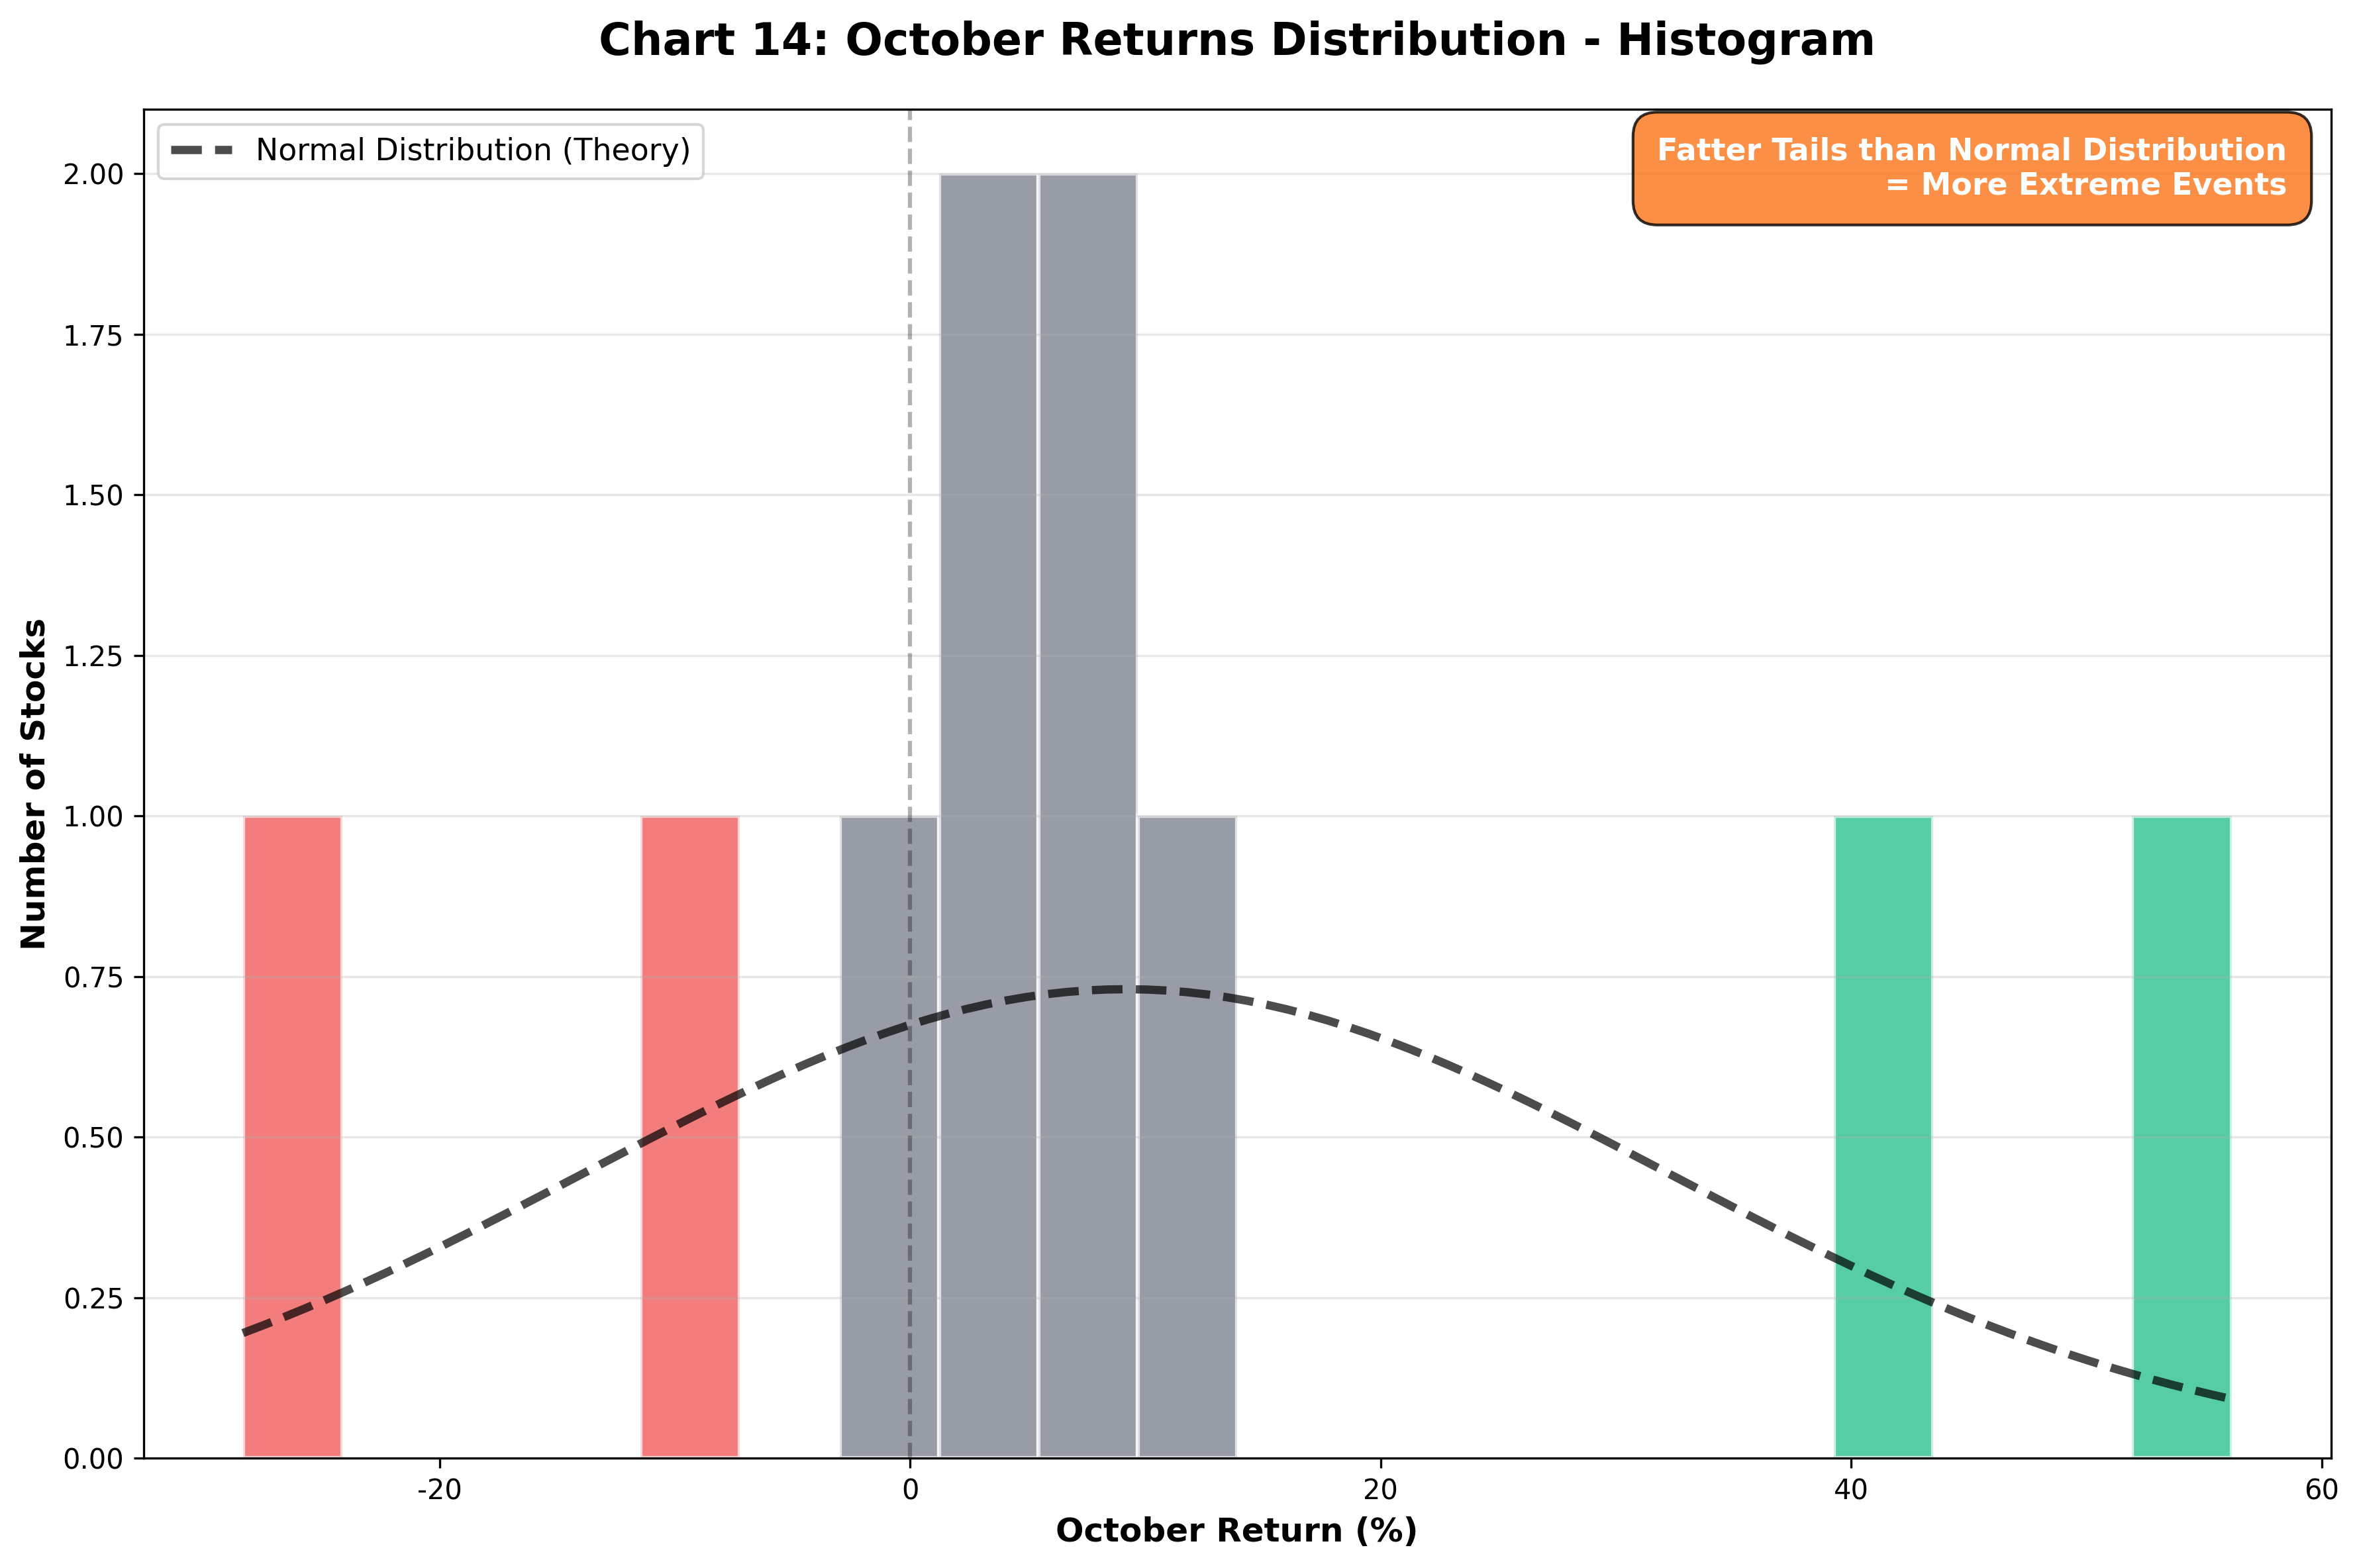
This histogram shows the distribution of major stocks' returns during October. The X-axis shows return ranges, the Y-axis shows the number of stocks in each range. The black dotted line is the theoretical normal distribution curve.
Key Findings:
- Most stocks are distributed between -10% and +10% (central concentration)
- However, extreme tails on both sides are fat (left red and right green bars)
- Extreme events that should barely exist under normal distribution actually occur quite frequently
- This means "Black Swan" events happen much more often than theory predicts
The top-right annotation summarizes the key: "Fatter tails than normal distribution = more extreme events". This is a characteristic of modern financial markets and shows why we need to prepare for extreme volatility.
References and Data Sources:
- Bloomberg, Reuters, CNBC
- Yahoo Finance, Benzinga
- Morningstar, FactSet
- Company disclosure documents
- World Gold Council
- Federal Reserve economic data
This article is not investment advice and is written for educational purposes only. Investment decisions should be made at your own judgment and responsibility.
Summary Box:
💡 3 Key Lessons from October

1. 🎢 Meme Stock (Beyond Meat)
   → Social media frenzy is a warning sign, check fundamentals

2. 💰 Gold Flash Crash
   → Safe havens in the age of volatility, don't be overconfident

3. 🤝 Big Tech Investment (Intel, Nokia)
   → Strategic partnerships are game changers
   → But turnarounds take time

📌 Key: Don't get swayed by short-term noise,
         Focus on long-term fundamentals
Comments (0)
No comments yet. Be the first to comment!