October 2025 US Market Summary: Beyond Meat and Gold (Part 1)
Introduction: A Month of Heaven and Hell
October 2025 was an unforgettable month for investors in the US stock market. While major indices hit all-time highs, one stock soared 1,300% in a week only to crash over 70%, and gold—traditionally viewed as a safe haven—experienced a 'flash crash' plunging more than 5% in a single day.
In this article, we'll examine three dramatic events from October in the US markets to understand where modern financial market volatility comes from and what lessons we should learn.
October US Markets by the Numbers
In October 2025, all major US indices posted positive monthly returns. The S&P 500 rose about 3.6%, the Nasdaq showed even higher gains, and the Dow Jones maintained steady upward momentum. But behind these numbers lurked extreme volatility.
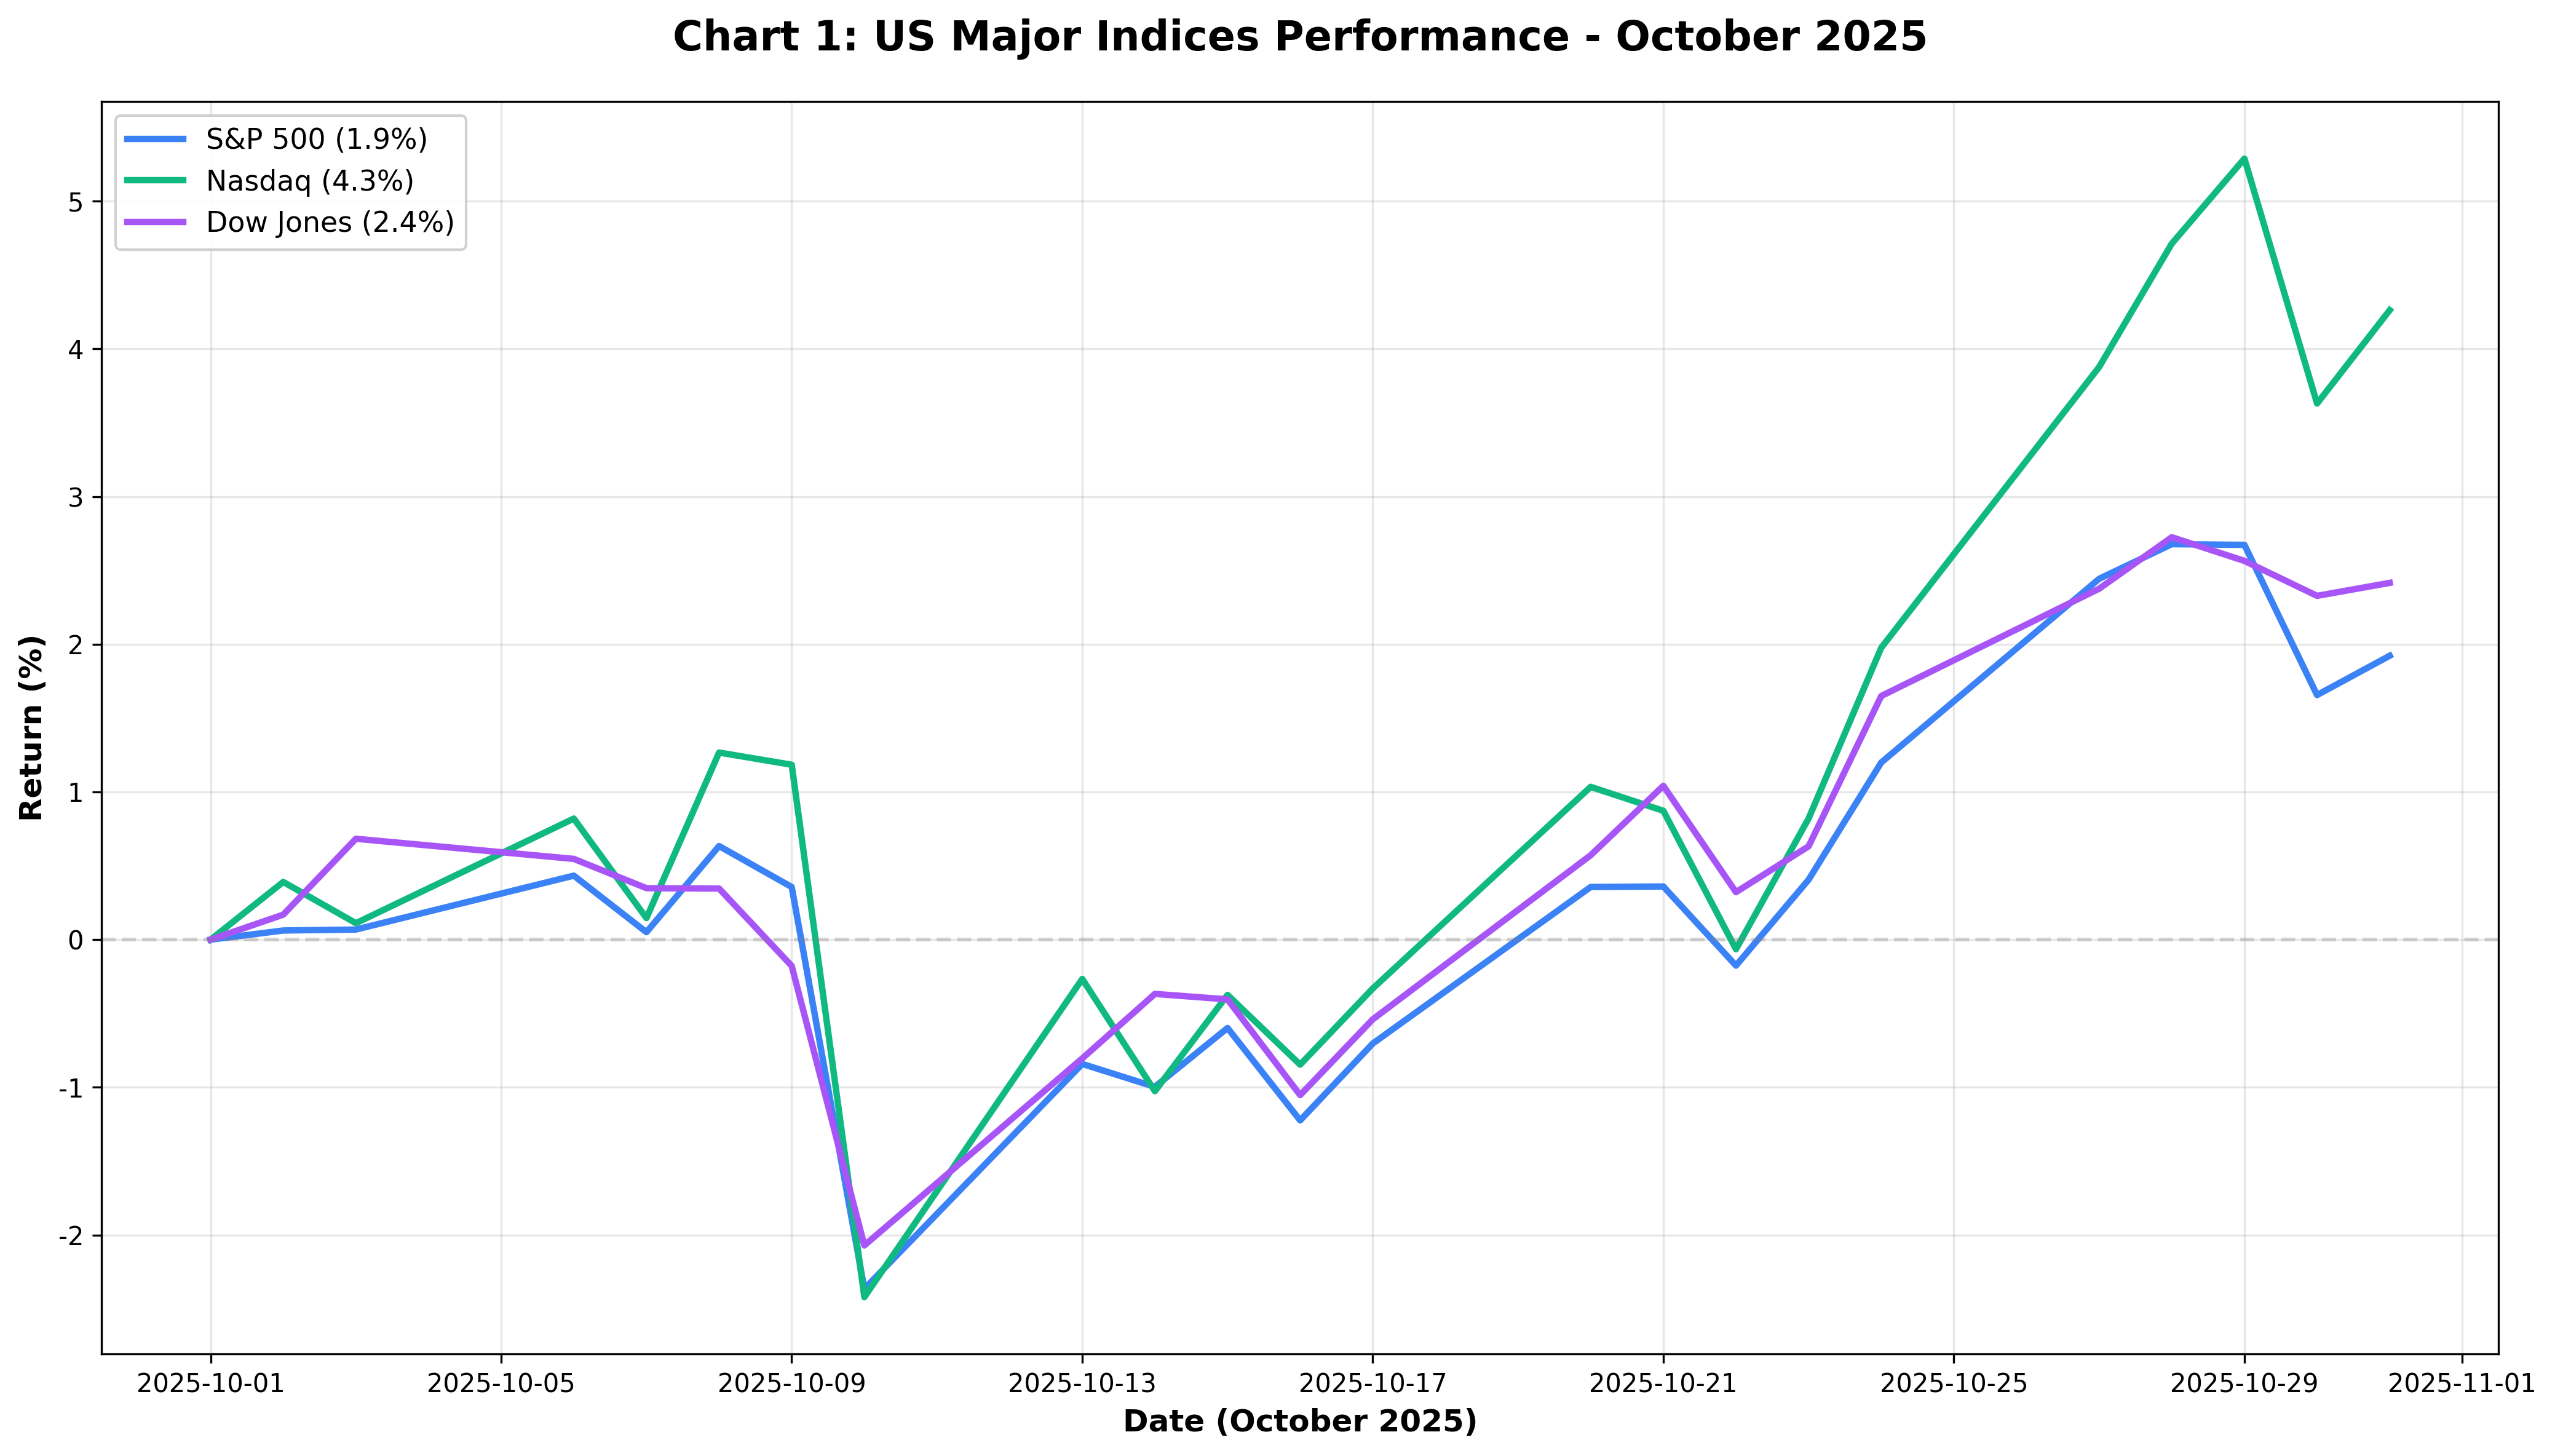
As the chart above shows, October was far from a smooth upward trajectory. The indices repeatedly surged and plunged, making investors' hearts race.
Event 1: Beyond Meat - Anatomy of a Meme Stock Frenzy
What Happened?
Beyond Meat (Ticker: BYND) delivered a shocking rollercoaster ride to investors in mid-October.
Timeline:
- October 10: Stock price $2.01
- October 13: Convertible bond exchange offer announced (massive dilution with ~300M new shares)
- October 16: Stock crashes 75% to $0.52 (in one week)
- October 21 Monday: Added to Roundhill Meme Stock ETF
- October 22 Tuesday:
- Morning: Walmart announces 2,000-store rollout
- Intraday: Begins 600% surge
- Volume: 1.7 billion shares traded (each share traded 4+ times on average)
- October 22 Wednesday:
- Intraday high: $7.69 (112% additional gain)
- Close: -1% (giving back all gains and dropping 27%)
- October 24 Friday: $2.19 (-23%)
- October 28 Monday: Up 15% again
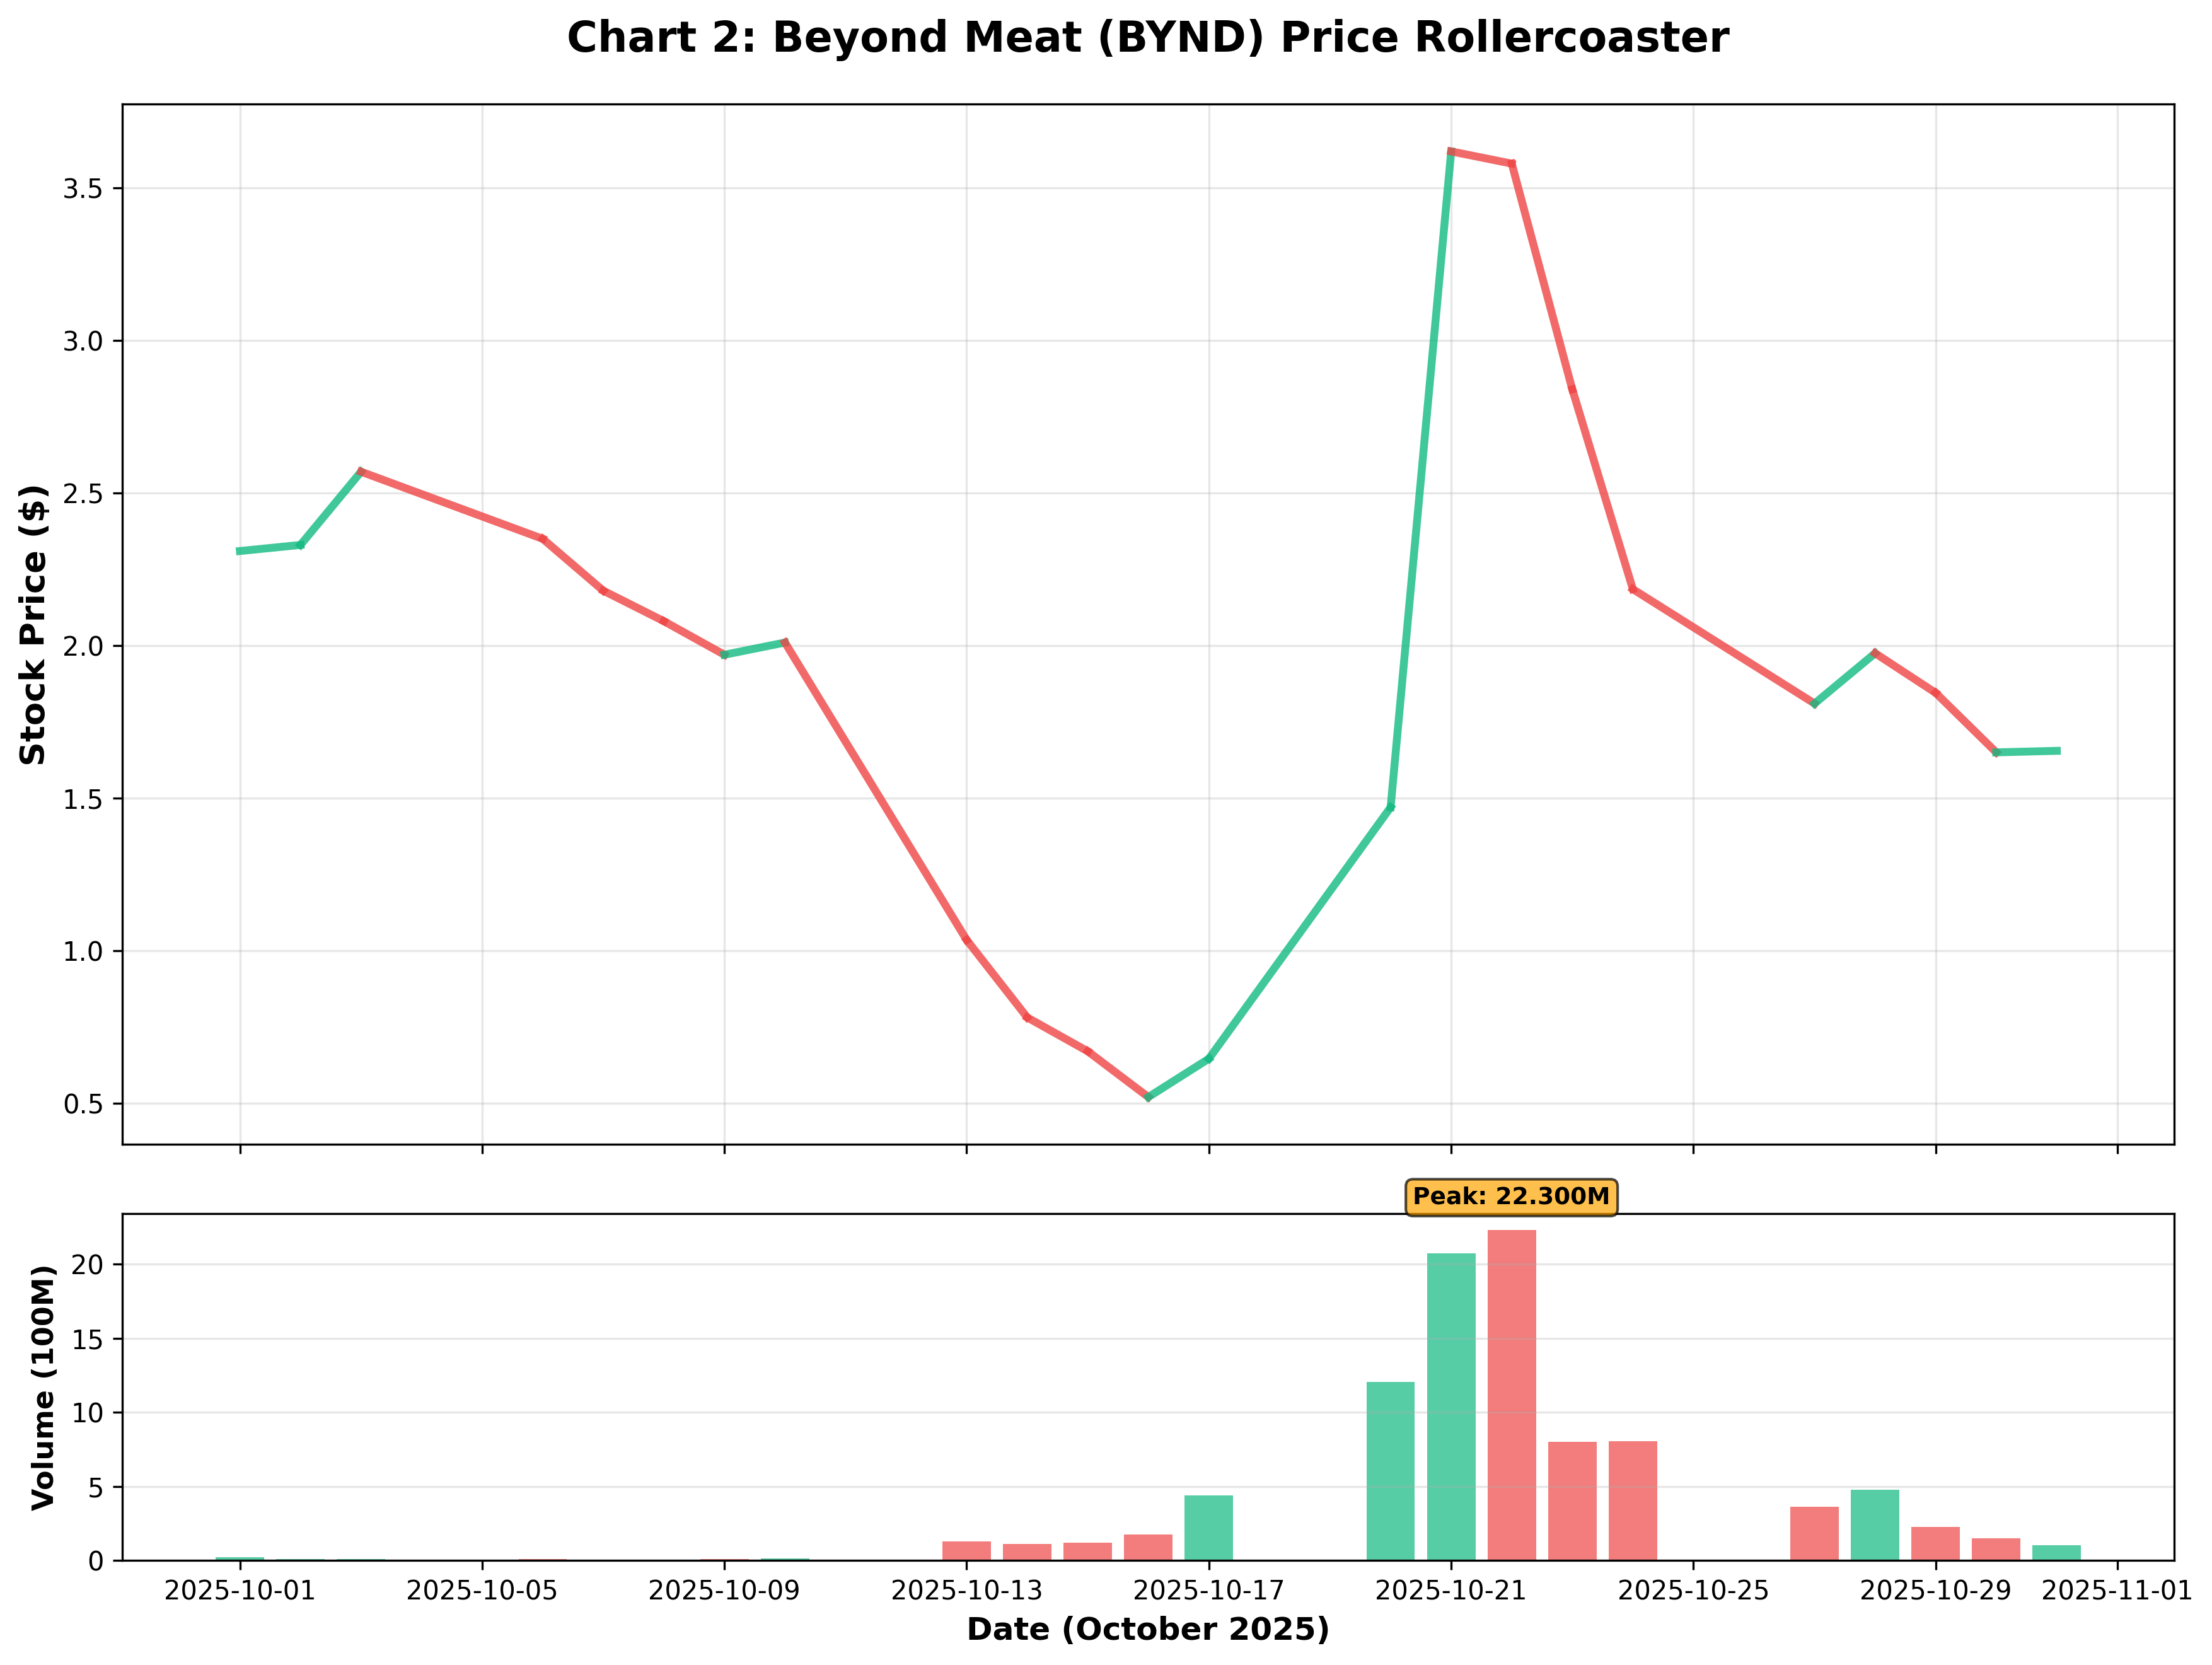
The chart above shows Beyond Meat's October price action. The main chart reveals a dramatic U-shape transforming into an inverted U-shape pattern. The stock soared from a $0.52 low to a $7.69 high before crashing back to the $2 range. The volume chart at the bottom shows explosive trading on October 22—1.7 billion shares traded in a single day, meaning every outstanding share changed hands an average of 4+ times.
Why Did This Happen?
Three factors combined to create this extreme volatility.
1. Short Squeeze Beyond Meat had 54% of its float shares sold short as of late September. More than half of investors bet "this company will fail," but when the sudden surge began, they had to quickly buy back shares to limit losses, fueling further upward momentum.
2. Meme Stock Effect Social media platforms like Reddit and X (formerly Twitter) spread the rallying cry "Take Beyond Meat to the Moon!" attracting retail investors. Remember the GameStop saga of 2021? The same pattern repeated.
3. Lack of Fundamentals But the company's actual situation was grim:
- Q2 revenue: $75 million (down 19.6% year-over-year)
- Operating loss: $34.9 million
- 6% workforce reduction
- Walmart rollout was positive but didn't solve the company's fundamental problems
Meme Stocks Repeat
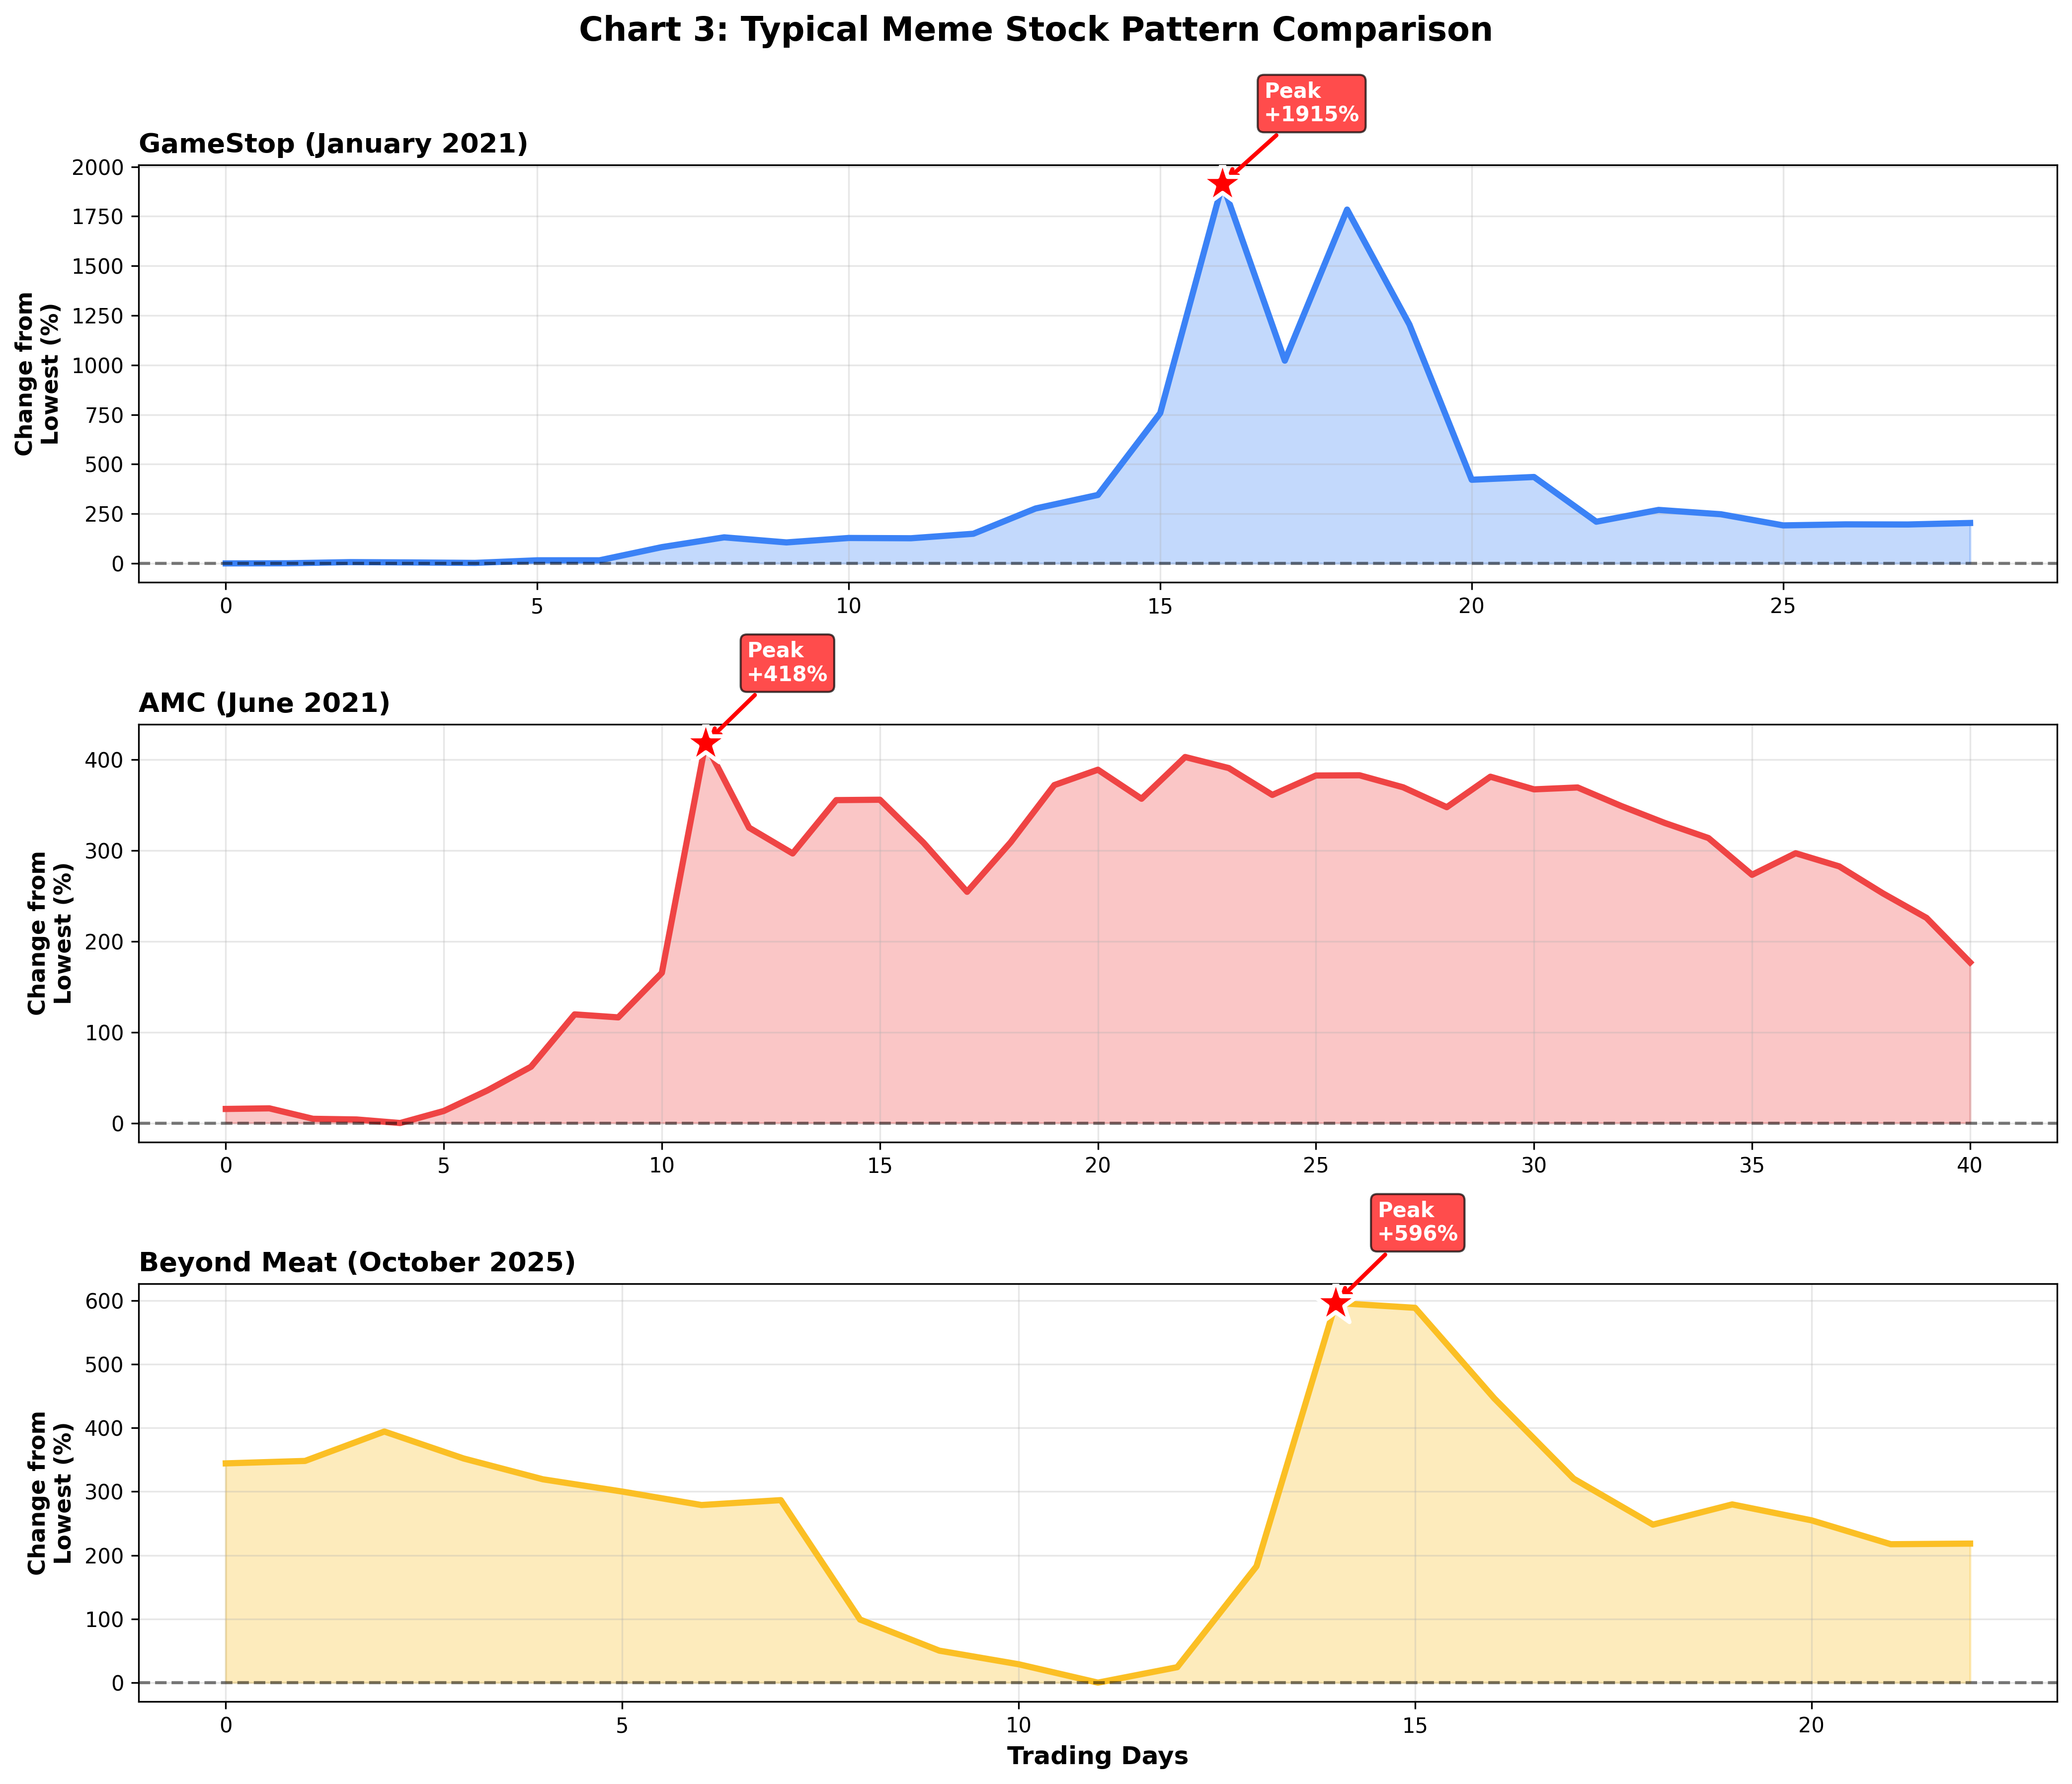
The chart above compares three representative meme stock cases: GameStop in January 2021, AMC in June 2021, and Beyond Meat in October 2025. Remarkably, they all show nearly identical patterns:
- Phase 1: Gradual decline - fundamentals deteriorate, stock slowly falls
- Phase 2: Vertical surge - social media buzz and short squeeze cause explosion
- Phase 3: Sharp decline - reality sets in, rapid drop
- Phase 4: Base formation - sideways movement at low levels
All chart Y-axes are normalized to "% change from lowest point" to directly compare patterns regardless of scale. The red stars on each chart mark when social media buzz exploded.
Lesson: The Danger of Meme Stocks
History repeats itself. From GameStop and AMC in 2021, to various small caps in 2024, to this Beyond Meat episode. Meme stocks share these characteristics:
- High short interest (30%+)
- Social media virality
- Surges unrelated to fundamentals
- Eventually ending in sharp declines
Jefferies analyst Kaumil Gajrawala assessed: "The company is shrinking to survive—cutting costs, rethinking strategy, restructuring distribution."
Key Lesson: A stock surge doesn't mean the company improved. Especially when you hear "to the moon" on social media—that's a warning signal.
Event 2: Gold's Flash Crash - The Safe Haven Betrayal
What Happened?
Gold is traditionally called a "safe haven asset." It's where people turn during stock market uncertainty, war concerns, or inflation fears. But in October 2025, gold experienced a 'flash crash' plunging over 5% in a single day.
Timeline:
- Late September: Gold toward all-time highs after 9 consecutive weeks of gains
- Early-mid October: Federal Reserve rate cuts, trade tensions fuel continued gold rise
- Mid-October: All-time highs at $4,350-$4,380
- October 21 Monday:
- Morning 9am ET: $4,208
- During the day: Over 5% plunge
- Low: Breaking $3,990
- October 22: Further decline on US-China trade negotiation progress news
- October 23: Consolidation in $4,100-$4,140 range
- After: Continued volatility, fluctuating near $4,000
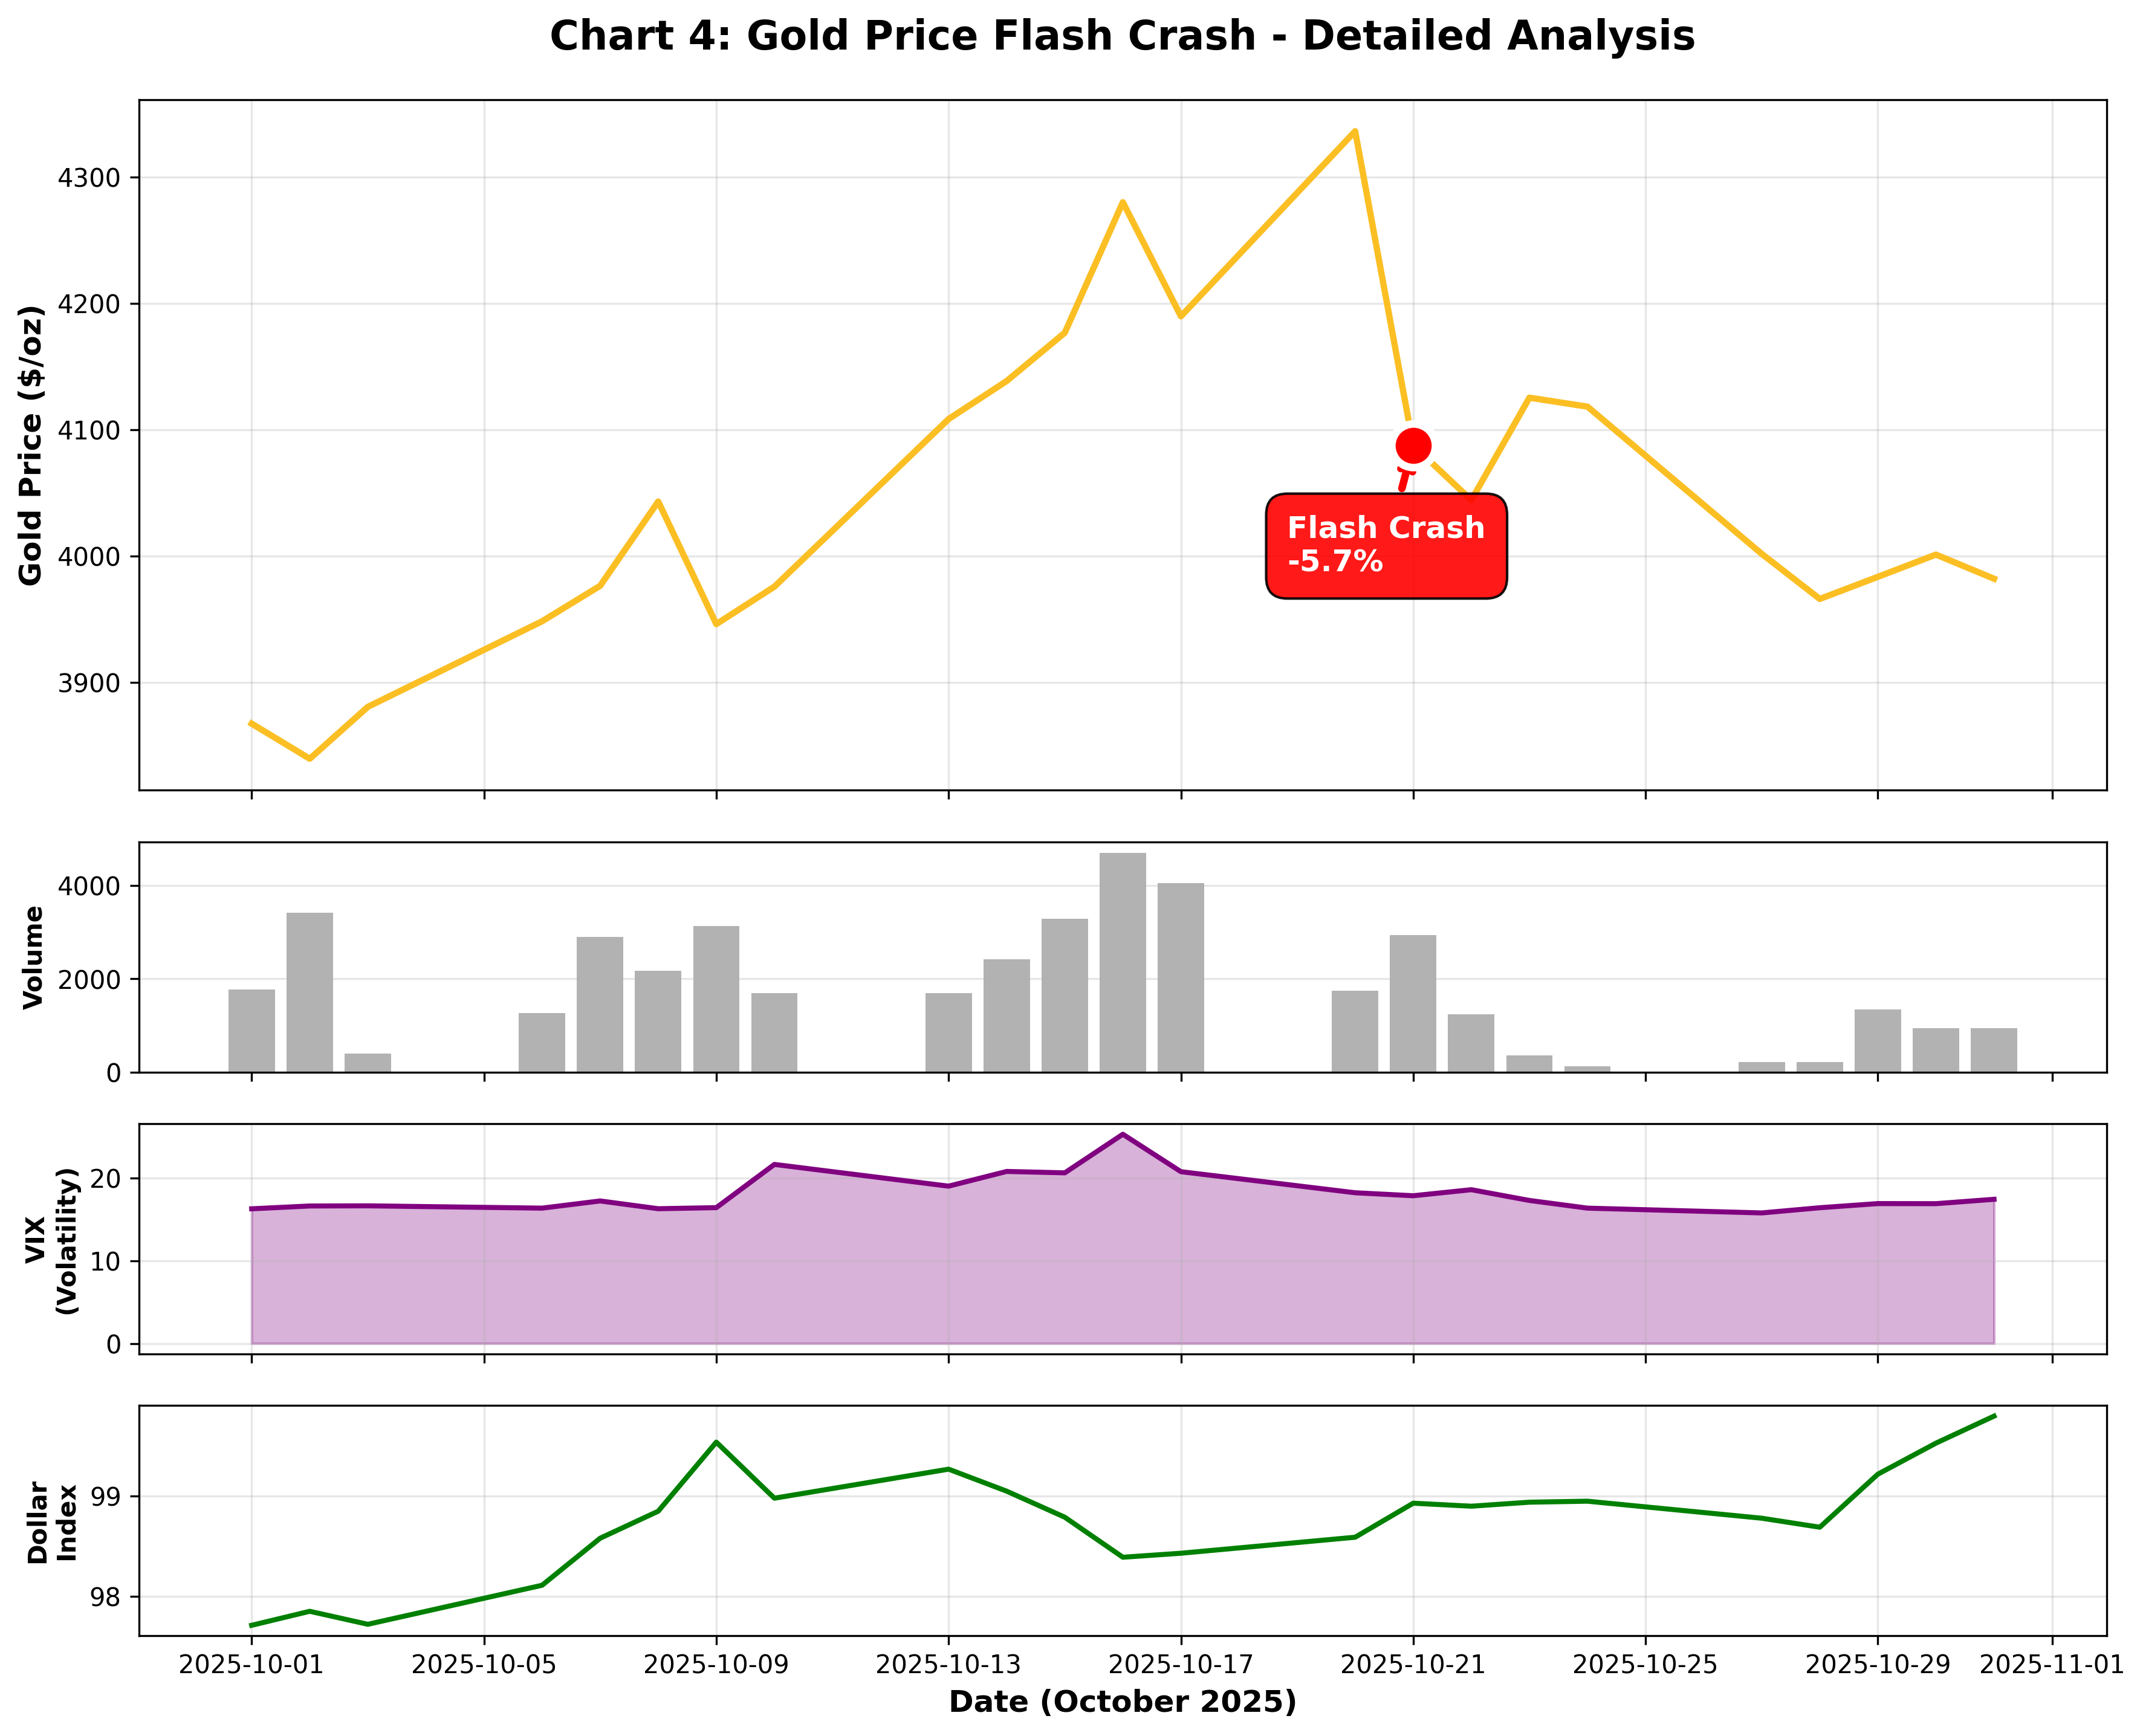
The chart above shows October's gold market flash crash with multiple indicators:
- Main Chart (top): Gold price movement over October. The steady rise on the left sharply breaks in the center as the flash crash occurs.
- Volume (second): Trading volume exploded on the flash crash day.
- VIX Index (third): The market volatility indicator VIX spiked at the crash moment, reflecting panic.
- Dollar Index (fourth): The dollar strengthened, applying downward pressure on gold prices.
This chart makes it clear: gold's flash crash wasn't an isolated event, but the result of multiple market factors working together.
Why Did the 'Safe Haven' Crash?
1. Overheated Market
- September saw record monthly inflows of $17 billion into gold ETFs
- Gold prices rose over 50% in 2025 alone (largest since 1979)
- Technical indicators showed 'extreme overbought' signals
IG analyst Tony Sycamore noted: "Gold was extremely overheated and overbought. FOMO (Fear Of Missing Out) drew tremendous speculative capital."
2. Trade Negotiation Optimism On October 27, President Trump announced he would "meet President Xi in Korea on the 29th to finalize trade negotiations." Suddenly, the "safe haven" seemed unnecessary.
3. Algorithmic Trading Amplification As the initial decline began, programmed automatic sell orders triggered in cascade, accelerating the fall. This marked the largest 2-day decline (6%) since 2013.
October 2025 Gold Market in Historical Perspective
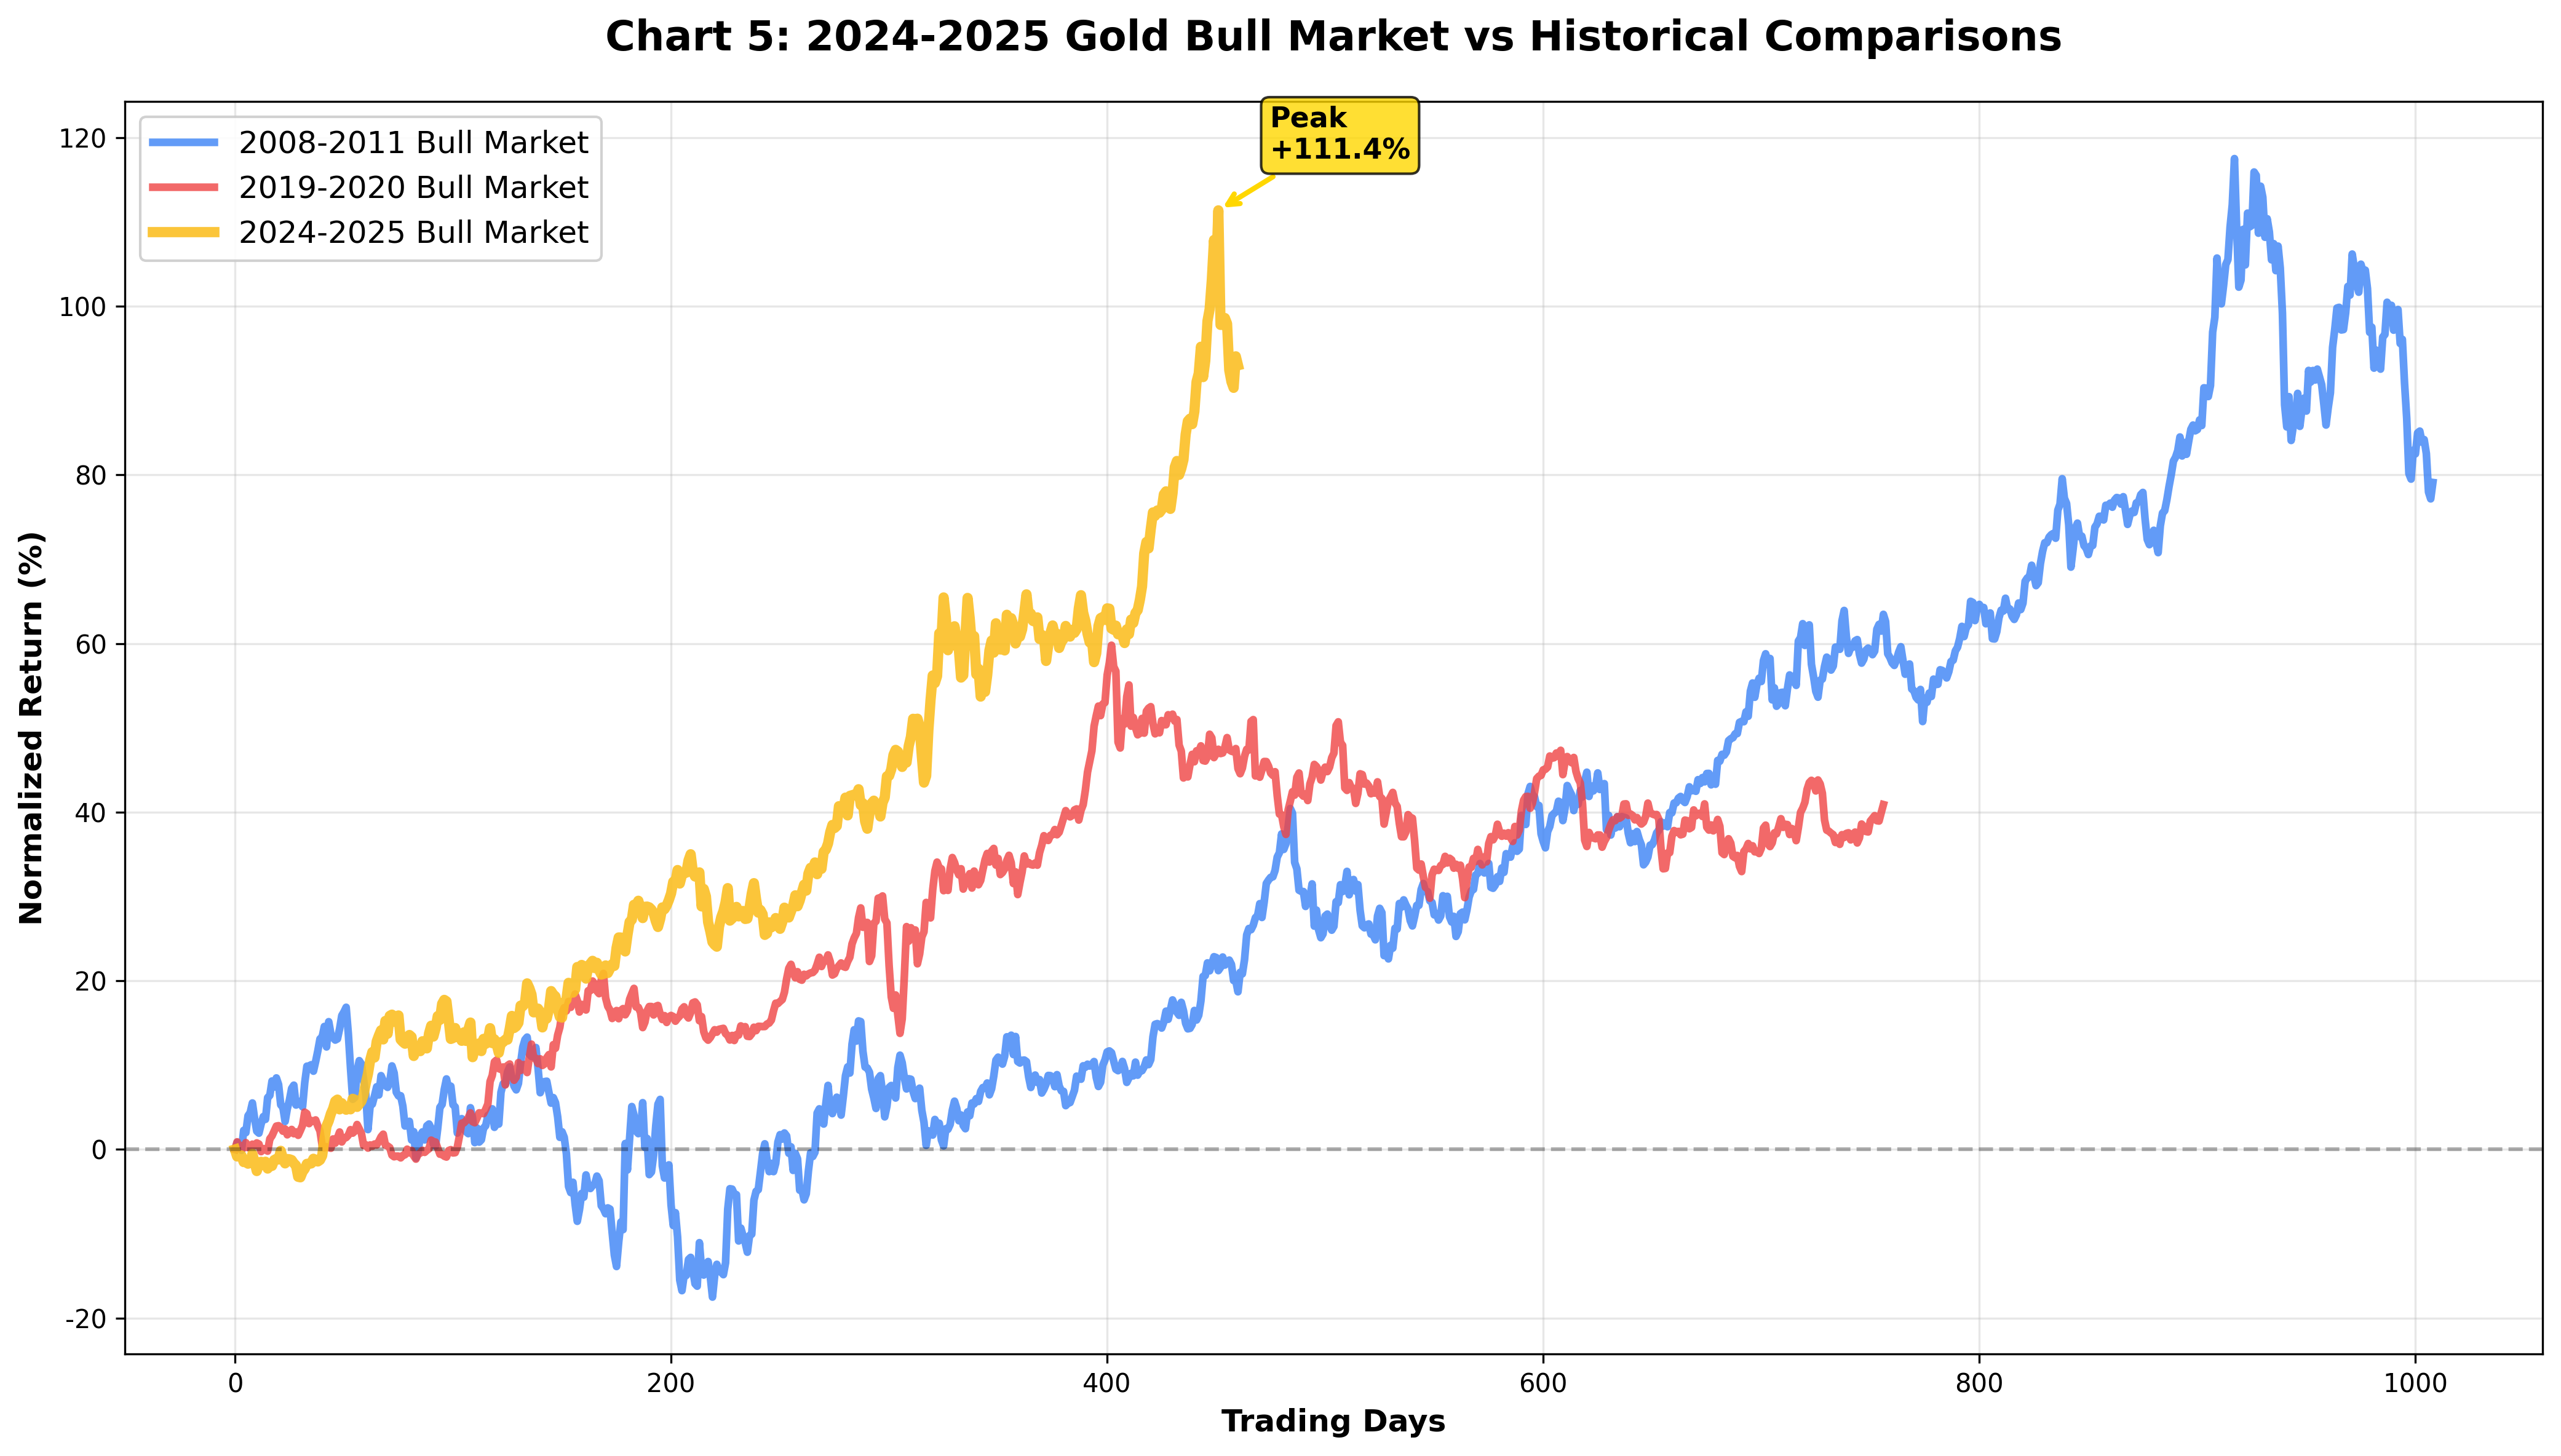
The chart above compares the 2024-2025 gold bull market to major past bull markets. All data is normalized to 0% at each bull market's starting point for direct pattern comparison.
Note that the 2024-2025 gold bull market (gold line) shows a steeper rise than any past bull market. Compared to the 2008-2011 financial crisis period (blue line) or the 2019-2020 COVID period (red line), the current gold bull market shows much more rapid movement.
What does this mean? First, the scale and speed of capital flowing into the gold market differs from the past. Second, with algorithmic trading and ETF influence, the gold market now moves as quickly as stock markets.
Structural Changes in the Gold Market
Unlike past gold markets, the 2025 gold market has these characteristics:
1. Institutionalization
- Gold ETFs comprise a large market share
- Increased algorithmic trading weight
- No longer a "slowly moving" safe haven
2. Increased Retail Investor Participation
- Information spread through social media
- Spreading perception that "gold rises quickly too"
- Increased short-term profit taking
3. Stronger Macroeconomic Linkage
- Strong dollar → weak gold
- Trade negotiation news → immediate reaction
- Increased correlation with stock markets
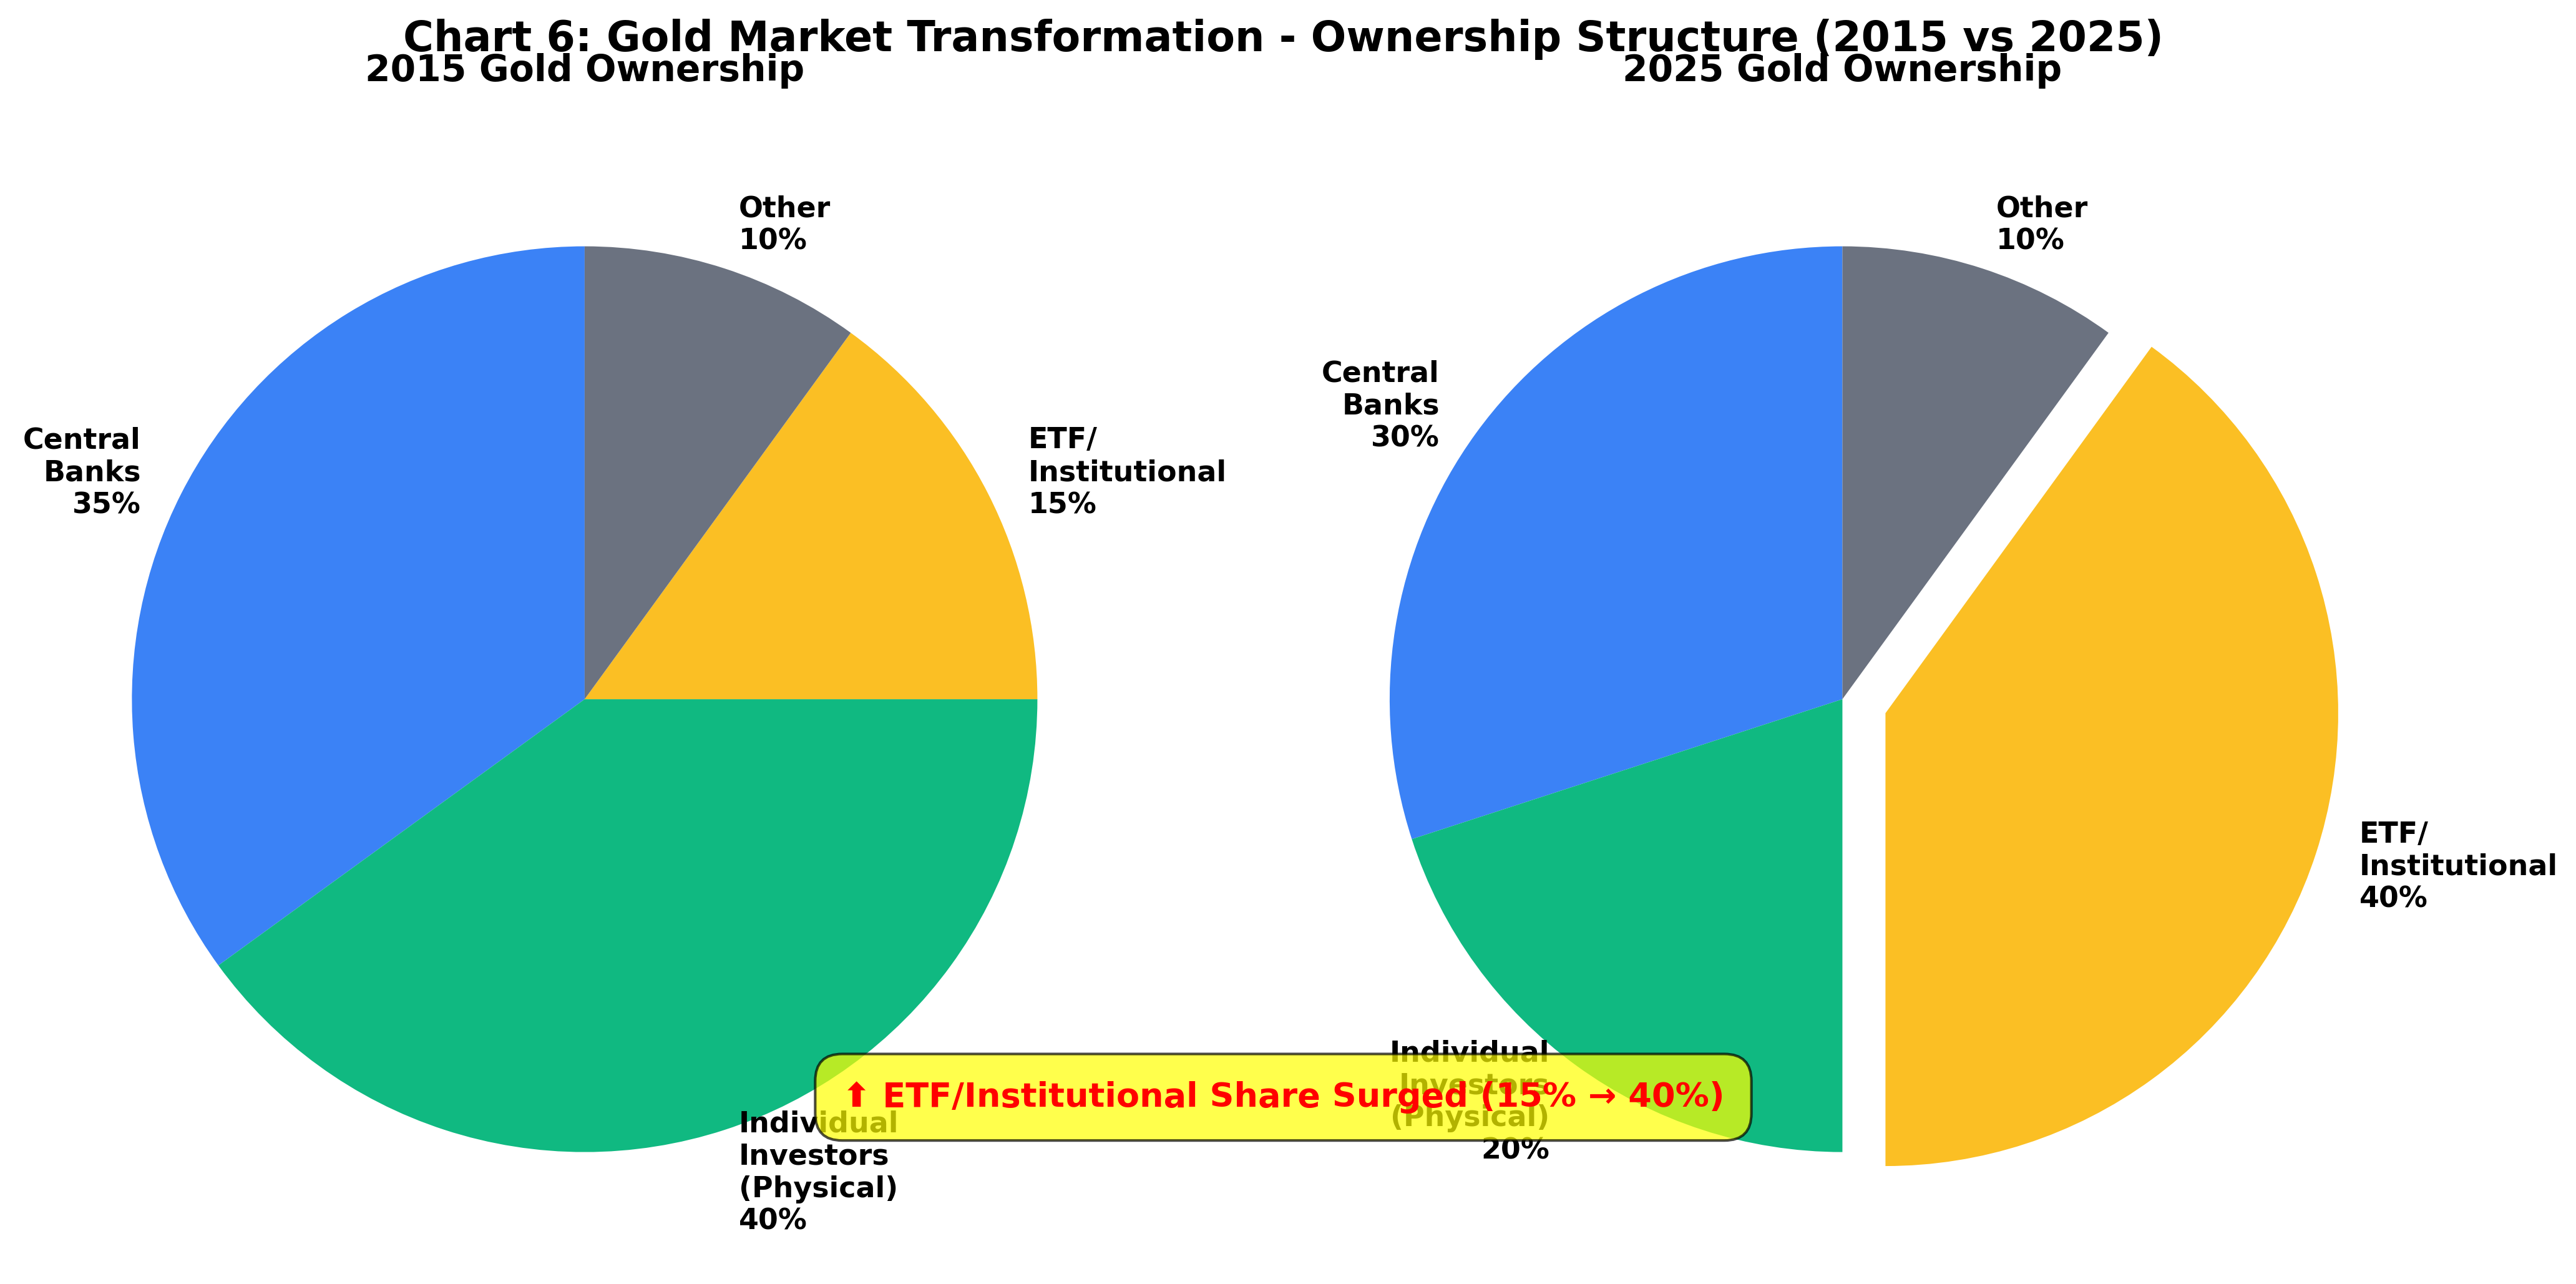
The chart above shows the most important structural change in the gold market. Comparing gold ownership composition between 2015 and 2025, we see ETF and institutional investor share surge from 15% to 40%. Meanwhile, individual physical holdings dropped from 40% to 20%—cut in half.
This change fundamentally altered the gold market's character:
- Fast capital movement: ETFs can be sold with one click. Completely different from the era of storing and physically trading gold bars.
- Algorithmic trading: Institutional investors use automated trading systems. When certain conditions are met, programs automatically execute large-scale selling.
- Short-term profit taking: ETF investors tend to pursue short-term gains rather than long-term holding.
Lesson: Safe Havens Aren't Free from Volatility
Key Lessons:
- "Safe haven" is not an absolute concept. When market structure changes, asset characteristics change too.
- Rapid rises contain seeds of rapid falls. Because gold rose too quickly, the correction was harsh.
- Algorithms dominate markets. In modern financial markets, flash crashes can happen in any asset.
The World Gold Council report concluded: "Long-term fundamentals remain solid, but short-term volatility is the new normal."
Continuing in Part 2...
Part 2 will cover Intel and Nokia's dramatic rebounds, and practical investment lessons from October's volatility.
Comments (0)
No comments yet. Be the first to comment!