Momentum vs. Contrarian: What a Decade of Data Taught Us
Imagine two friends who invest very differently. One loves to ride the winners. If a stock has been hot for a year, she piles on. The other has a soft spot for underdogs. He looks for stocks that have been beaten down over the last six months and hopes they rebound. These two approaches are known to professionals as momentum investing and contrarian (mean‑reversion) investing.
Between January 2016 and December 2024 we put both strategies to the test using a basket of large U.S. companies. We let the numbers speak, but we also learned some lessons about psychology, risk and patience along the way. This article walks through the experiment in plain language so that anyone curious about investing can follow along. It isn’t a “get rich quick” recipe – rather, it’s a story about how different strategies behave over time.
How the experiment worked
Our investment universe consisted of about a hundred of the largest publicly listed U.S. companies (think Apple, Microsoft, Tesla and so on). Each month we calculated two signals for every stock:
- Momentum score: How much did the stock go up over the last 12 months, excluding the most recent month? This (12‑1) approach reduces the noise of very short‑term reversals.
- Contrarian score: How poorly did the stock perform over the last six months? We also checked how extreme that drop was compared with the past three years. If a stock wasn’t “oversold” enough, we didn’t buy it.
At the end of each month we did the following:
- Momentum strategy: Rank all stocks by their momentum score and buy the top 20 equally. If any of those winners had an overall negative momentum score (i.e. they were down over 12 months), we placed that sleeve into a cash proxy instead. This is a simple risk filter.
- Contrarian strategy: Rank stocks by their contrarian score and buy the bottom 20 (the most beaten‑down names) equally. If a stock wasn’t oversold enough, we again parked that portion in cash.
- Hold the positions for one month, then re‑run the ranking process. We accounted for a 20 basis‑point (0.2 %) round‑trip trading cost whenever we changed positions.
We repeated the process from 2016 through the end of 2024. The goal wasn’t to design a perfect strategy but to illustrate the difference between chasing strength and betting on a rebound.
A tale of two lines
The first thing we looked at was how the value of $1 grew under each strategy. We start both portfolios at $1 on 31 January 2016 and track their value each month thereafter. The result is the equity curves shown below:
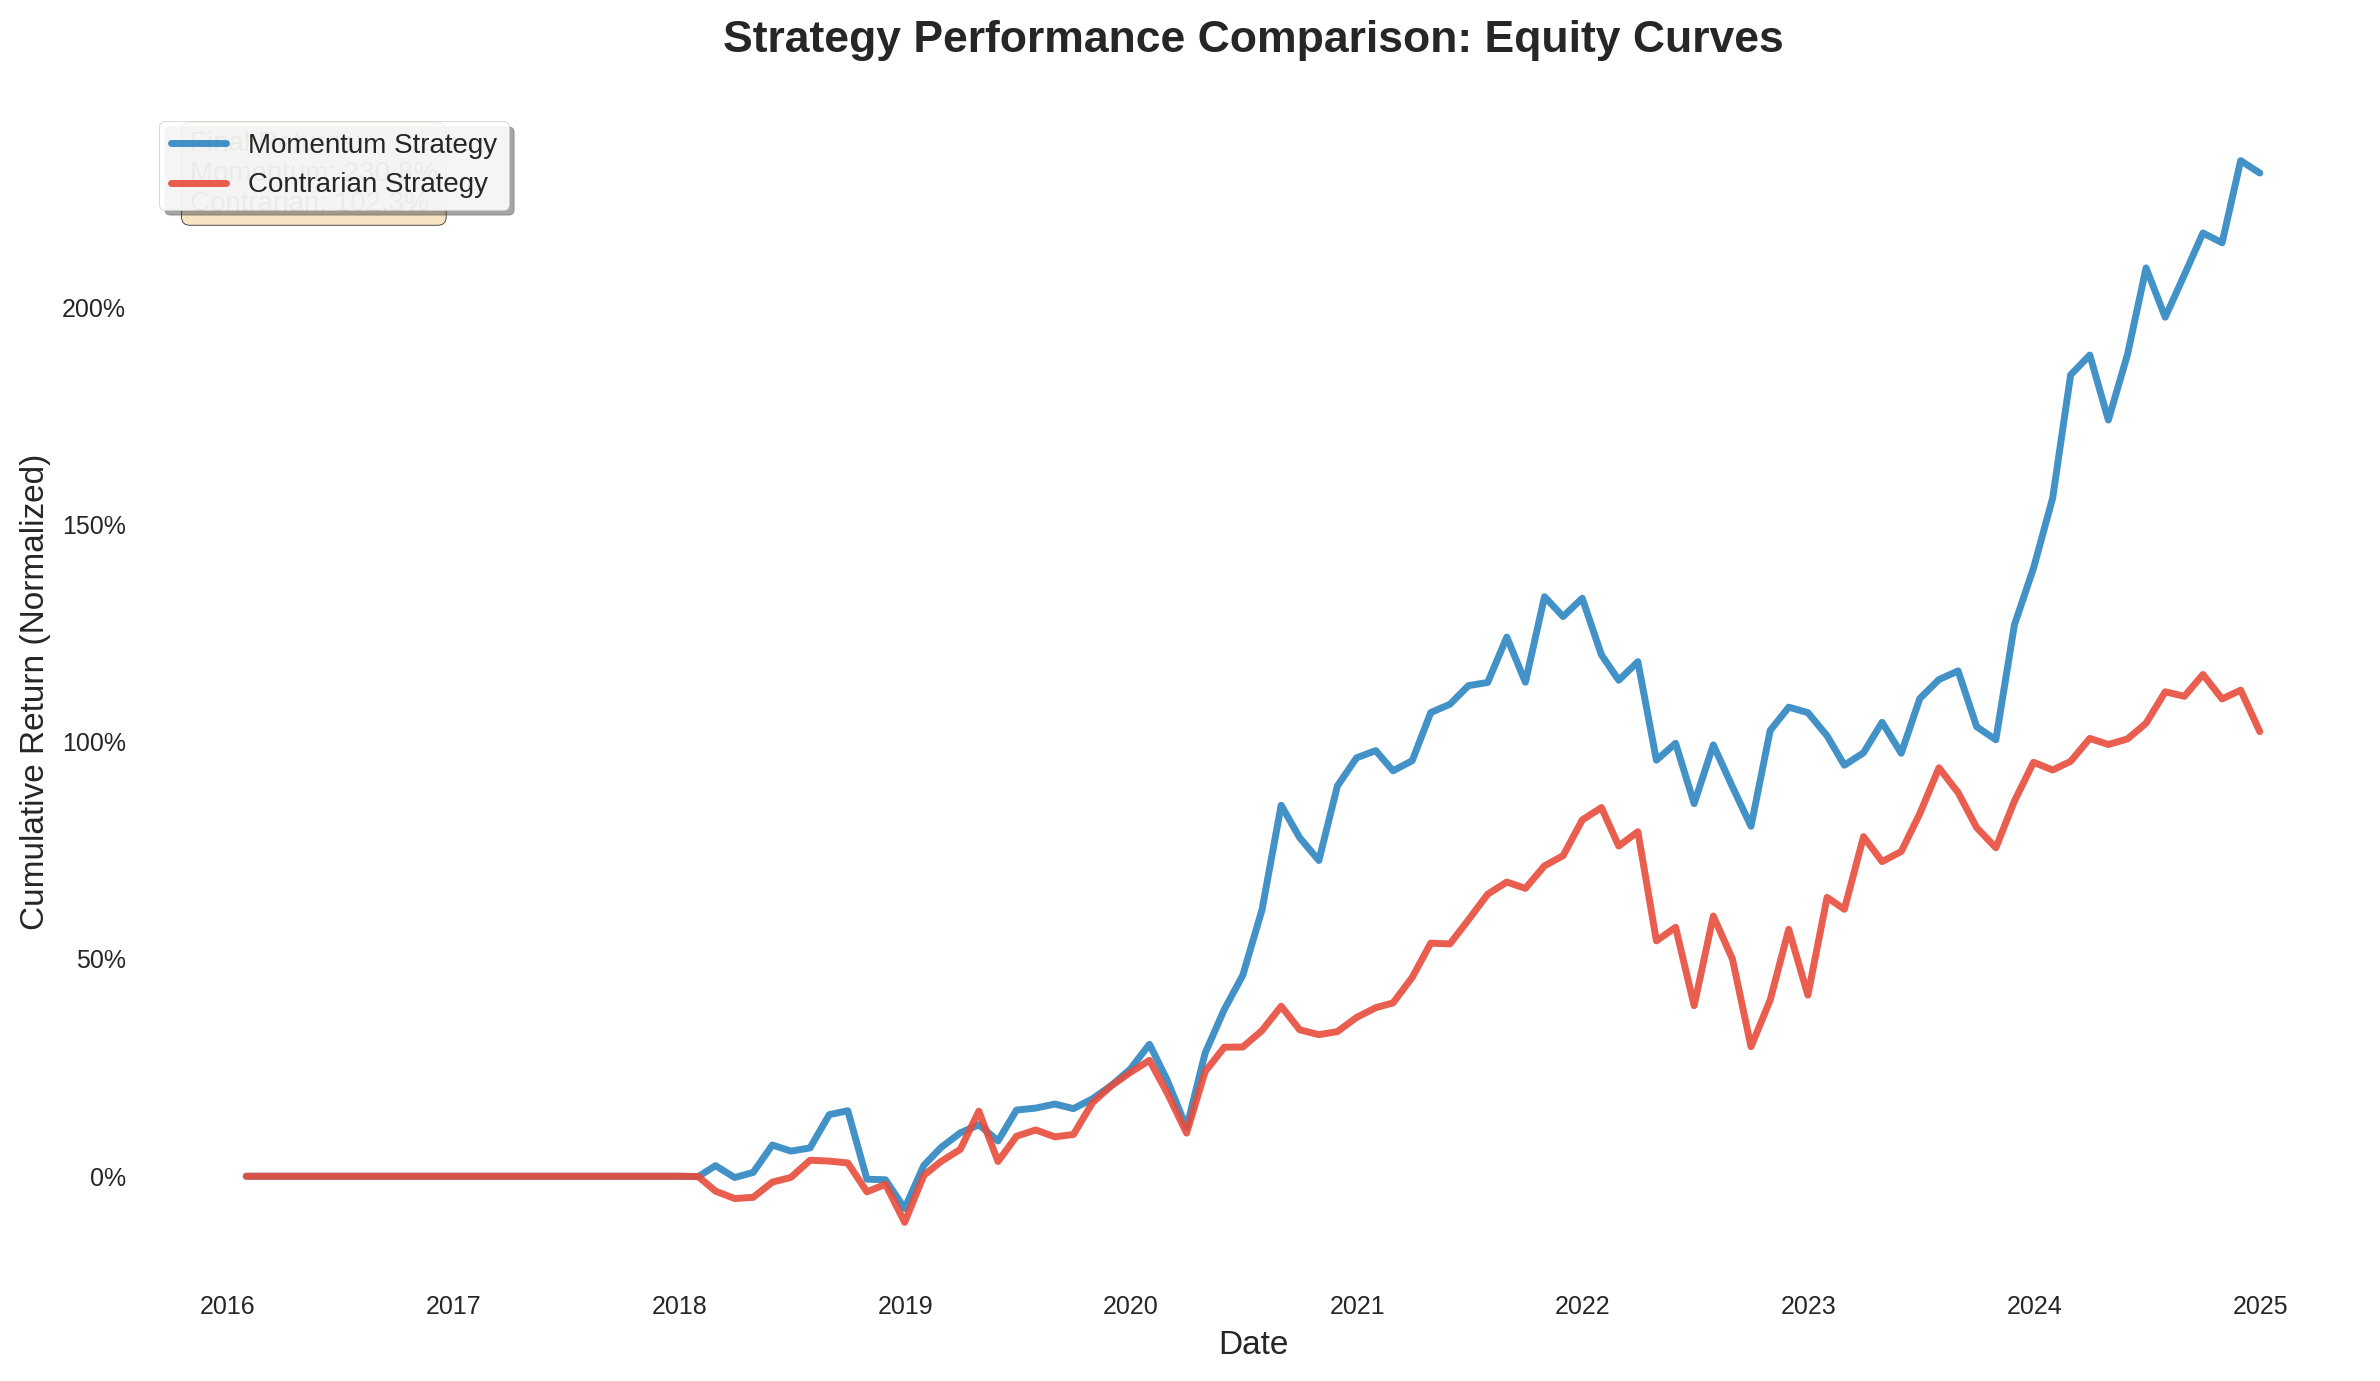
At first glance, both lines wiggle up and down. But there are two important takeaways:
- Momentum pulled ahead. By December 2024 the momentum portfolio was worth roughly 3.3 times the starting amount. The contrarian portfolio doubled, ending at about 2.0 times its starting value. That difference compounds over nine years.
- Both strategies suffered bumps. Around late 2018, March 2020 and during the 2022–2023 bear market both lines dropped sharply. Investing is never a straight line.
The outperformance of momentum isn’t just luck. Over this period technology and healthcare giants like Nvidia (NVDA), Broadcom (AVGO), Eli Lilly (LLY) and Tesla (TSLA) delivered outsized returns. A momentum strategy systematically allocated more capital to these winners and less to the laggards.
Understanding the drawdowns
In finance a drawdown is the percentage drop from a portfolio’s previous high to its subsequent low. It captures how painful the ride can feel when markets go against you. Below are the drawdown histories for both strategies:
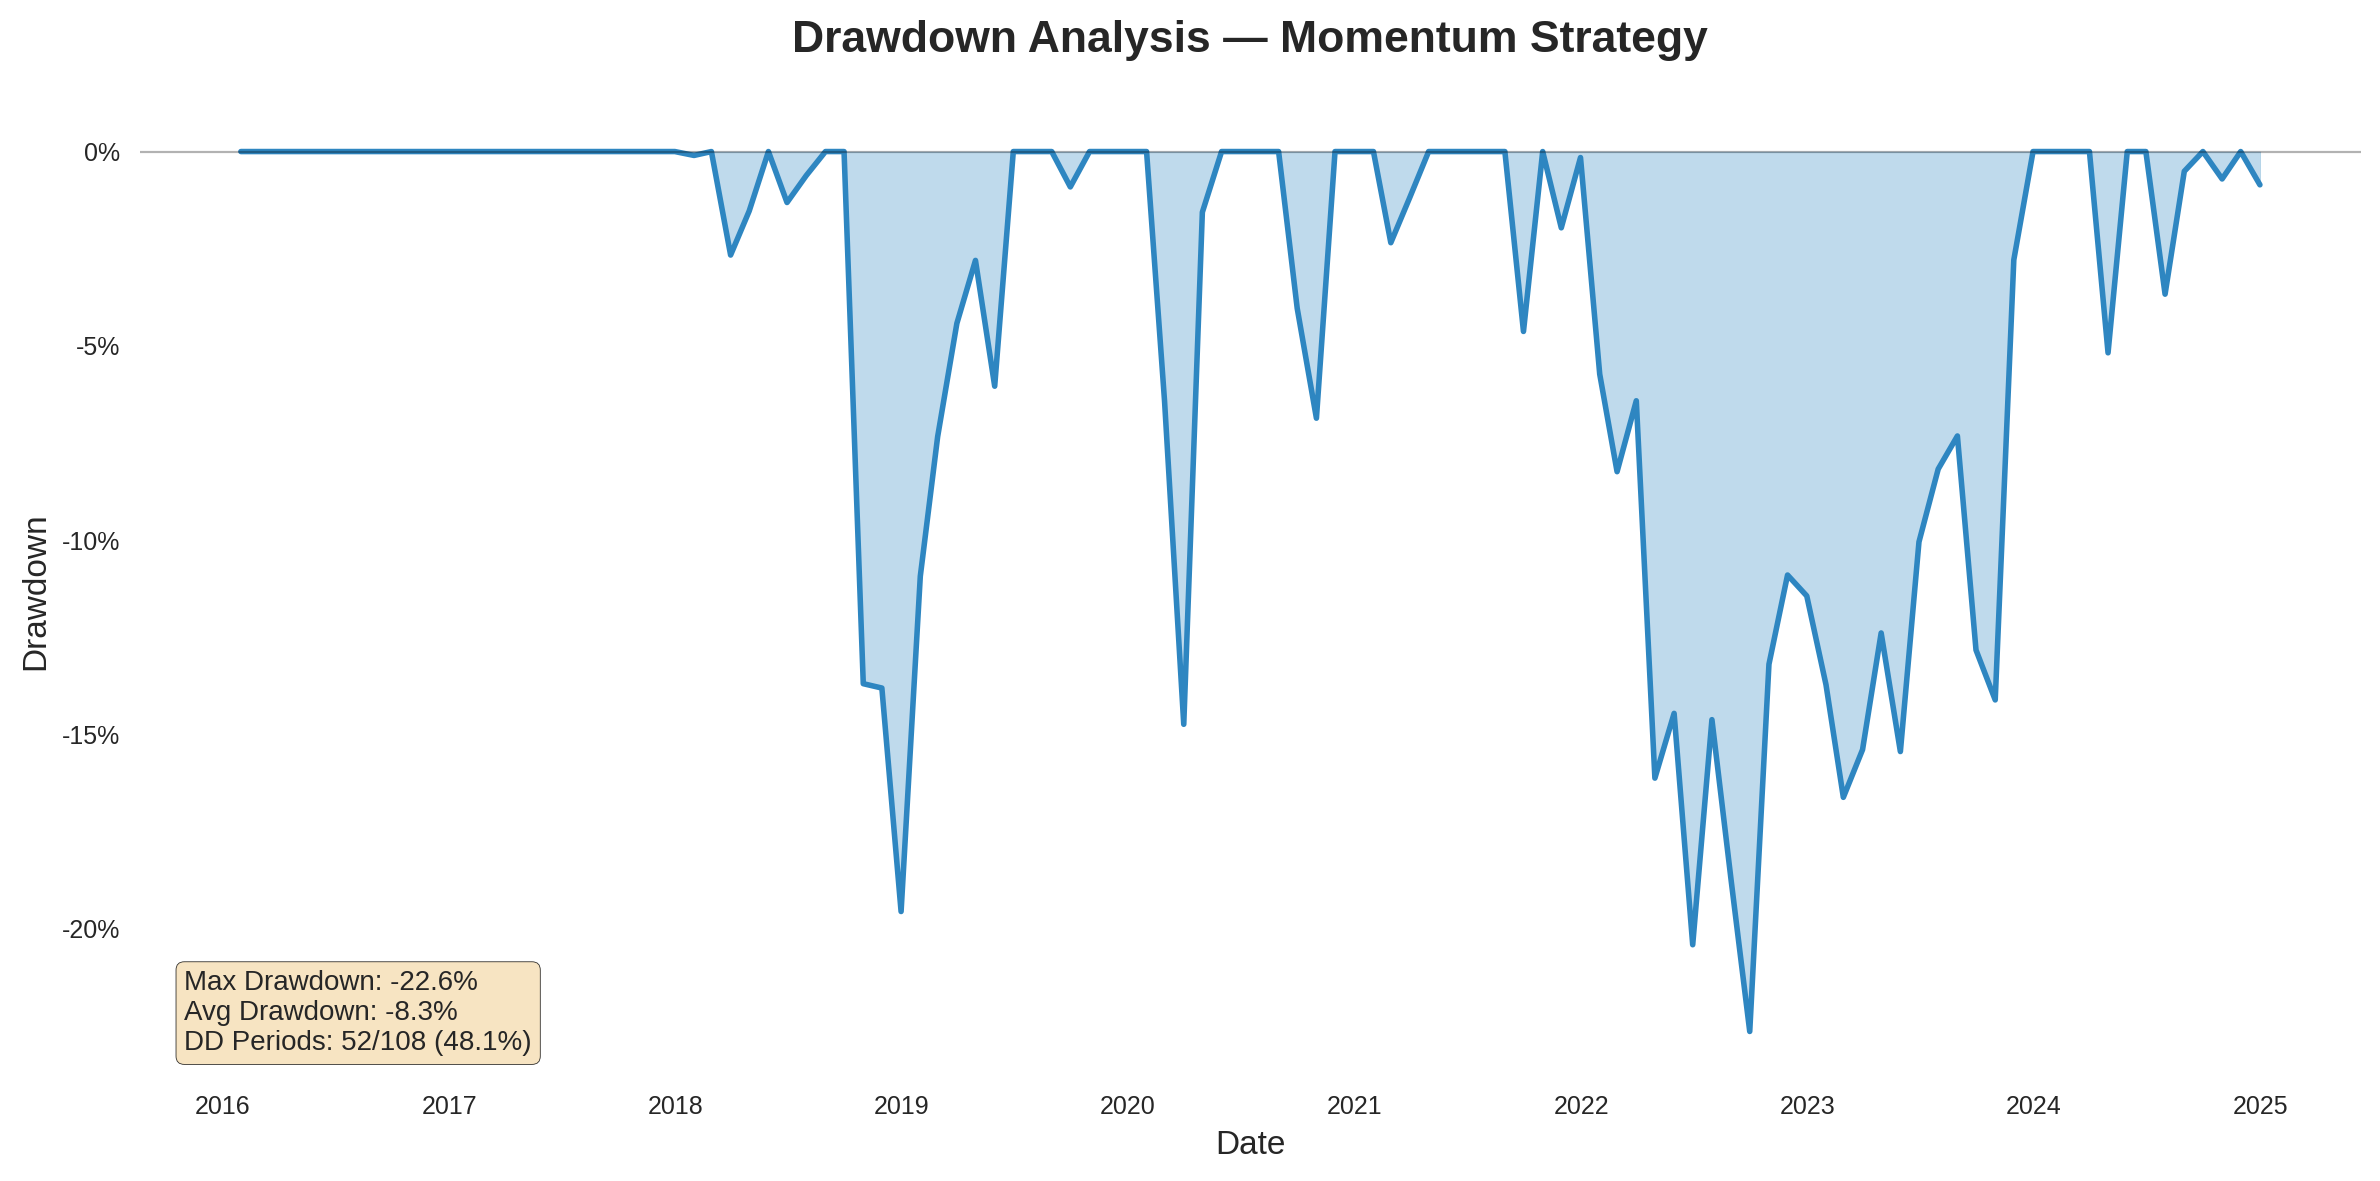
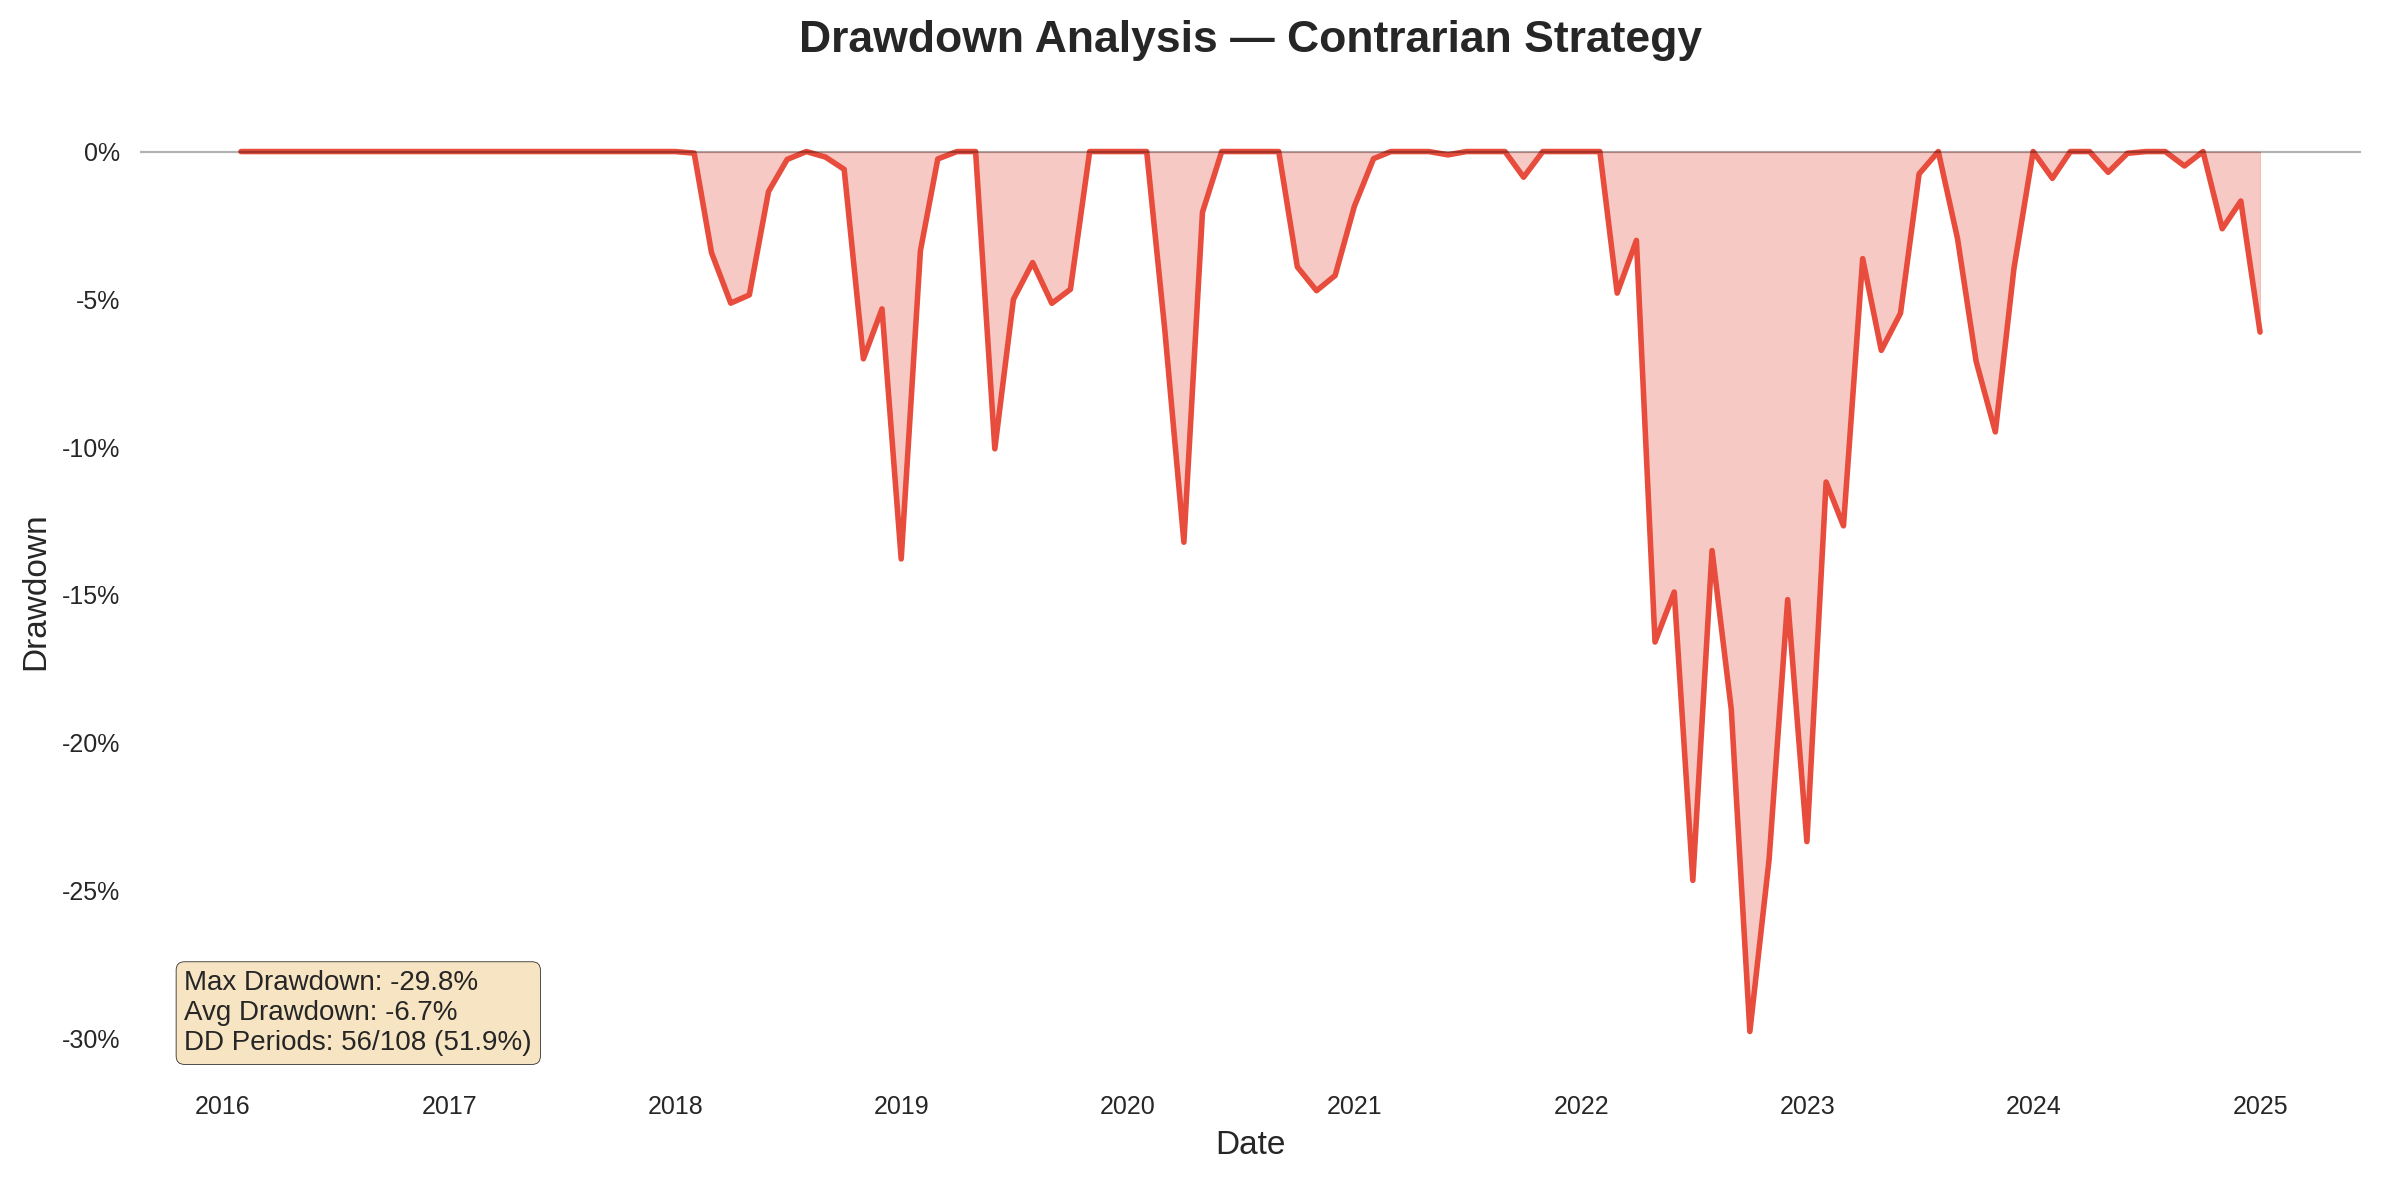
Several points stand out:
- Peak‑to‑trough losses: The momentum strategy’s worst drop was about −23 %, whereas the contrarian strategy suffered an almost −30 % drawdown. These aren’t ruinous, but they’re uncomfortable. The contrarian portfolio tended to buy into sectors or stocks that continued falling (for example, energy and defensive pharmaceuticals around 2019–2021). As a result, its losses were deeper.
- Frequency of drawdowns: Momentum was in drawdown about 48 % of the months; contrarian, about 52 %. In other words, both approaches spent roughly half the time below a previous peak. If you insist on your portfolio setting new highs every month, investing will disappoint you.
- Recovery: The momentum portfolio rebounded more quickly after severe drops (see mid‑2020 and late‑2022), largely because it shifted toward stocks leading the recovery. In contrast, the contrarian portfolio took longer to regain lost ground.
Where did the returns come from?
To demystify the performance gap, we decomposed each portfolio’s returns into contributions from individual stocks and trading costs. The charts below stack those contributions cumulatively over time, highlighting only the top eight positive contributors and grouping the rest under “Other.” TradingCost is negative because costs reduce returns.
Momentum contributors
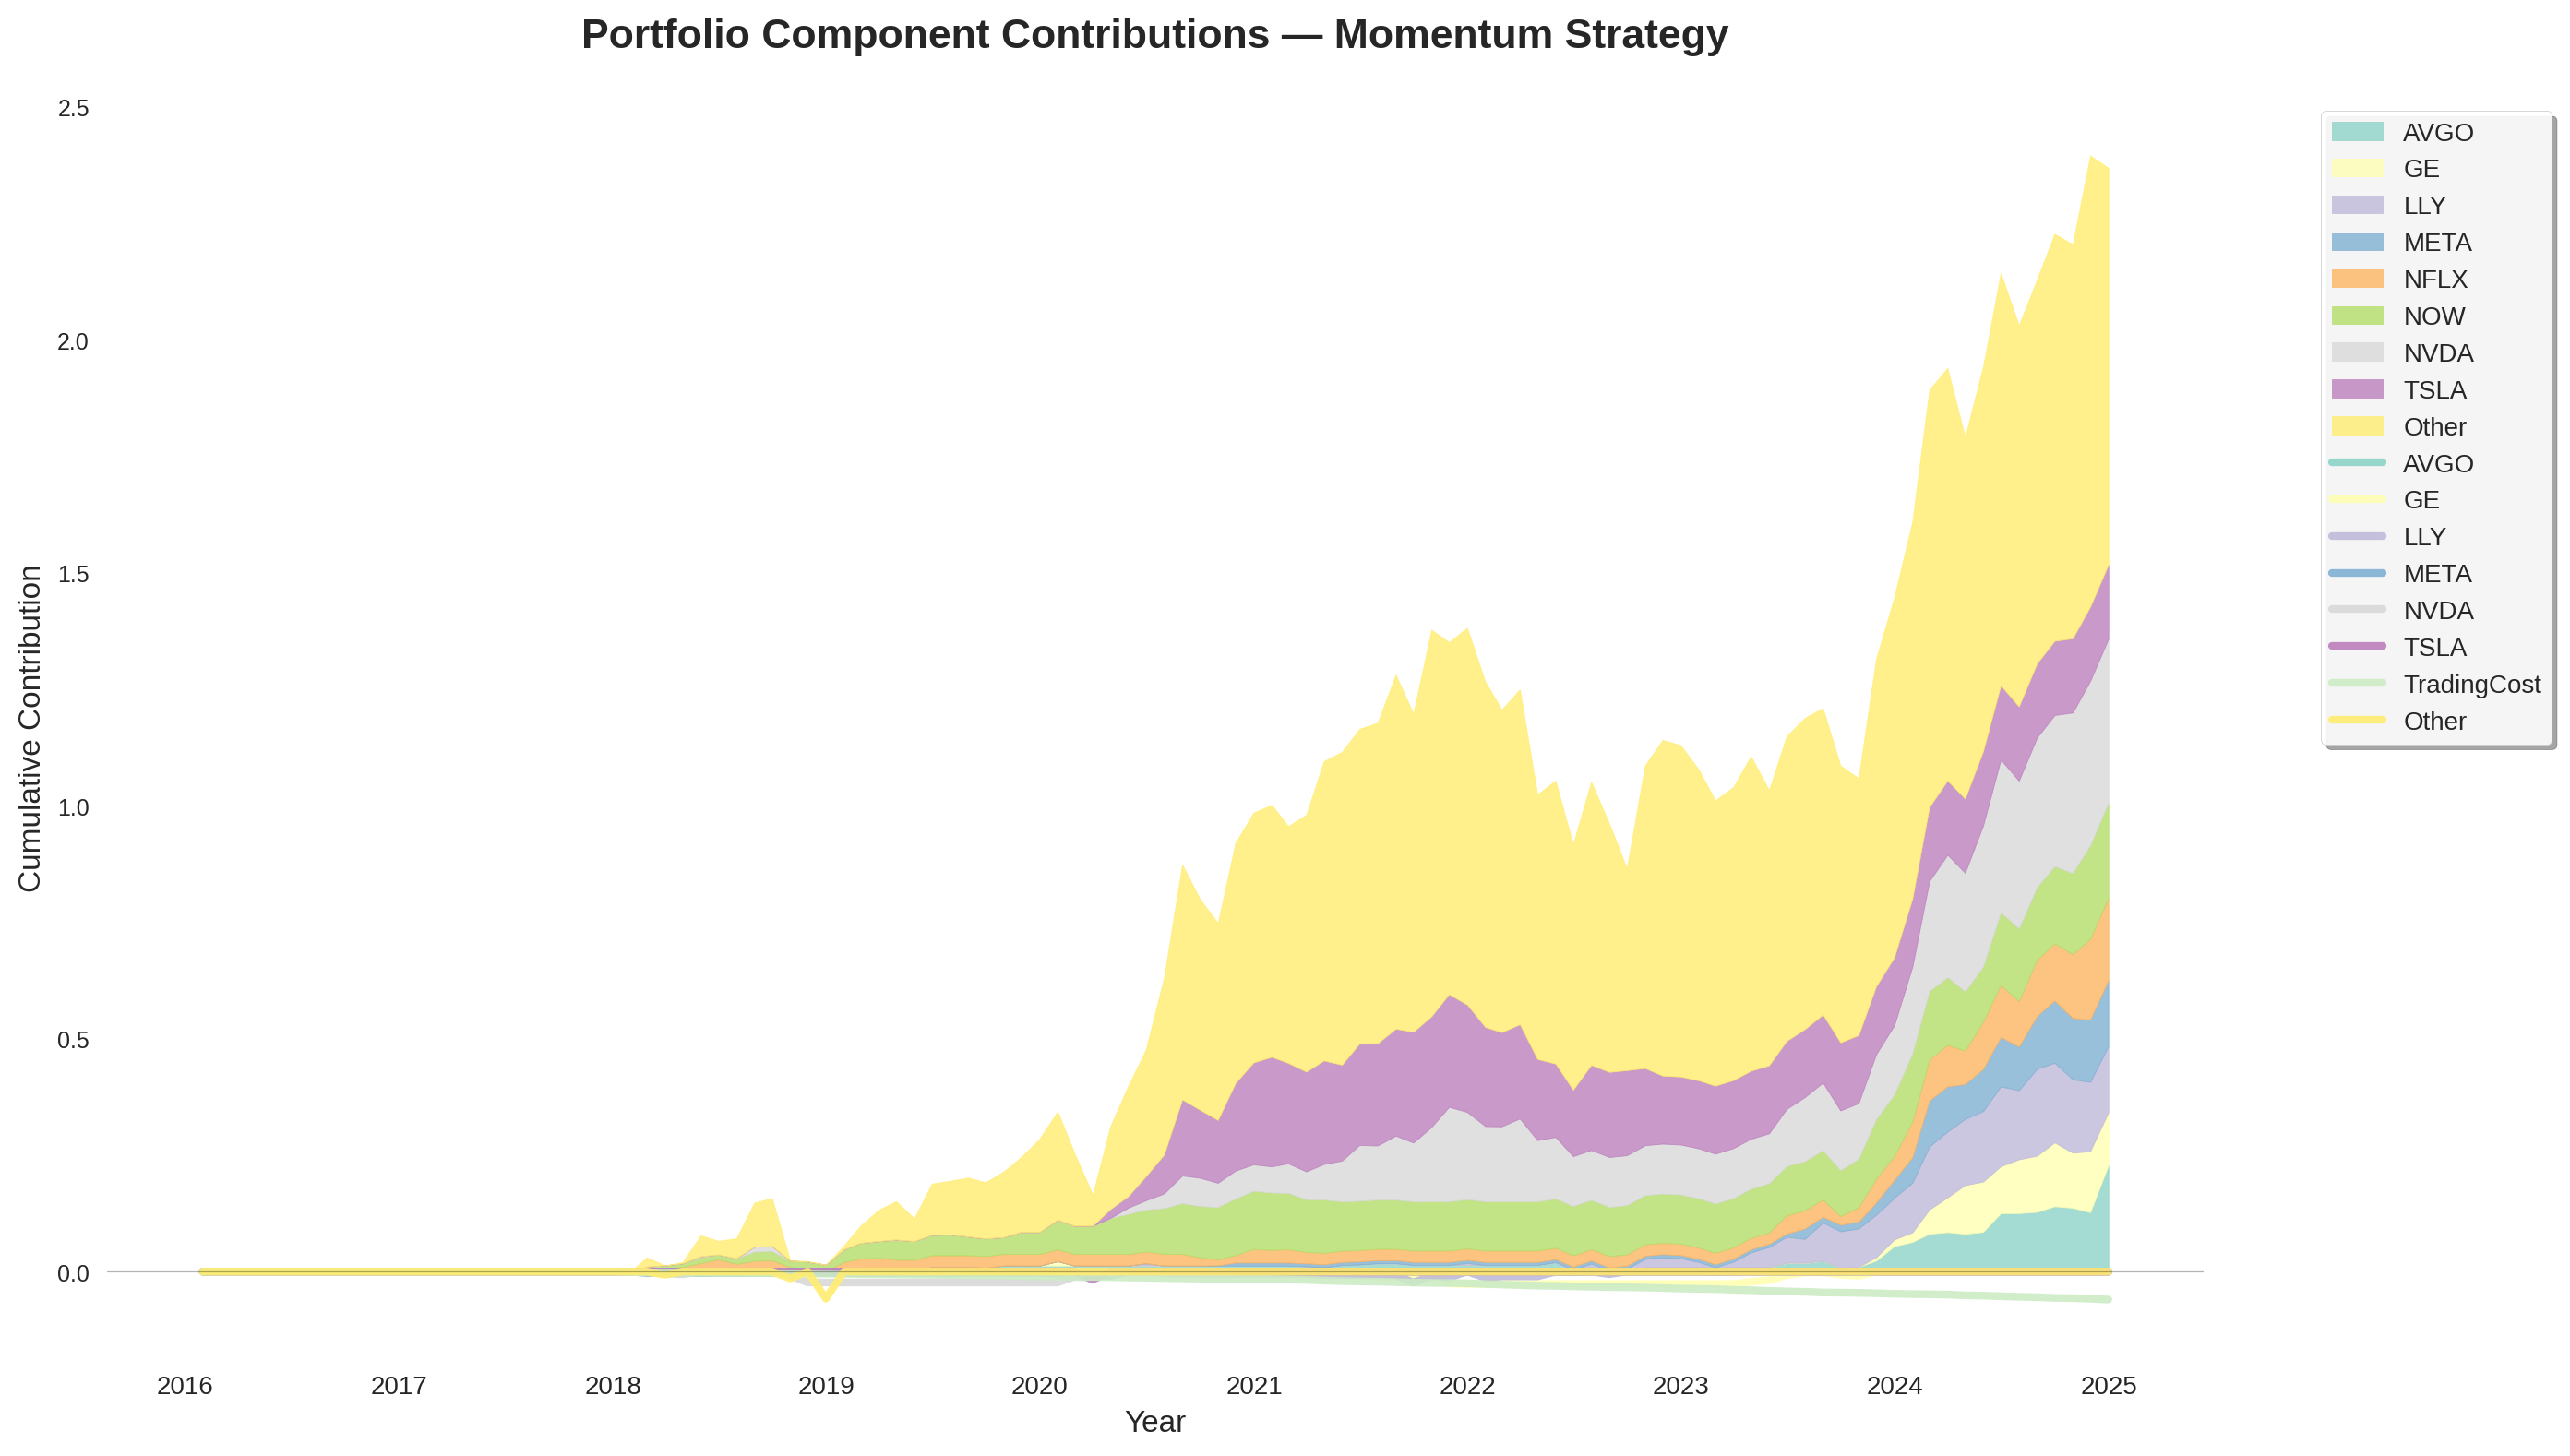
The big yellow “Other” area shows that returns weren’t dependent on a single name – many stocks helped. But some giants stand out:
- TSLA: Electric‑vehicle maker Tesla was occasionally in the momentum portfolio and, when it surged, it delivered outsized contributions.
- NVDA and LLY: Chip designer Nvidia and pharmaceutical firm Eli Lilly rode secular trends (AI chips and obesity drugs). When momentum picked them up, they rewarded the portfolio handsomely.
- Broadcom (AVGO) and General Electric (GE): Traditionally considered “old‑industry” names, these stocks reinvented themselves and momentum investors benefited.
Notice that the TradingCost slice is small but persistent. Rapid rotation into winners comes at the price of higher turnover, but in our test the benefits outweighed the costs.
Contrarian contributors
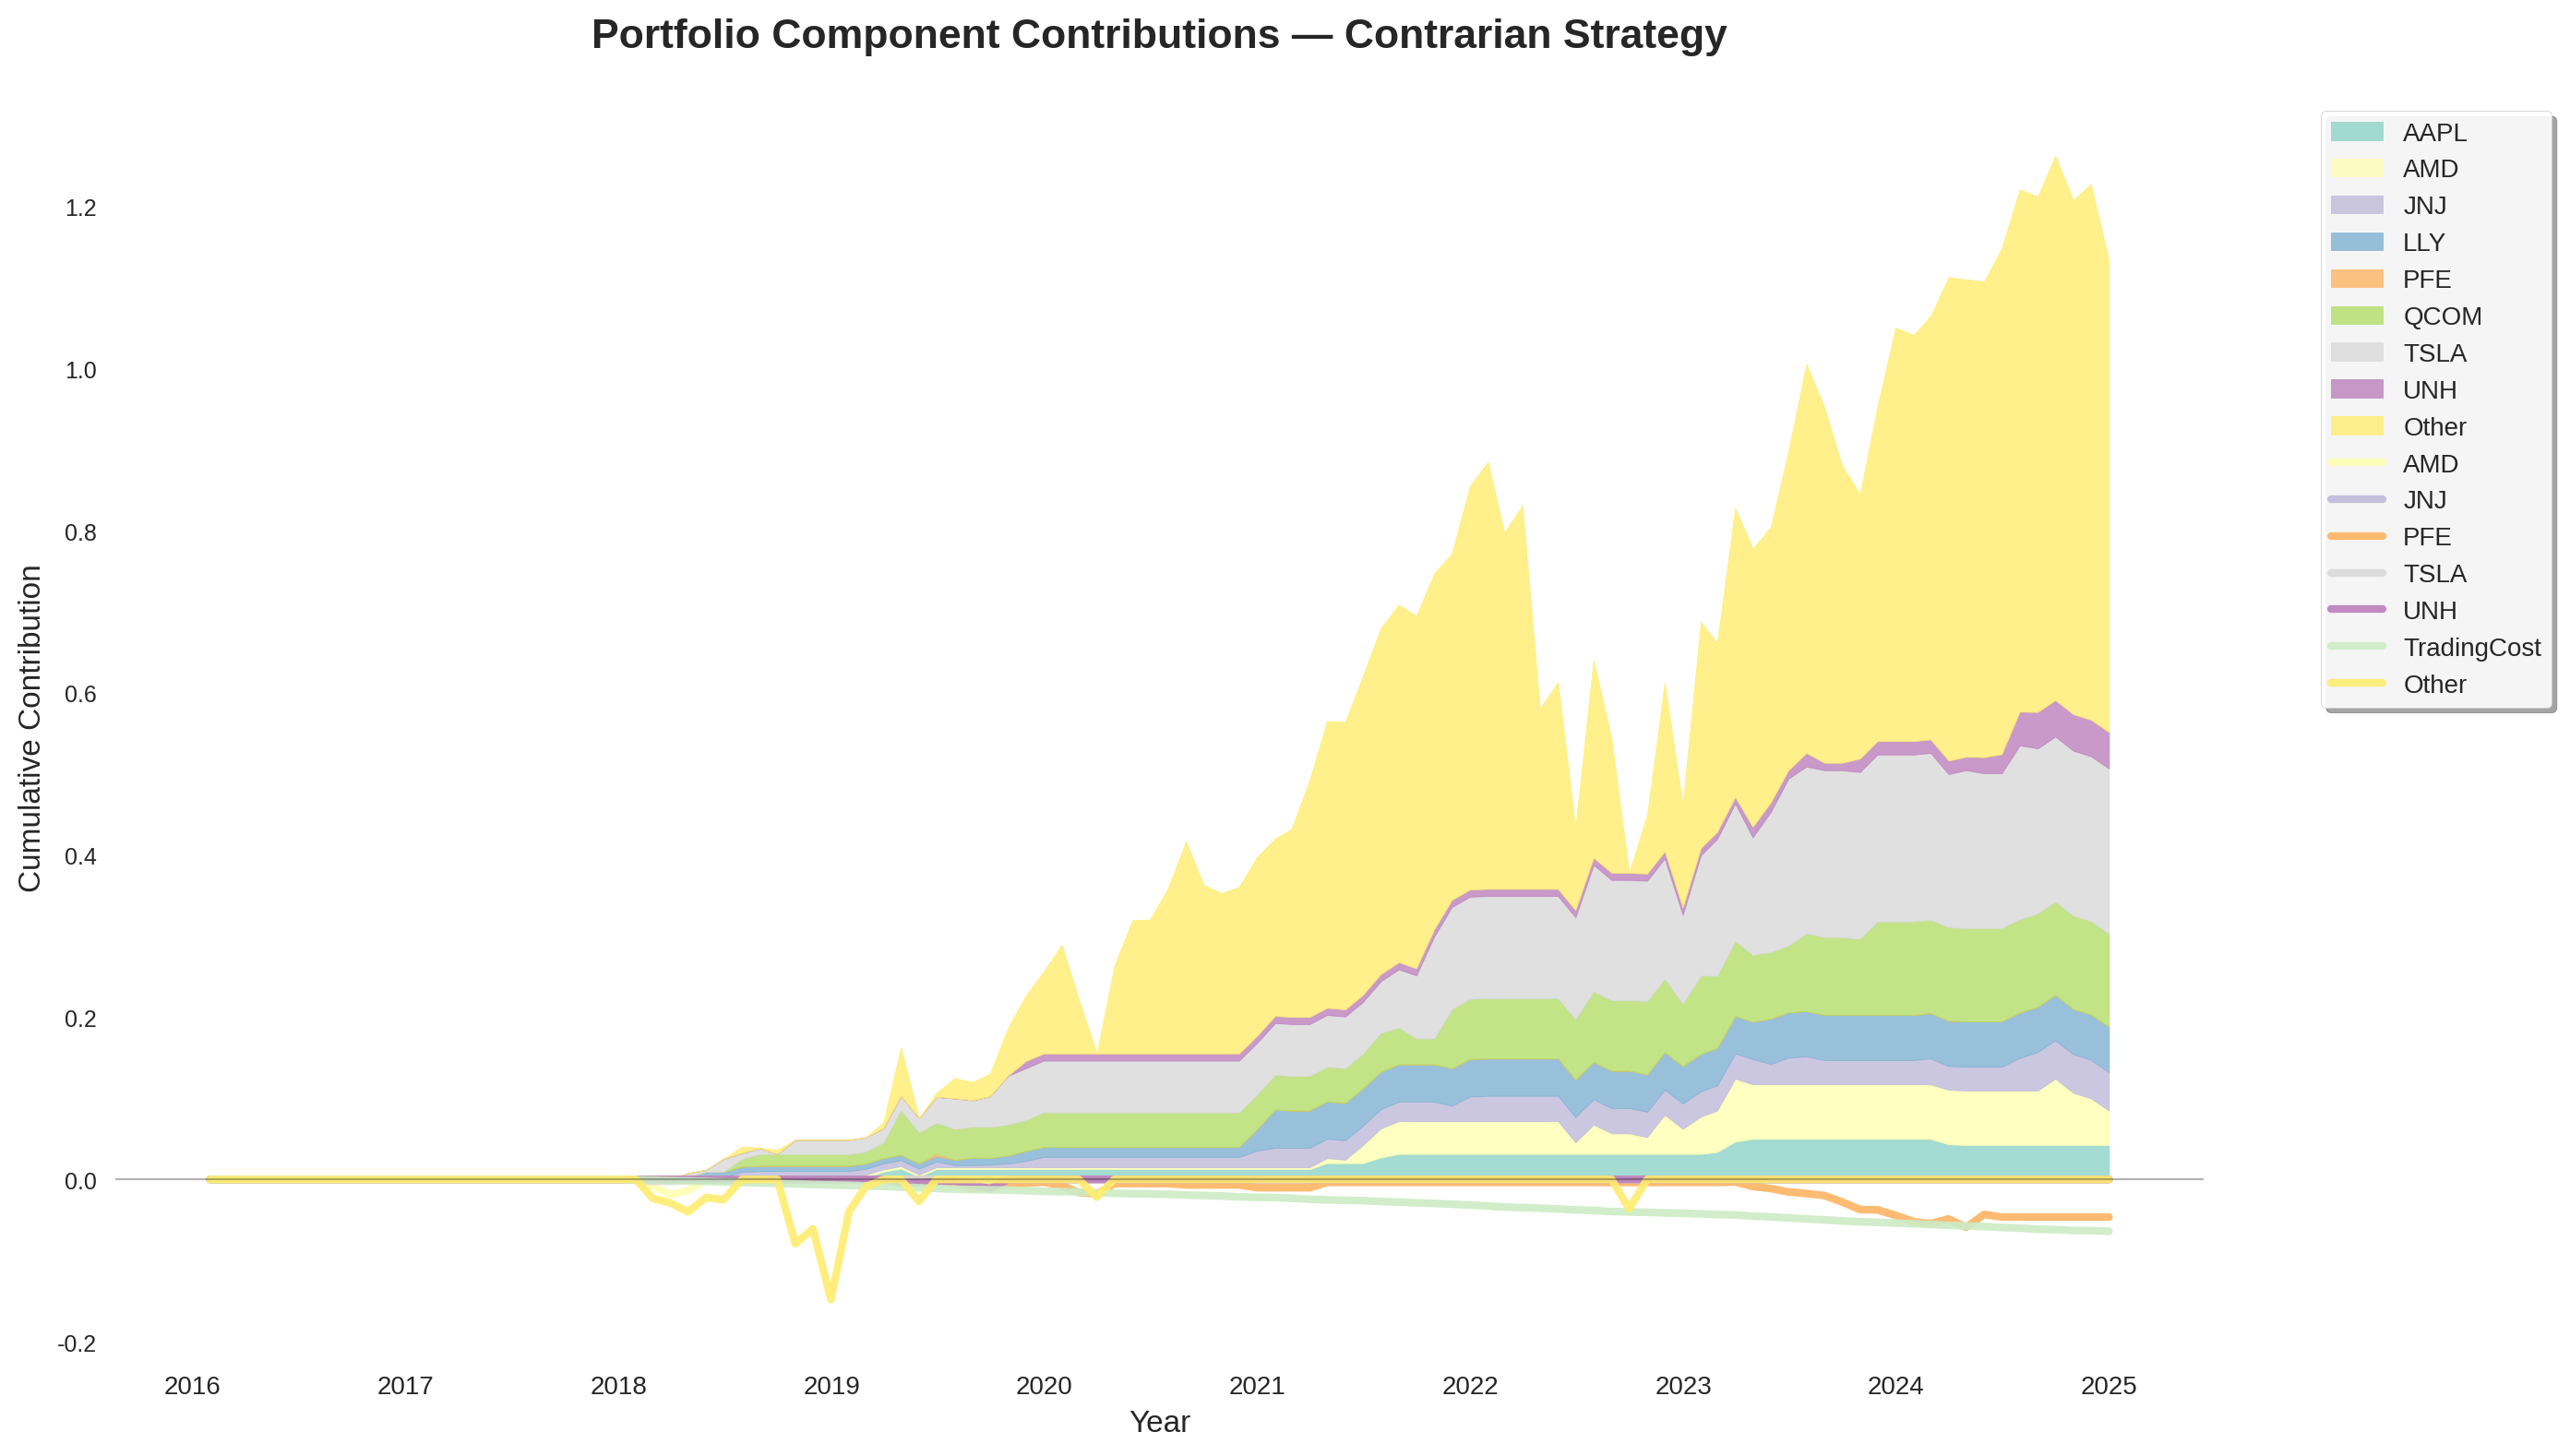
The contrarian strategy’s contributors look different:
- TSLA again: Interestingly, Tesla also contributed to the contrarian portfolio. Why? The stock often experienced short‑term pullbacks in an overall upward trend. After a multi‑month slump, it would qualify as “beaten down,” enter the portfolio, then rebound.
- AMD and UNH: Chipmaker Advanced Micro Devices and health‑insurer UnitedHealth are examples of quality companies that had temporary slumps. Buying them when sentiment was sour contributed positively.
- Pharma drag: Stocks like Pfizer (PFE) and Johnson & Johnson (JNJ) delivered negative contributions. These companies had multiple periods of underperformance during 2019–2023 and, unlike TSLA, they didn’t bounce back strongly.
- Trading costs matter more: Because the contrarian strategy often churned into quickly falling stocks, the TradingCost area is proportionally larger.
The charts underline a key lesson: contrarian investing works best when the “losers” have good reasons to recover (a temporary setback or a cyclical downturn). When a stock is in secular decline, betting on a rebound is like catching a falling knife.
What we learned
After nine years of data, several themes emerged:
- Trends dominate markets more often than not. In an era of winner‑take‑all technology and biotech breakthroughs, stocks that are already doing well often keep going. Momentum systematically captured those runs.
- Mean reversion is unpredictable. Not every loser will bounce. Some contrarian bets worked beautifully (e.g. AMD), but others (PFE, JNJ) kept falling or stayed flat, dragging down the portfolio.
- Risk control matters. Both strategies reduced exposure to stocks with negative long‑term trends by placing capital into a cash proxy when the signals were weak. This simple rule smoothed the ride.
- Behavioural challenges are real. Following momentum requires buying stocks that feel expensive, while contrarian investing demands patience when your picks keep going down. An investor’s temperament may be the ultimate determinant of which strategy works for them.
Should you pick one?
The short answer is no. The long answer is more nuanced:
- If you enjoy riding trends and are comfortable with shorter‑term reversals, a momentum‑tilted portfolio can provide higher returns – as long as you stick with it during rocky periods.
- If you have the stomach to buy unloved companies and wait, contrarian investing may suit you, but be prepared for deeper drawdowns and the risk that some businesses never recover.
- Many professional investors combine elements of both. For example, you might allocate a portion of your portfolio to momentum while using a contrarian filter within specific sectors or during bear markets. Diversifying across strategies can smooth the overall journey.
Finally, remember that past performance isn’t a guarantee of future results. Our experiment was a simplified exercise on historical data. Real‑world investing involves taxes, changing economic conditions and evolving market structures. Still, the lesson endures: whether you run with the pack or root for underdogs, understanding your strategy’s strengths and weaknesses will help you stay the course.
Comments (0)
No comments yet. Be the first to comment!