How to Find Great Companies Through Income Statements: Real Investment Analysis with Netflix Case Study
Value Investing Starts with Income Statement Analysis - The True Face of a $39B Revenue Company
What's the first financial statement you should look at when choosing a company to invest in? It's the Income Statement.
Many investors make investment decisions based solely on stock price charts or news headlines. But truly successful investors are different. Legendary investors like Warren Buffett and Peter Lynch commonly emphasize one thing: "You need to know how to read the numbers."
An income statement is a company's health report. How much money the company actually makes, where it spends it, and how much is left in the end — all of this is contained in a single document.
Netflix, which generated approximately $39 billion in revenue in 2024, is one of the most successful entertainment companies in history. Let's understand income statements together by examining Netflix's income statement.
Let's dive in step by step.
The Big Picture: Following the Money
Think of Netflix's income statement as a waterfall. Money flows in at the top (revenue), and as it cascades down, various expenses take their cut. What's left at the bottom is profit — the money Netflix gets to keep.
The diagram below shows the complete journey at a glance:
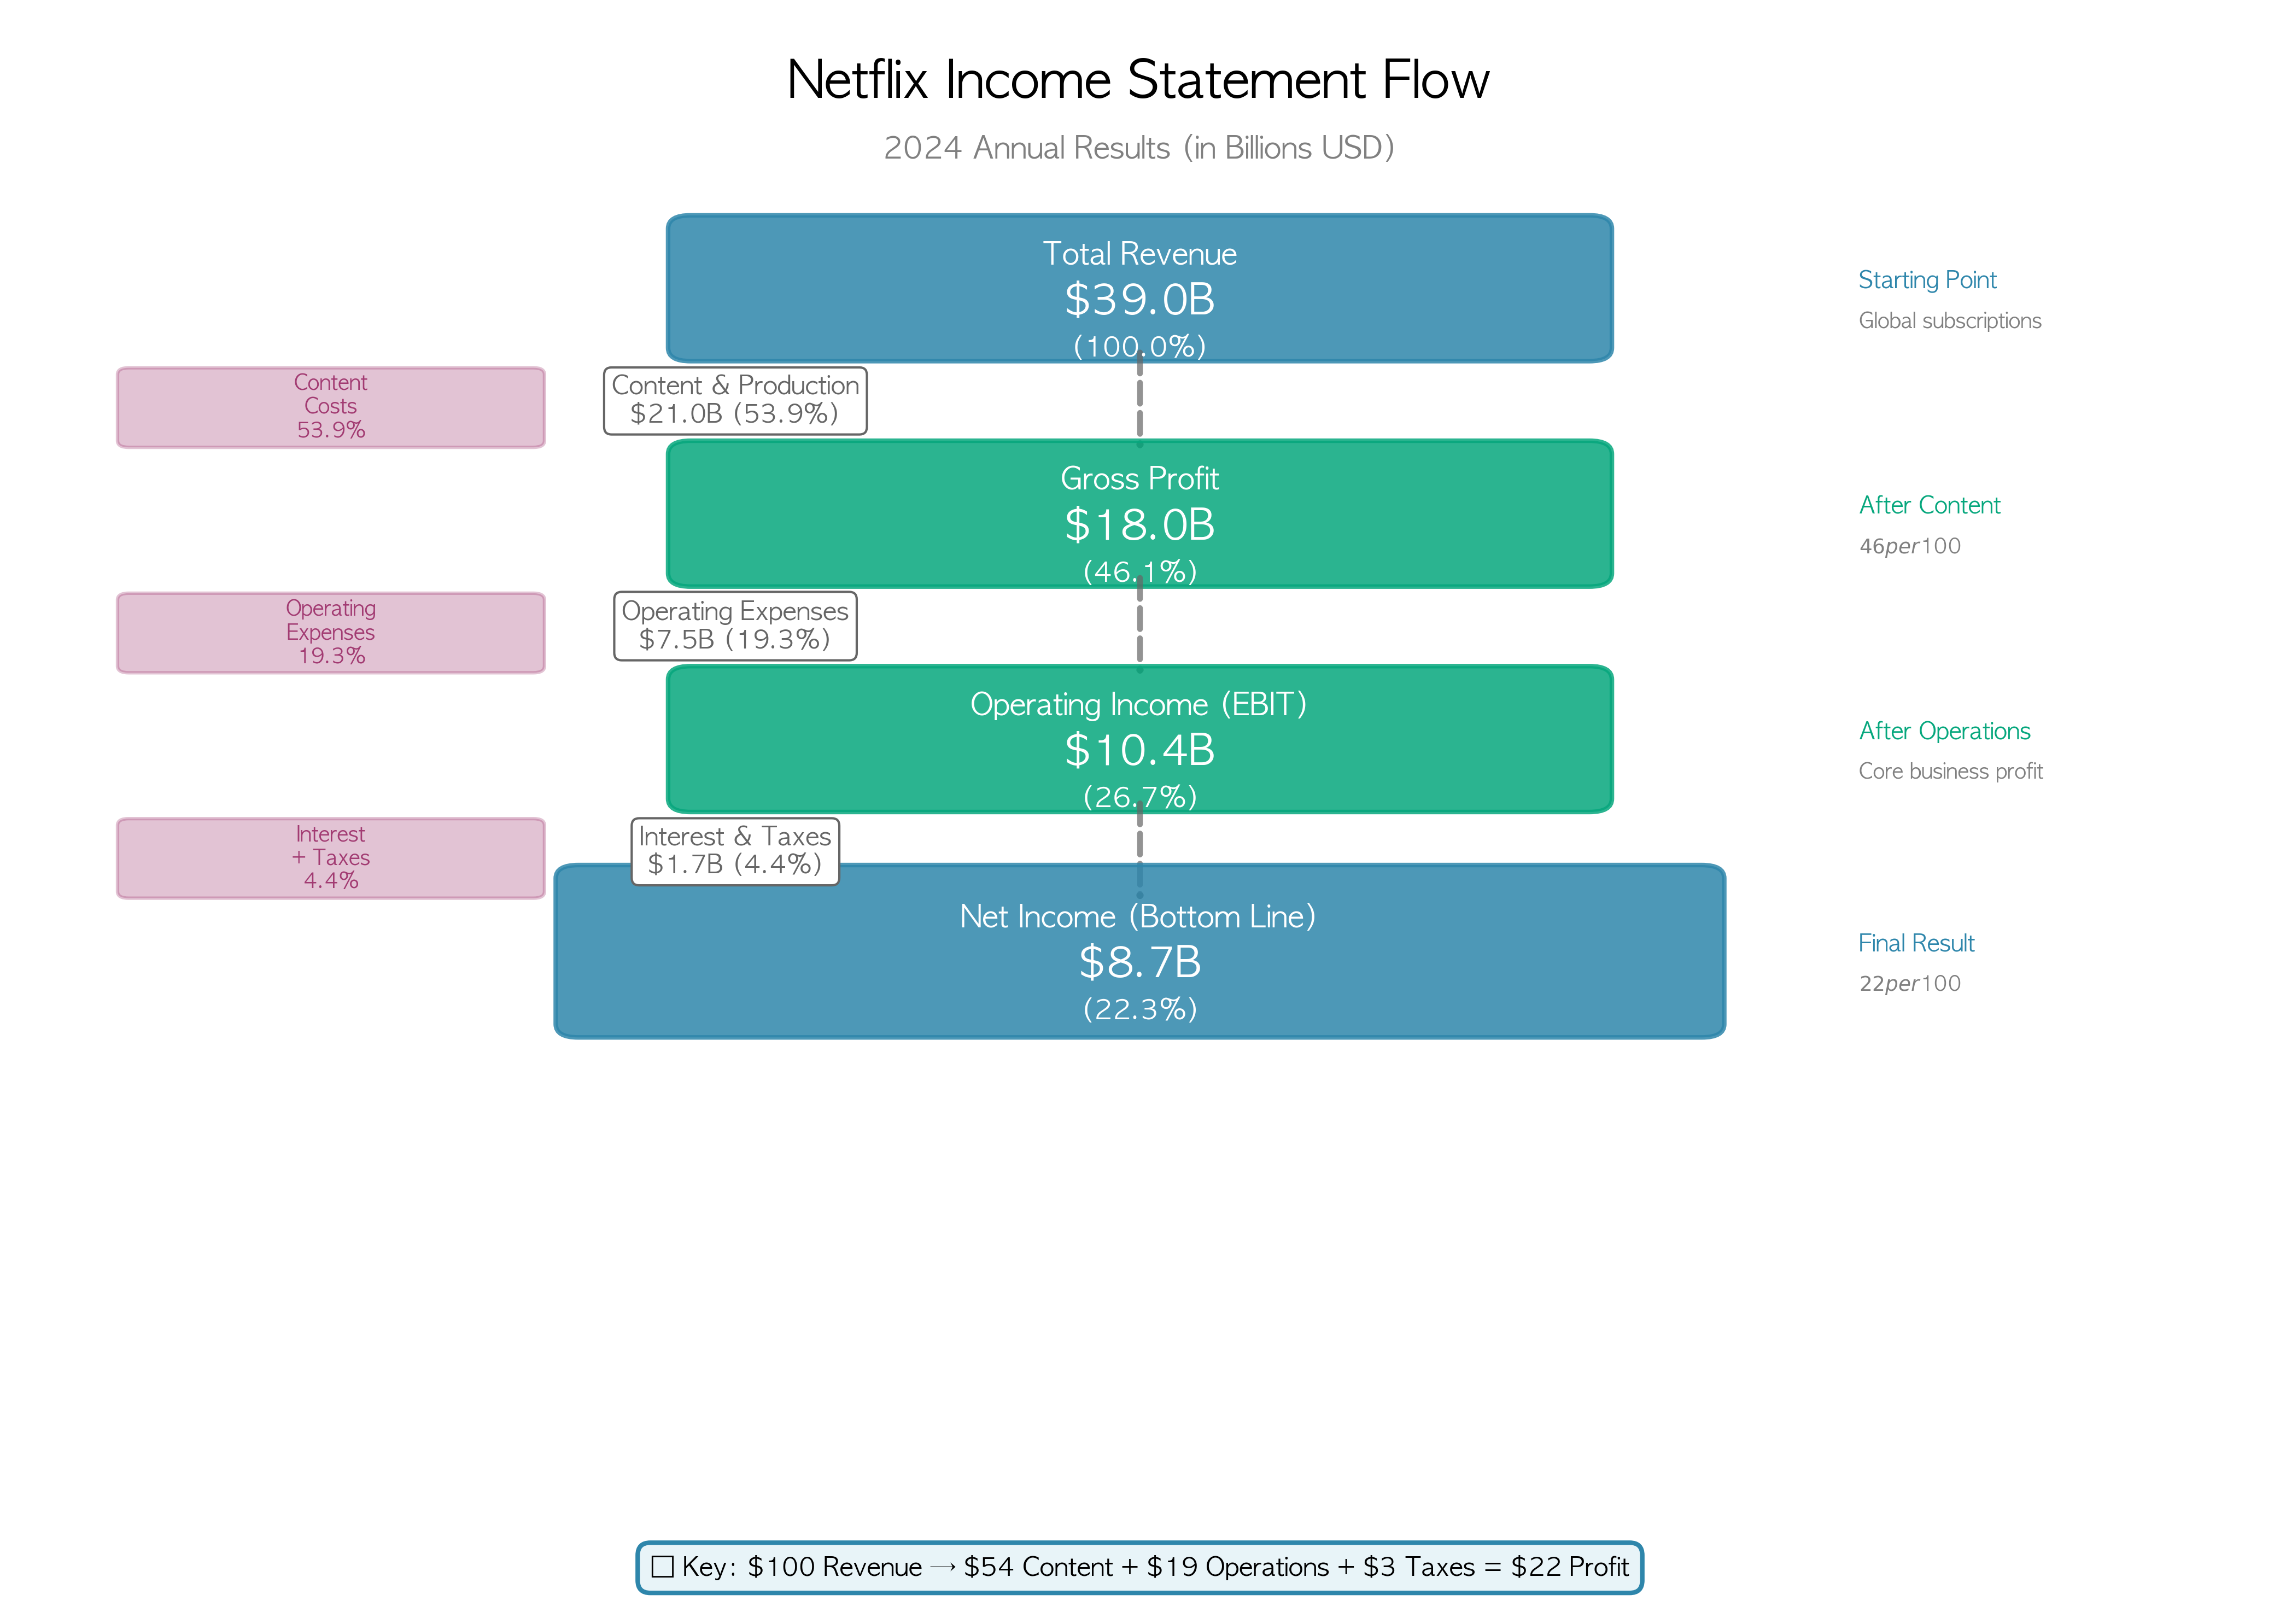
As the visualization shows, Netflix's money flows through these stages:
Starting with $39.0 billion → spending $21.0B on content → spending $7.5B on operations → paying $1.7B in interest and taxes → ending with $8.7 billion in net income.
In percentage terms:
- 46.1% Gross Margin: What's left after content costs
- 26.7% Operating Margin: Core business profitability
- 22.3% Net Margin: The final amount Netflix keeps
Now let's explore each step in detail and understand what it means.
Step 1: Revenue - The Starting Point
$39.0 Billion in Total Revenue
This is where it all begins. In 2024, Netflix brought in $39 billion from subscribers around the world. That's nearly $107 million per day!
Where does this come from? Almost entirely from monthly subscription fees. Whether you're paying $15.49 for the Standard plan or $22.99 for Premium, you and millions of other subscribers are collectively funding this massive content machine.
Key Insight: Netflix's revenue has grown at an impressive 9.5% annually over the past three years, showing consistent growth despite intense competition from Disney+, Amazon Prime, and others.
Step 2: Content Costs - The Biggest Expense
$21.0 Billion in Cost of Revenue (53.9%)
Here's where things get interesting. For every $100 Netflix earns, they spend roughly $54 on content. This includes:
- Original content production: Shows like "Stranger Things," "The Crown," and "Wednesday"
- Licensed content: Movies and shows they buy from other studios
- Content amortization: Spreading out the cost of content over its useful life
Think of it this way: if you pay Netflix $15/month, about $8 goes directly to paying for the shows and movies you watch. That's a huge investment, but it's also what makes Netflix, well, Netflix.
Why This Matters: Content is Netflix's competitive moat. The more they invest in quality shows, the more subscribers they attract and retain. It's a delicate balance — spend too little and subscribers leave; spend too much and profits suffer.
Step 3: Gross Profit - What's Left After Content
$18.0 Billion in Gross Profit (46.1% margin)
After paying for content, Netflix keeps $18 billion, or about 46 cents of every dollar. This is called the gross profit margin, and it's one of the most important metrics to watch.
A 46% gross margin is actually quite healthy in the streaming industry. It means Netflix has enough cushion to cover all their other expenses and still make a profit.
The Trend: Netflix's gross margin has been improving over time (from 41.6% in 2021 to 46.1% in 2024), showing they're getting better at managing content costs relative to revenue.
Step 4: Operating Expenses - Running the Business
$7.5 Billion in Operating Expenses (19.3%)
Now we subtract the costs of actually running Netflix as a business. These break down into three categories:
Research & Development: $2.9 Billion (7.5%)
This pays for:
- Engineers building the streaming platform
- Content creation technology
- The algorithm that recommends shows
- Improving video quality and user experience
About $7.50 of every $100 you pay goes toward making Netflix work smoothly.
Selling & Marketing: $2.9 Billion (7.5%)
This covers:
- Advertising campaigns
- Public relations
- Market research
- Promotional activities
Another $7.50 per $100 is spent attracting new subscribers and keeping existing ones engaged.
General & Administrative: $1.7 Billion (4.4%)
The overhead costs:
- Executive salaries
- Legal and finance teams
- Office space
- Corporate functions
This takes $4.36 per $100 of revenue.
Total Operating Expenses: About $19.35 of every $100 goes to running the business.
Step 5: Operating Income - The Core Business Profit
$10.4 Billion in Operating Income (26.7% margin)
This is a crucial number. Operating income shows how profitable Netflix's core business is before accounting for interest and taxes. At 26.7%, this is an excellent operating margin.
What It Means: For every $100 in subscription revenue, Netflix's streaming business generates $26.70 in operating profit. That's impressive for any business, let alone one investing so heavily in growth and content.
The Growth Story: Operating margin has expanded from 20.9% in 2021 to 26.7% in 2024. This shows Netflix is achieving economies of scale — as they grow larger, they become more efficient.
Step 6: Interest Expenses
$452 Million in Net Interest Expense (1.2%)
Like many companies, Netflix has borrowed money to fund growth. In 2024, they paid $719 million in interest on their debt, but also earned $267 million in interest income from cash investments.
The net cost? About $1.16 per $100 of revenue — a relatively small expense that shows Netflix's debt is manageable.
Step 7: Taxes
$1.3 Billion in Income Tax (12.6% effective rate)
After deducting interest, Netflix had $10.0 billion in pre-tax income. They paid $1.3 billion in taxes, an effective tax rate of just 12.6%.
This is lower than the U.S. corporate tax rate (21%) because Netflix operates globally and benefits from various tax strategies and credits.
Per $100: About $3.22 goes to taxes.
The Bottom Line: Net Income
$8.7 Billion in Net Income (22.3% margin)
After all expenses, interest, and taxes, Netflix kept $8.7 billion in profit. That's their net income — the true bottom line.
What does this mean?
- For every $100 in revenue, Netflix keeps $22.34 as profit
- That's a 22.3% net profit margin — exceptional by any standard
- Net income has grown at 19.4% annually over the past three years
The Per-Share Story: Earnings Per Share (EPS)
$19.83 Diluted EPS
Netflix has 439 million shares outstanding. When you divide the $8.7 billion profit by all those shares, each share earned $19.83 in 2024.
This matters to investors because:
- EPS has grown at 20.8% annually over three years
- It's growing faster than revenue (9.5% annually)
- This shows improving profitability and operational efficiency
If you owned one share of Netflix stock, the company earned almost $20 on your behalf in 2024.
The $100 Visual: Where Your Money Goes
Let's make this really simple. Every time you pay Netflix $100, here's exactly where it goes:
| Category | Amount | What It Pays For |
|---|---|---|
| Content Costs | $53.94 | Shows, movies, and content production |
| Technology (R&D) | $7.50 | Platform development, streaming tech |
| Marketing | $7.48 | Advertising and subscriber acquisition |
| Administration | $4.36 | Corporate overhead and management |
| Interest | $1.16 | Debt servicing |
| Taxes | $3.22 | Government taxes |
| 💰 Profit | $22.34 | What Netflix keeps |
What Makes This Income Statement Impressive?
1. Exceptional Profitability
A 22.3% net margin is outstanding. For comparison:
- Traditional media companies often operate at 10-15% margins
- Many tech companies target 20%+ margins
- Netflix is achieving this while investing heavily in content
2. Improving Efficiency
The margins tell a growth story:
- 2021: 17.2% net margin
- 2024: 22.3% net margin
This 5-point improvement shows Netflix is getting better at converting revenue into profit.
3. Earnings Growing Faster Than Revenue
- Revenue CAGR: 9.5%
- Net Income CAGR: 19.4%
- EPS CAGR: 20.8%
This is the holy grail of business performance — operational leverage. As Netflix scales, more of each additional dollar flows to the bottom line.
4. Disciplined Cost Management
Despite spending 54% on content, Netflix still maintains industry-leading margins. They've found the sweet spot between investing in content (to attract subscribers) and maintaining profitability.
The Big Trends to Watch
Content Spending is Stabilizing
At 53.9% of revenue, content costs remain high but have stabilized. This suggests Netflix is reaching maturity in content spending relative to revenue.
Operating Leverage is Kicking In
As Netflix grows, fixed costs (like technology and corporate overhead) are spread across more subscribers. This is why margins are expanding.
Tax Efficiency
The 12.6% effective tax rate gives Netflix more cash to reinvest in content or return to shareholders through buybacks.
The Time Dimension: How Netflix Evolved from 2021 to 2024
So far, we've examined a snapshot of 2024. But the real story emerges when we look at how things changed over time. Let's see how Netflix transformed from 2021 to 2024.
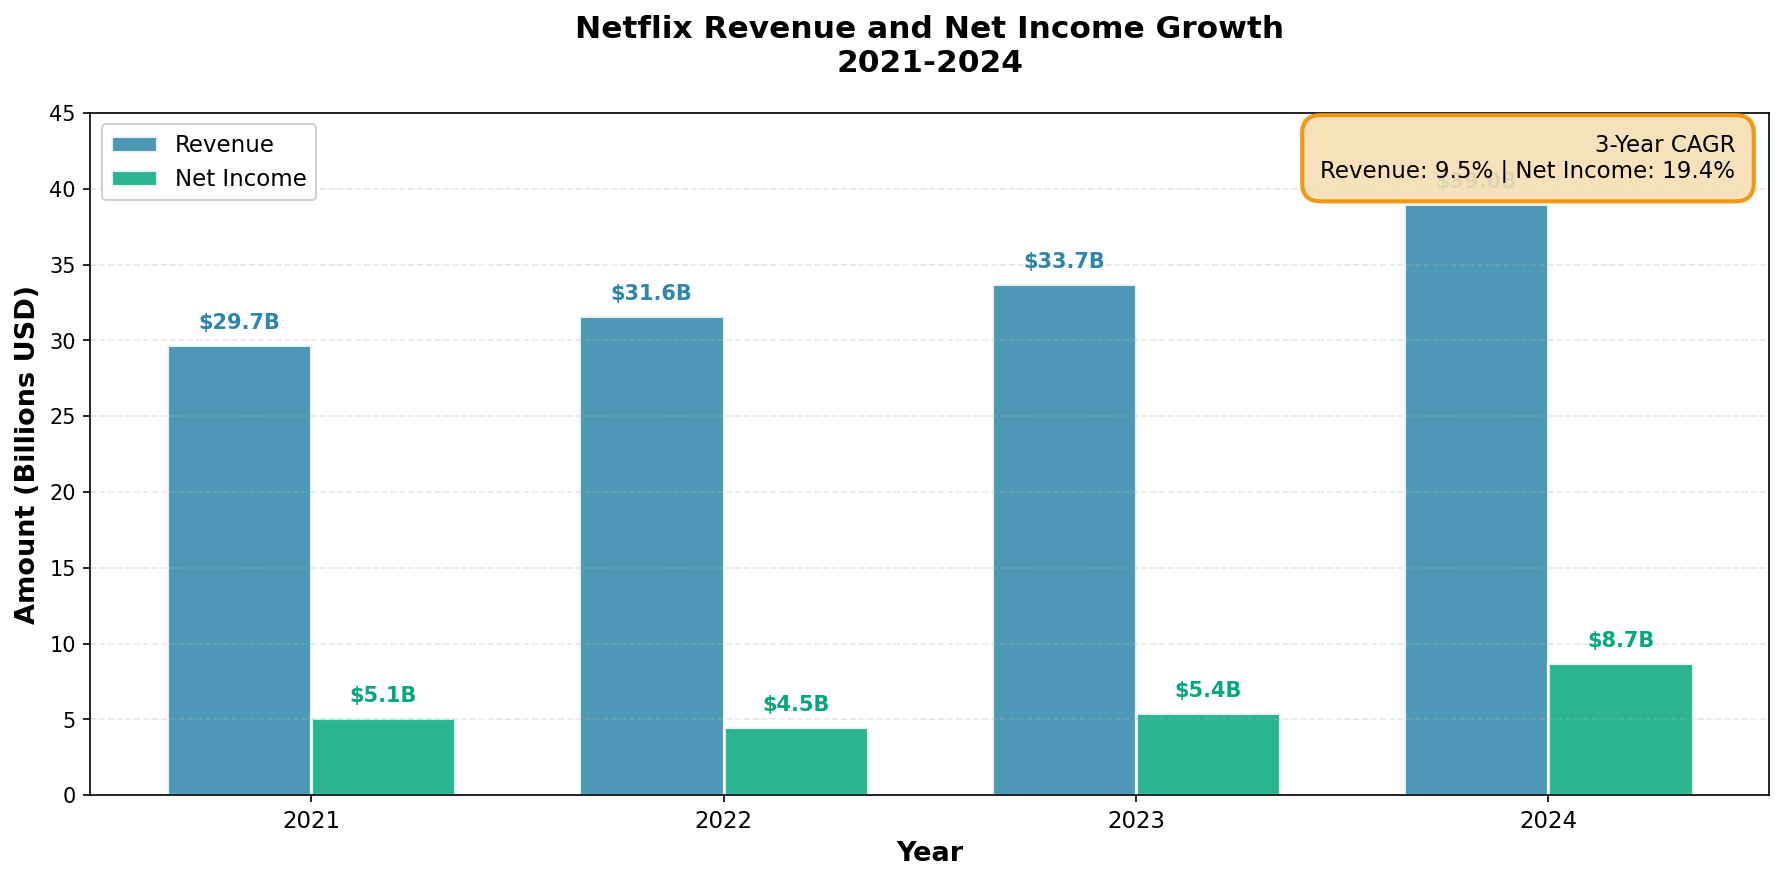
The Remarkable Profitability Improvement
Looking at the chart above, one thing becomes crystal clear: Netflix is getting more and more profitable.
2021 vs 2024 Comparison:
| Metric | 2021 | 2024 | Change |
|---|---|---|---|
| Revenue | $29.7B | $39.0B | +31.3% |
| Net Income | $5.1B | $8.7B | +70.3% |
| Net Margin | 17.2% | 22.3% | +5.1pp |
| Operating Margin | 20.9% | 26.7% | +5.9pp |
| Gross Margin | 41.6% | 46.1% | +4.4pp |
Key observation: Net income grew more than 2x faster than revenue (70% vs 31%). This is economies of scale in action.
What Margin Expansion Means
What does a 5.1 percentage point improvement in net margin mean?
2021: Earn $100 → Keep $17.20 as profit 2024: Earn $100 → Keep $22.34 as profit
Difference: The same $100 now generates $5.14 more in profit!
At a $39 billion revenue scale, this 5 percentage point improvement translates to approximately $2 billion in additional profit.
Dramatic Cost Efficiency Gains
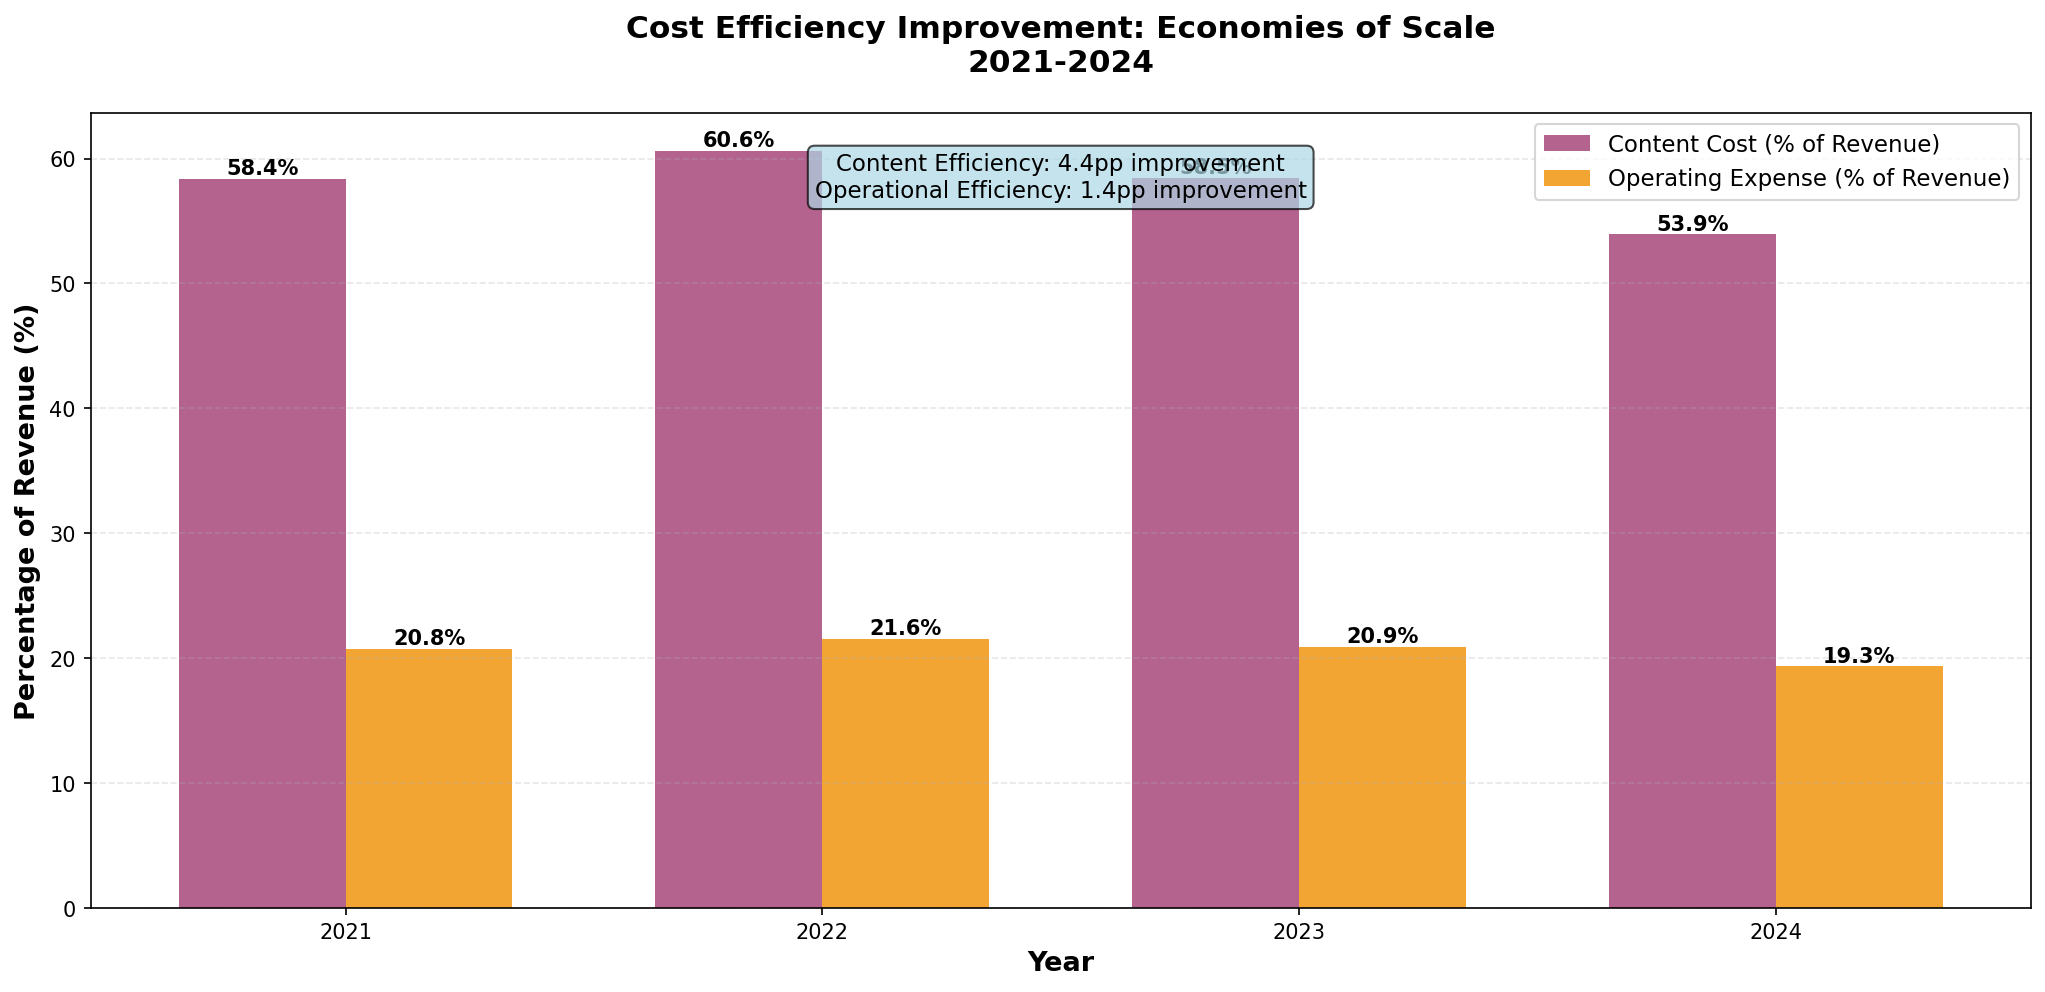
The chart above shows how Netflix became more efficient:
Content Costs (% of Revenue):
- 2021: 58.4%
- 2022: 60.6% (peak)
- 2023: 58.5%
- 2024: 53.9%
Operating Expenses (% of Revenue):
- 2021: 20.8%
- 2024: 19.3%
What Happened?
1. Economies of Scale Achieved
As subscriber count increased, fixed costs (technology infrastructure, corporate overhead) spread across more people. 260 million subscribers is massive scale.
2. Content Investment Optimization
Netflix learned what content works. Instead of spending indiscriminately, they're investing smartly:
- Data-driven content production decisions
- Focus on global hits ("Squid Game", "Wednesday")
- Shift from licensed to original content (better ROI)
3. Operational Efficiency Gains
As technology and processes matured:
- Streaming infrastructure became more efficient
- Customer service became more automated
- Marketing spend became more targeted
The Growth Curve: Why Profits Growing Faster Than Revenue?
This is the magic of operating leverage:
2021 → 2024:
Revenue: +31% growth
Net Income: +70% growth
For every additional dollar of revenue, a higher percentage becomes profit. Why?
- Don't need to hire new tech teams for new subscribers
- Don't need to open new offices for new subscribers
- Content is already created; additional viewers cost almost nothing
Compound Annual Growth Rates (CAGR)
3-year compound growth rates:
- Revenue CAGR: 9.5% — Solid growth
- Net Income CAGR: 19.4% — 2x revenue!
- EPS CAGR: 20.8% — Investors love this
The 2022 Dip: What Happened?
Looking at the charts, you'll notice margins dipped in 2022:
- Net Margin: 17.2% (2021) → 14.2% (2022) → 16.0% (2023) → 22.3% (2024)
Reasons:
- Post-COVID subscriber growth slowdown
- Heavy content investment (60.6% of revenue)
- Intensified competition (Disney+, HBO Max, etc.)
But Netflix recovered and came back stronger. By 2024, they achieved their best margins ever.
Key Lesson: The Power of Scale
This 4-year journey shows:
-
Early Phase: Invest in Growth (2021-2022)
- Heavy spending on content
- Accept lower margins
-
Middle Phase: Improve Efficiency (2023)
- Start optimizing costs
- Margins recover
-
Current Phase: Harvest Profitability (2024)
- Leverage economies of scale
- Achieve industry-leading margins
This is the path every mature tech company should take: finding the balance between growth and profitability.
What This Means for Different Audiences
If You're a Subscriber
Your $15-20 monthly payment is funding a massive content engine. About half goes to content, ensuring you have fresh shows to watch. The rest keeps the service running smoothly and allows Netflix to invest in better technology.
If You're an Investor
Netflix is demonstrating the power of scale. With 22% net margins and 20%+ earnings growth, they're proving that streaming can be highly profitable at scale. The improving margins suggest there's more upside as they continue to grow.
If You're a Business Student
This income statement shows how subscription businesses work at scale. High fixed costs (content) become more profitable as you add subscribers. The key is reaching scale while maintaining quality.
Final Thoughts: The Bottom Line
Netflix's 2024 income statement tells the story of a company that has figured out the streaming business model. Here's the summary:
✅ $39 billion in revenue from 260+ million global subscribers ✅ $8.7 billion in profit with 22.3% margins ✅ Growing profits faster than revenue — the mark of operational excellence ✅ Balanced investment between content (54%) and profitability (22%)
The math is simple: for every $100 Netflix earns, they spend $54 on content, $20 on operations, $3 on taxes, and keep $22 as profit. That's a healthy, sustainable business model.
Whether you're a subscriber enjoying "Squid Game" or an investor watching the stock price, Netflix's income statement shows a company firing on all cylinders. They've cracked the code on profitable streaming — and the numbers prove it.
Note: All figures are based on Netflix's fiscal year 2024 annual report. Percentages are calculated as a proportion of total revenue.
Data Sources:
- Netflix Annual Financial Statements (2024)
- Analysis period: 2021-2024
- Generated: November 2025
Comments (0)
No comments yet. Be the first to comment!