[2025-12-01] Fed QT Ends & Bitcoin Plunges: 2025 Financial Market Turning Point
Data-Driven Analysis | Sources: FRED API, yfinance | Generated: December 01, 2025 at 08:13
Executive Summary
On December 1, 2025, the Federal Reserve officially ended its 3.5-year Quantitative Tightening (QT) program, marking a critical turning point for financial markets. Simultaneously, Bitcoin plunged 27.1% from its all-time high, revealing its true nature as "leveraged Nasdaq" rather than "digital gold." Meanwhile, Black Friday saw AI contribute $3 billion in sales, presenting a new inflection point for the retail industry.
Key Metrics:
- Fed Balance Sheet: $8.97 trillion (peak) → $6.55 trillion (current)
- QT Total Reduction: $2.41 trillion (26.9%)
- Bitcoin-Nasdaq Correlation: 0.688 (2025)
- Bitcoin Drawdown: 27.1% from peak
- Black Friday Online Sales: $11.8 billion (AI contribution: $3.0B, 25%)
1. Fed QT Ends: $2.41 Trillion Liquidity Withdrawal Concludes
Scale and Impact of QT
The Fed reduced its balance sheet from $8.92 trillion in June 2022 to $6.55 trillion as of November 26, 2025 through quantitative tightening. This represents $2.41 trillion (26.9%) in liquidity withdrawn from financial markets—one of the most aggressive liquidity tightening policies in history.
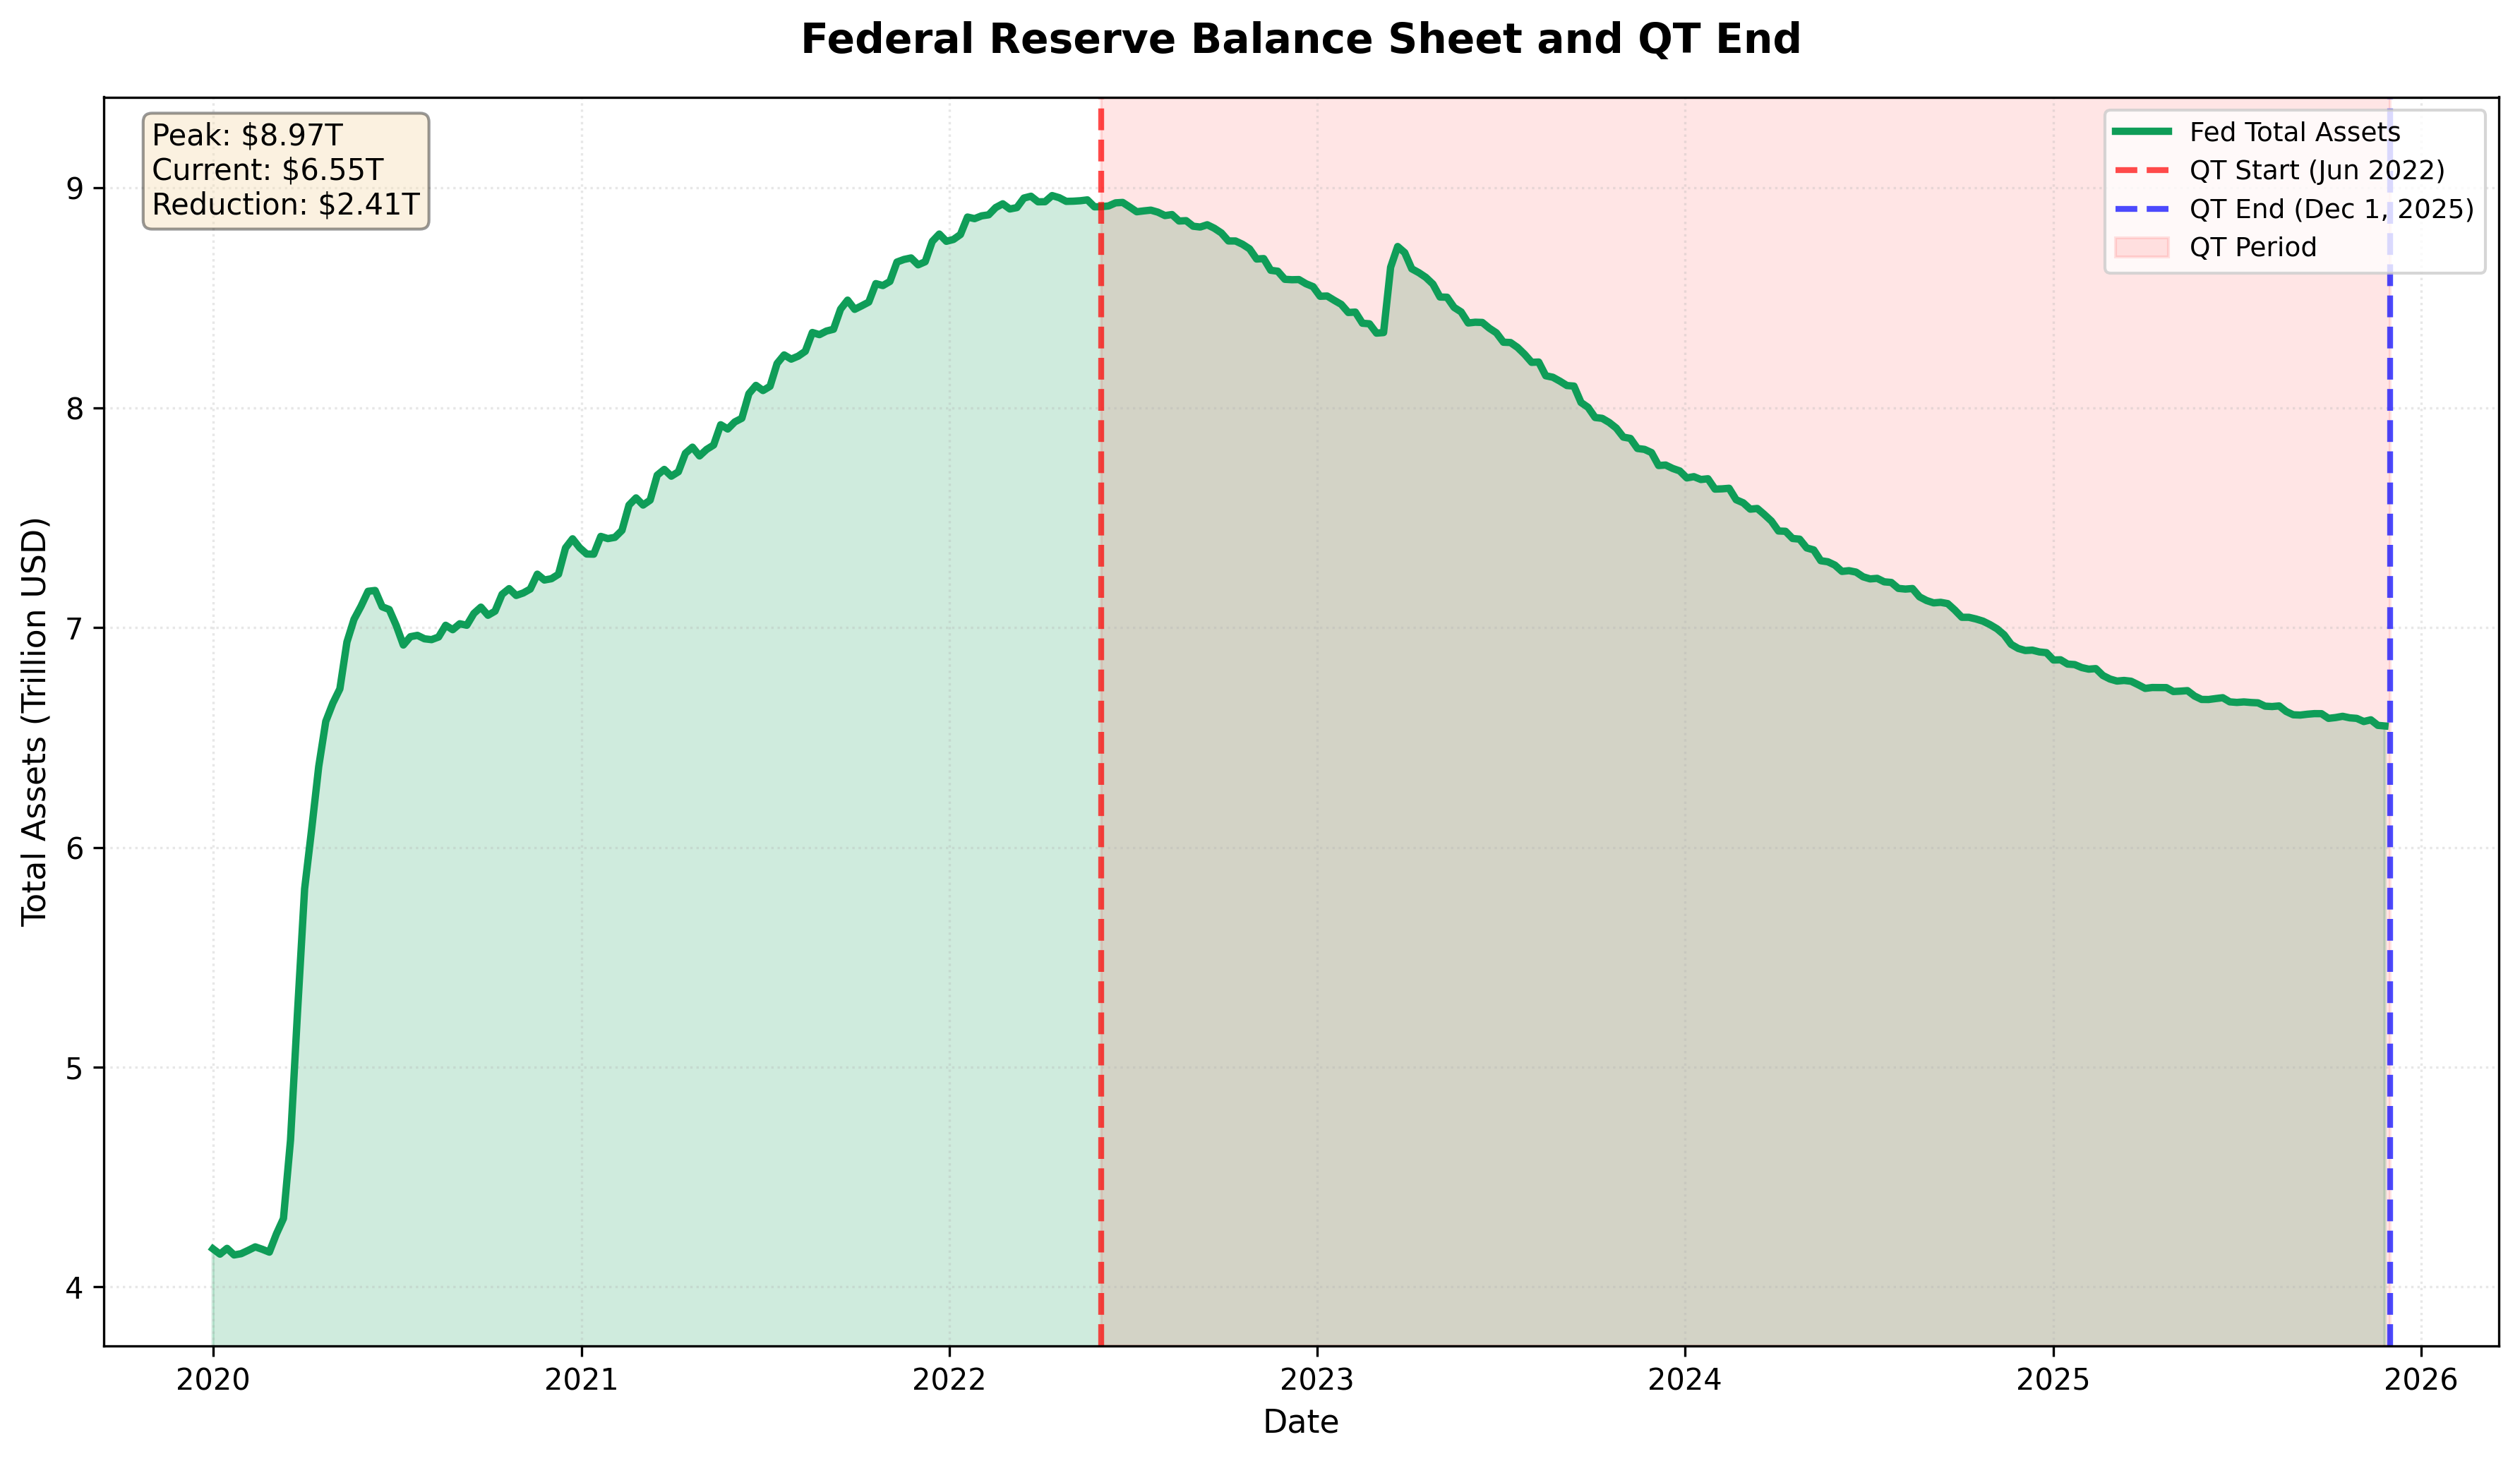
[Chart 1] shows the Fed's balance sheet evolution from 2020 to present. Asset holdings surged from approximately $4 trillion in March 2020 (pandemic response) to a peak of $8.97 trillion in April 2022, then steadily declined during the QT period (red shaded area) to the current level of $6.55 trillion.
Background of QT Termination
Fed Chair Jerome Powell stated in a recent press conference that "current economic conditions justify halting balance sheet reduction." The spike in short-term funding market rates (SOFR) to 4.25% in October 2025—exceeding the Fed's target range—was cited as a primary reason for early termination.
Learning from the 2019 repo market crisis, the Fed chose to preemptively end QT before market stress materialized, rather than waiting for a full-blown crisis.
Market Impact
While QT termination doesn't represent direct liquidity injection, it means the cessation of approximately $95 billion in monthly liquidity withdrawal. This creates a favorable environment for risk assets, particularly cryptocurrencies and growth stocks.
2. Bitcoin's Plunge: From "Digital Gold" to "Leveraged Nasdaq"
Strong Correlation
Throughout 2025, Bitcoin showed a 0.688 correlation with Nasdaq 100. This confirms that Bitcoin is no longer an independent safe-haven asset but a risk asset that moves in tandem with tech stocks.
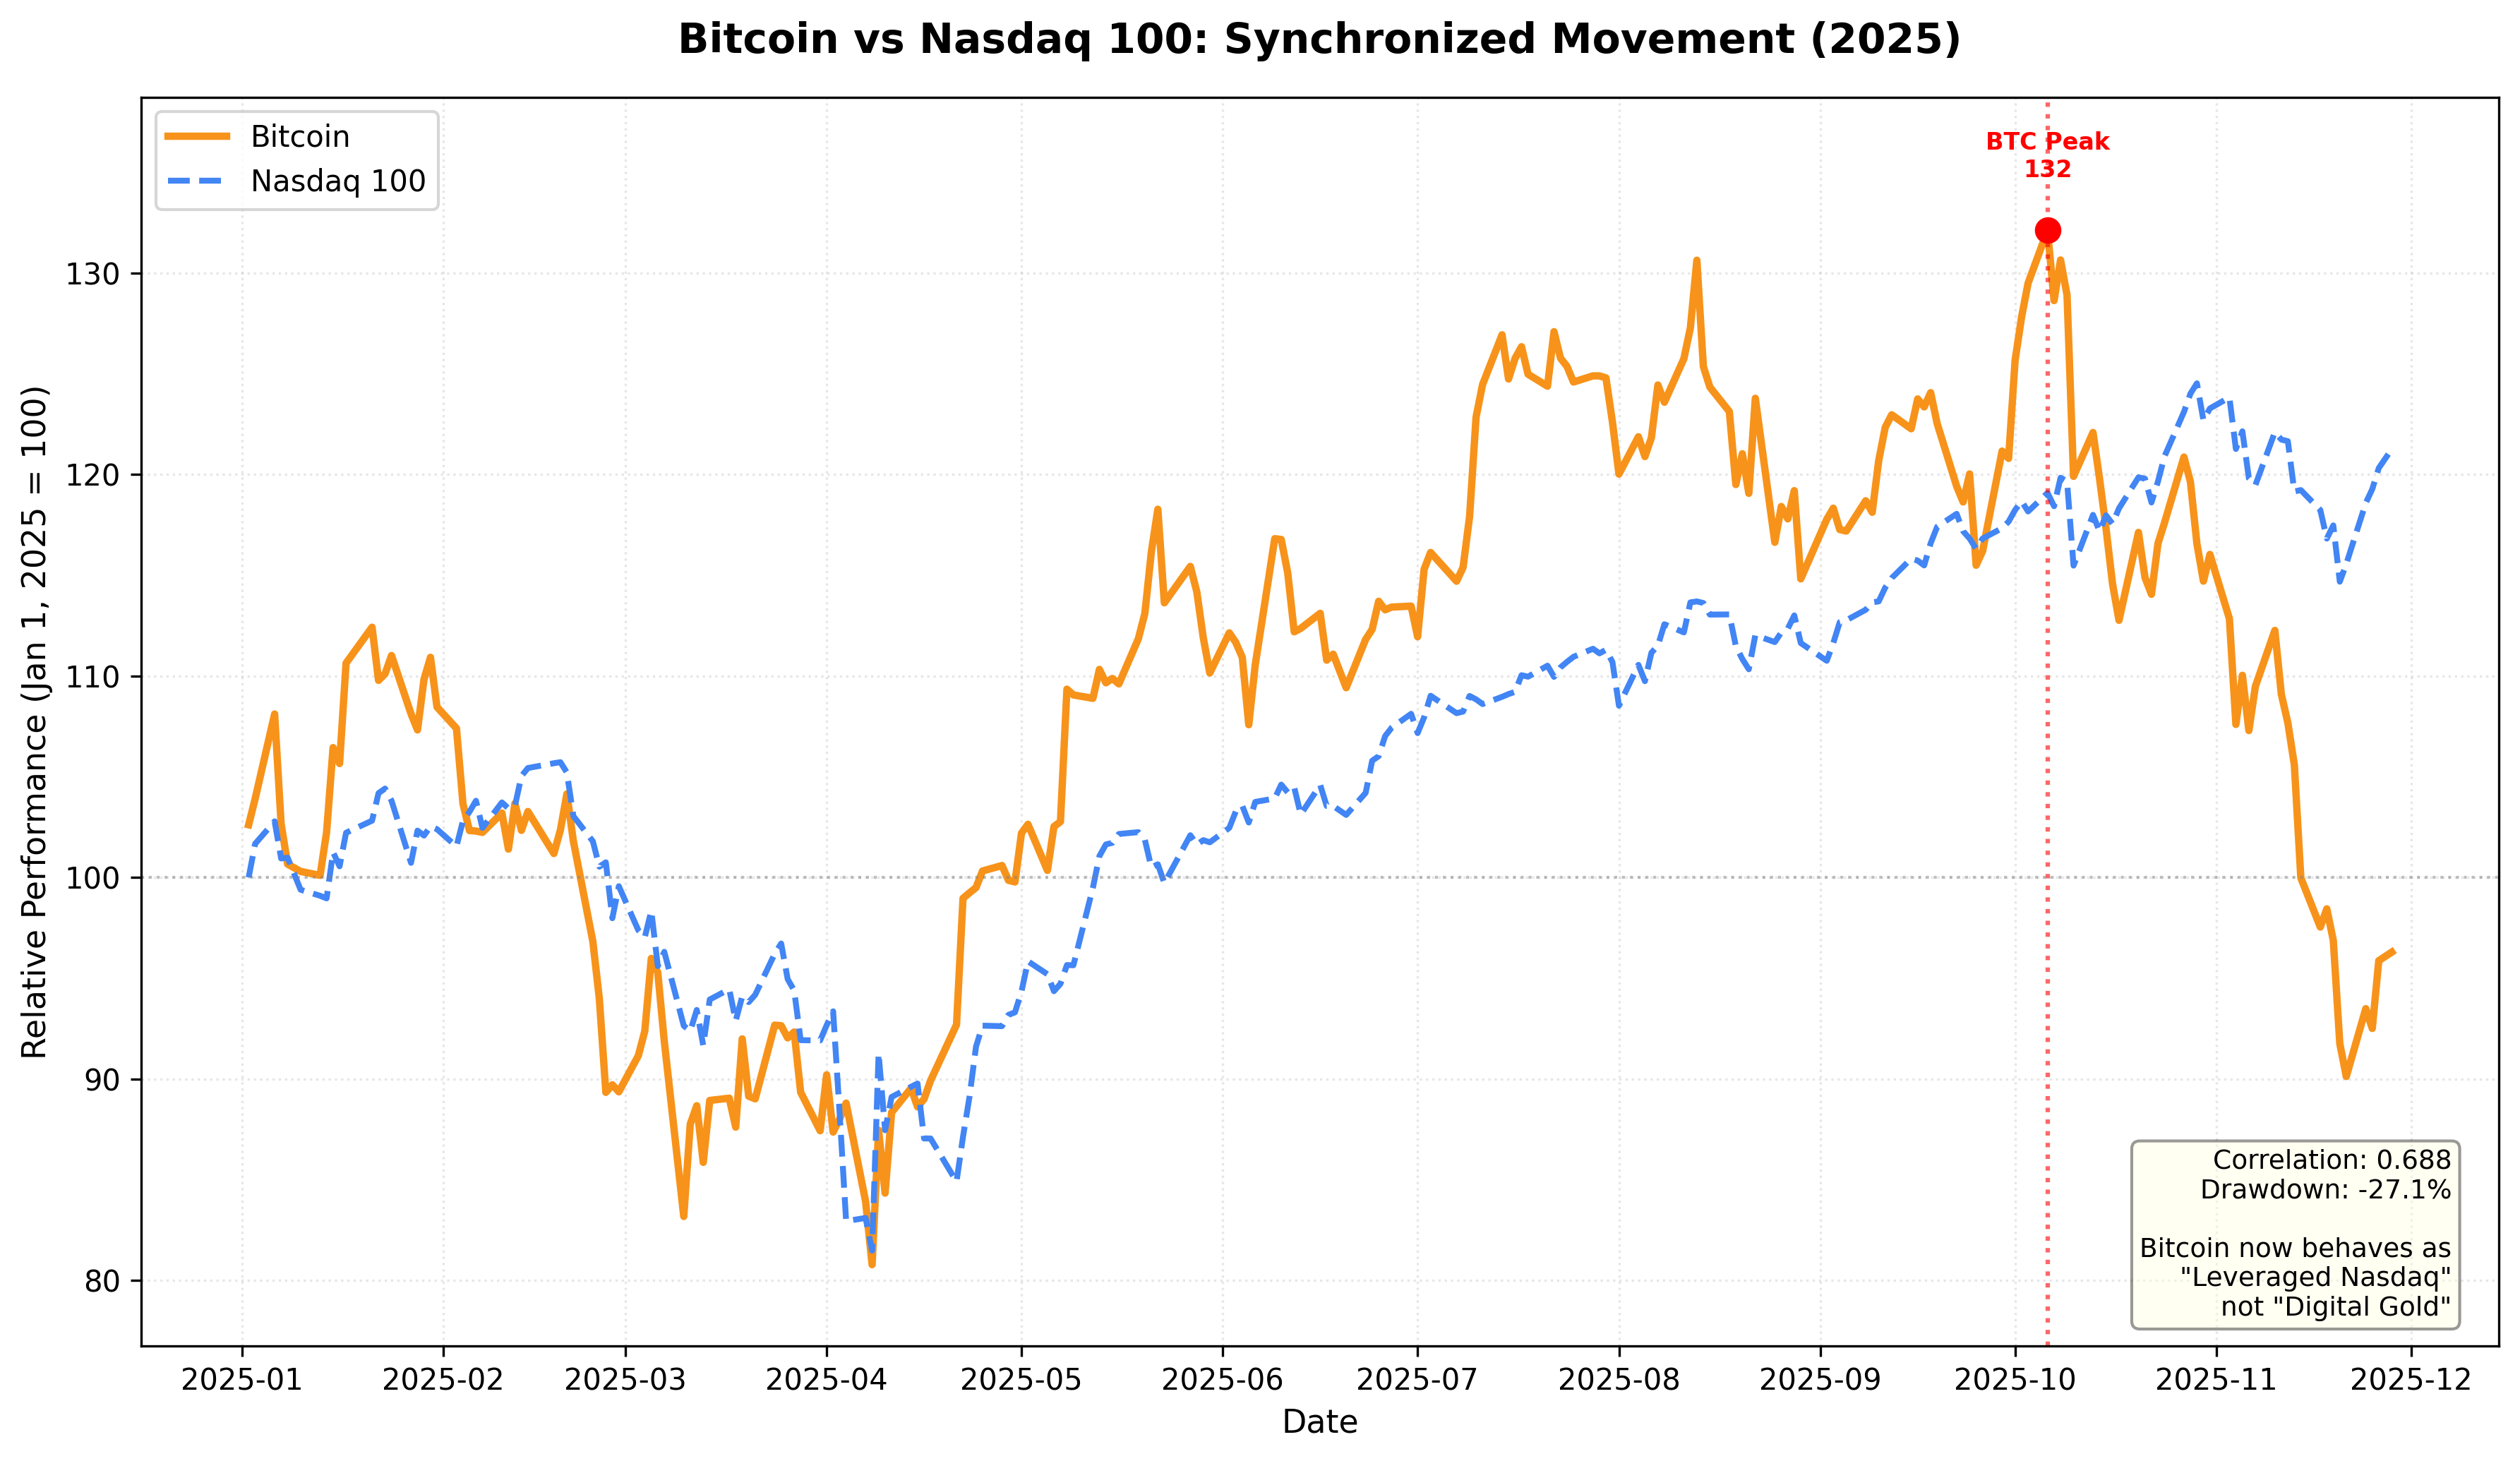
[Chart 2] shows relative performance since the start of 2025 (January 1, 2025 = 100). Bitcoin (orange line) peaked at 132.1 on October 06, 2025, then fell to 96.3 as of November 28, 2025. This represents a 27.1% decline from the peak.
In contrast, Nasdaq 100 (blue dashed line) rose 21.3% year-to-date during the same period, showing relatively moderate correction. Bitcoin's volatility being approximately 1.3x that of Nasdaq justifies the "leveraged Nasdaq" characterization.
Causes of the Plunge
Primary drivers of Bitcoin's decline include:
- AI Stock Valuation Concerns: Tech sector correction spreading to crypto
- Fed Policy Uncertainty: Decreased likelihood of December rate cut
- Short-Term Holder Panic Selling: Investors with average entry at $102K-$107K capitulated at $96,853
- Government Shutdown: 43-day shutdown drained market liquidity
Long-Term Holders Held Firm
According to CryptoQuant analysis, this decline was driven by Short-Term Holder (STH) panic selling rather than Long-Term Holder (LTH) distribution. On November 14 alone, holders with less than 1M BTC sold 148,241 BTC at a loss.
3. Black Friday: AI-Driven $11.8 Billion Sales Record
AI Transforms Consumer Patterns
2025 Black Friday U.S. online sales reached $11.8 billion, up 9.1% year-over-year. Notably, AI tools increased traffic by 805% and generated $3.0 billion in additional sales. This represents approximately 25% of total online sales, demonstrating AI's emergence as a game-changer in retail.
Mastercard SpendingPulse reported overall Black Friday sales increased 4.1% YoY, but after adjusting for inflation, real growth was only approximately 1%. The gap between nominal and real growth highlights weakening consumer purchasing power.
AI's Overwhelming Conversion Rate
Shoppers arriving at product pages through generative AI services showed 38% higher purchase conversion rates compared to other channels. This indicates AI isn't just increasing traffic but driving qualitative improvement in actual purchases.
However, Salesforce data reveals complex changes in consumer behavior:
- 2% fewer items purchased YoY
- 1% decrease in order volume
- 7% increase in average selling price
Consumers are buying fewer items at higher prices, suggesting strengthened selective consumption amid inflationary pressures.
Mobile and Holiday Season Outlook
Mobile devices accounted for 52.2% of total spending, expected to rise to 56.1% for the entire holiday season. From November 1-28, consumers spent $111.4 billion online, and Adobe forecasts total holiday season sales will exceed $253.4 billion, breaking $1 trillion quarterly for the first time.
Shadow Over 2026 Consumption
Despite AI's successful ROI generation, 32% of Americans plan to reduce 2026 spending due to Trump tariff concerns, casting a shadow over future consumption outlook. The retail industry must balance AI-driven efficiency improvements with macroeconomic uncertainty.
4. Connecting Three Stories: Liquidity, Risk Assets, and AI
QT End's Impact on Bitcoin
Historically, Fed liquidity policy and Bitcoin prices have shown close relationships. After QT ended in August 2019, Bitcoin surged, and similar patterns emerged following QE initiation in March 2020.
[Chart 1] marks the QT end point (blue dashed line). Following this point, as liquidity withdrawal ceases, Bitcoin—strongly linked to Nasdaq with a 0.688 correlation—is expected to benefit positively.
Current Market Snapshot
Current market conditions in numbers:
- Fed Balance Sheet: November 26, 2025 at $6.55T (down 26.9% from peak)
- Bitcoin: November 28, 2025 at -3.7% YTD (-27.1% from peak)
- Nasdaq 100: +21.3% YTD
- Bitcoin-Nasdaq Correlation: 0.688
Conclusion: Lessons from 2025 Financial Markets
Key Insights
-
Central Bank Policy is Primary: $2.41 trillion QT impacted all asset classes.
-
Bitcoin is a Risk Asset: A 0.688 correlation confirms Bitcoin is not a safe haven but a risk asset like tech stocks.
-
Leverage Cuts Both Ways: Bitcoin's volatility is multiples of Nasdaq—opportunity in bull markets, risk in downturns.
-
AI Delivers Real ROI: Black Friday's $3B in AI-driven sales and 38% higher conversion rates justify retail industry AI investment.
-
Nominal Growth ≠ Real Growth: After inflation adjustment, consumption growth is only 1%, with consumers buying fewer items at higher prices.
Forward Outlook
QT termination should create a favorable environment for risk assets as liquidity conditions improve. However, as [Chart 2] shows, Bitcoin currently sits 27.1% below its peak, suggesting recovery will take time.
Investors should carefully monitor the Fed's next policy moves and Bitcoin-Nasdaq correlation dynamics for prudent positioning.
Data Sources
- Fed Balance Sheet: FRED API (WALCL series, updated November 26, 2025)
- Bitcoin Price: yfinance (BTC-USD)
- Nasdaq 100: yfinance (^NDX)
- Analysis Period:
- Fed Balance Sheet: January 1, 2020 ~ November 26, 2025
- Bitcoin/Nasdaq: January 1, 2025 ~ November 28, 2025
All figures and charts in this article are generated from real-time data.
Chart Descriptions:
- [Chart 1]: Historical Fed balance sheet trend. Green area shows total assets, red shading indicates QT period (June 2022 ~ December 1, 2025).
- [Chart 2]: 2025 relative performance of Bitcoin and Nasdaq 100. Normalized to 100 on January 1, 2025 for direct comparison of both assets' movements.
Comments (0)
No comments yet. Be the first to comment!