Moat signals in plain English
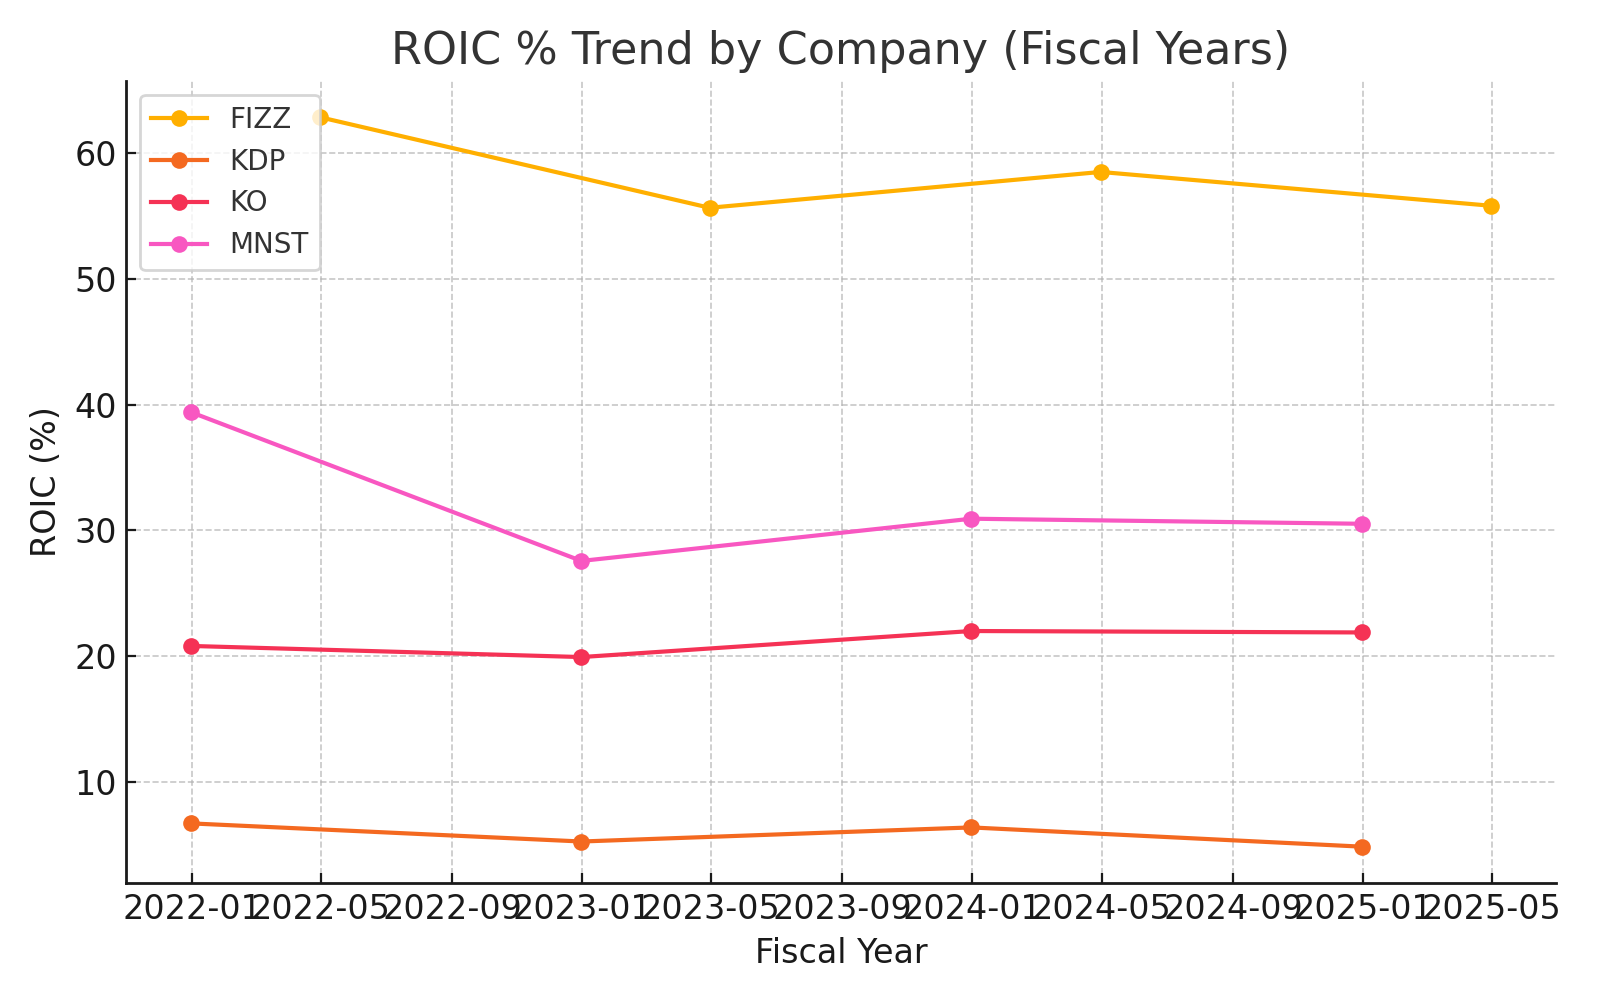
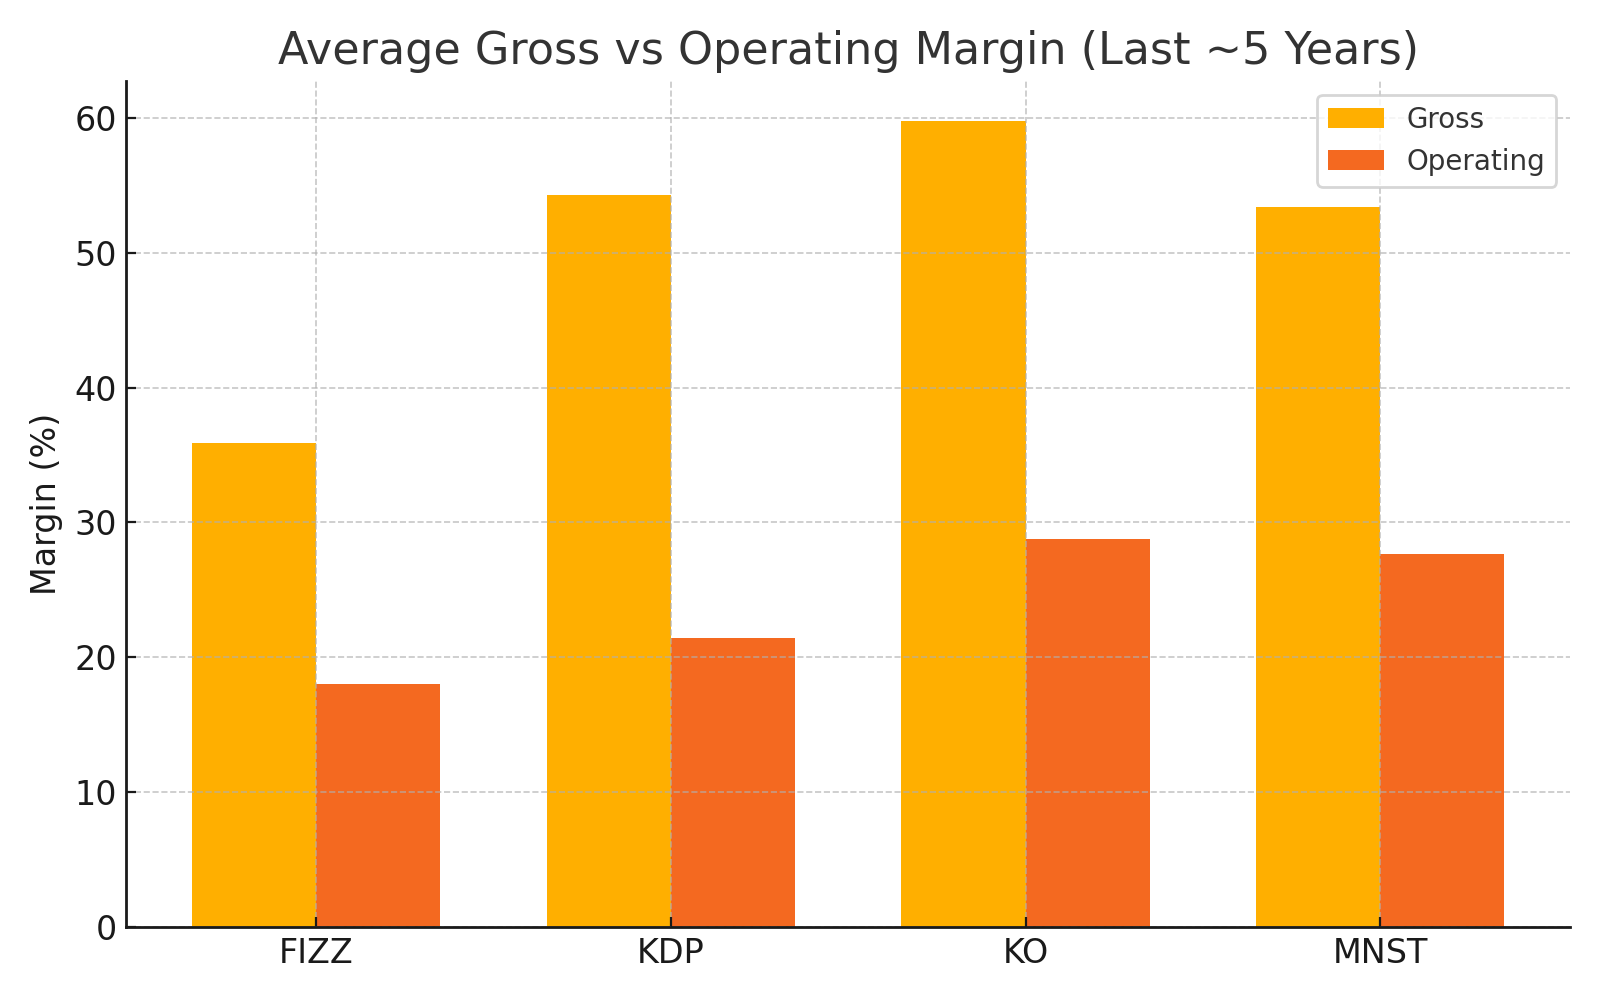
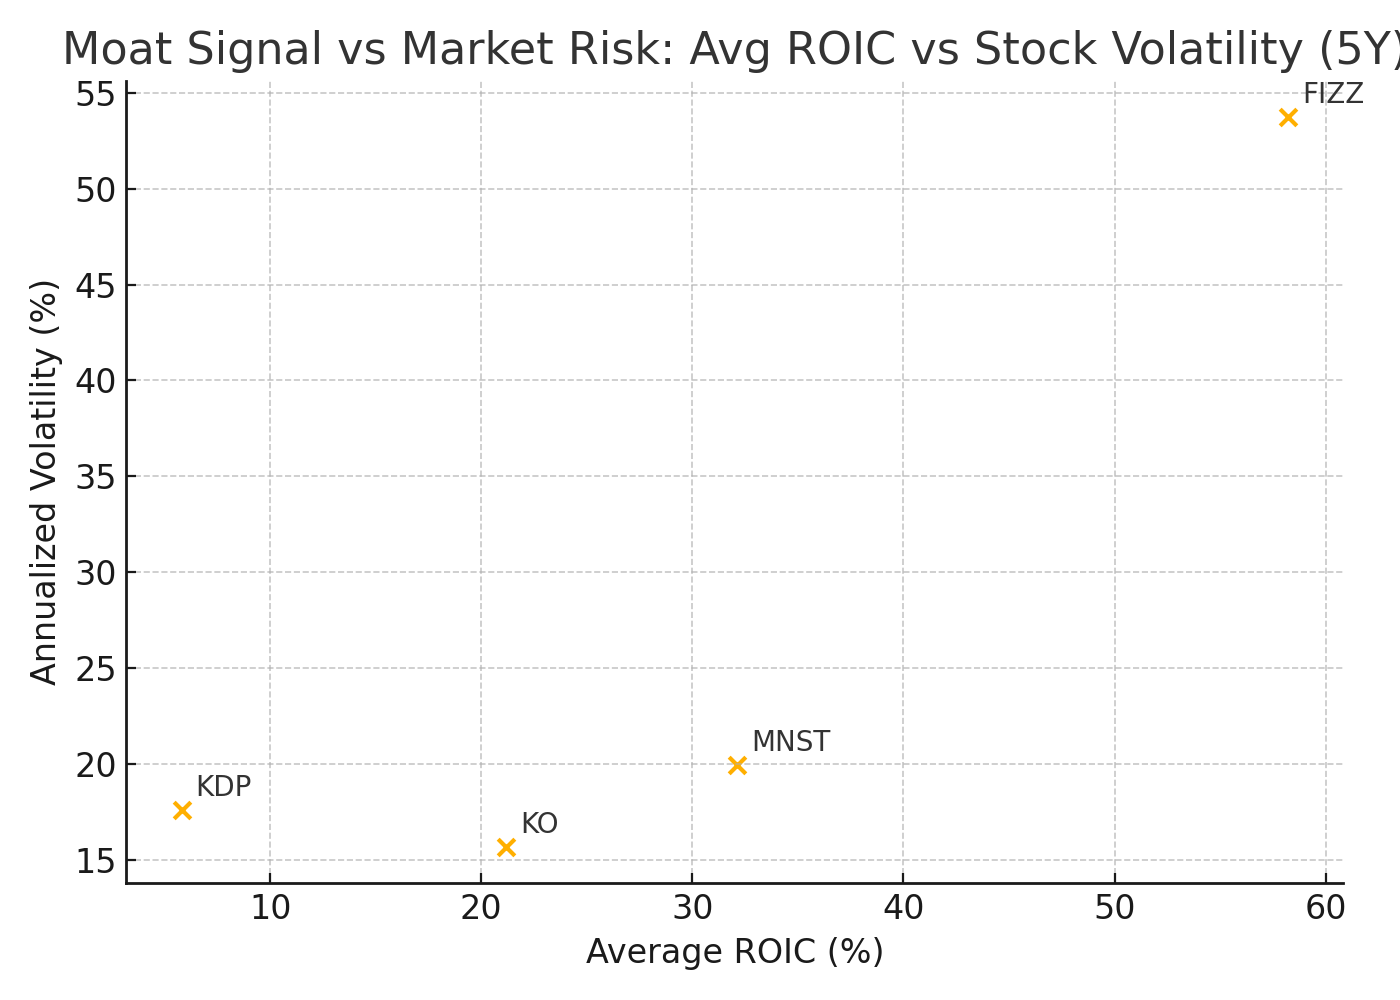
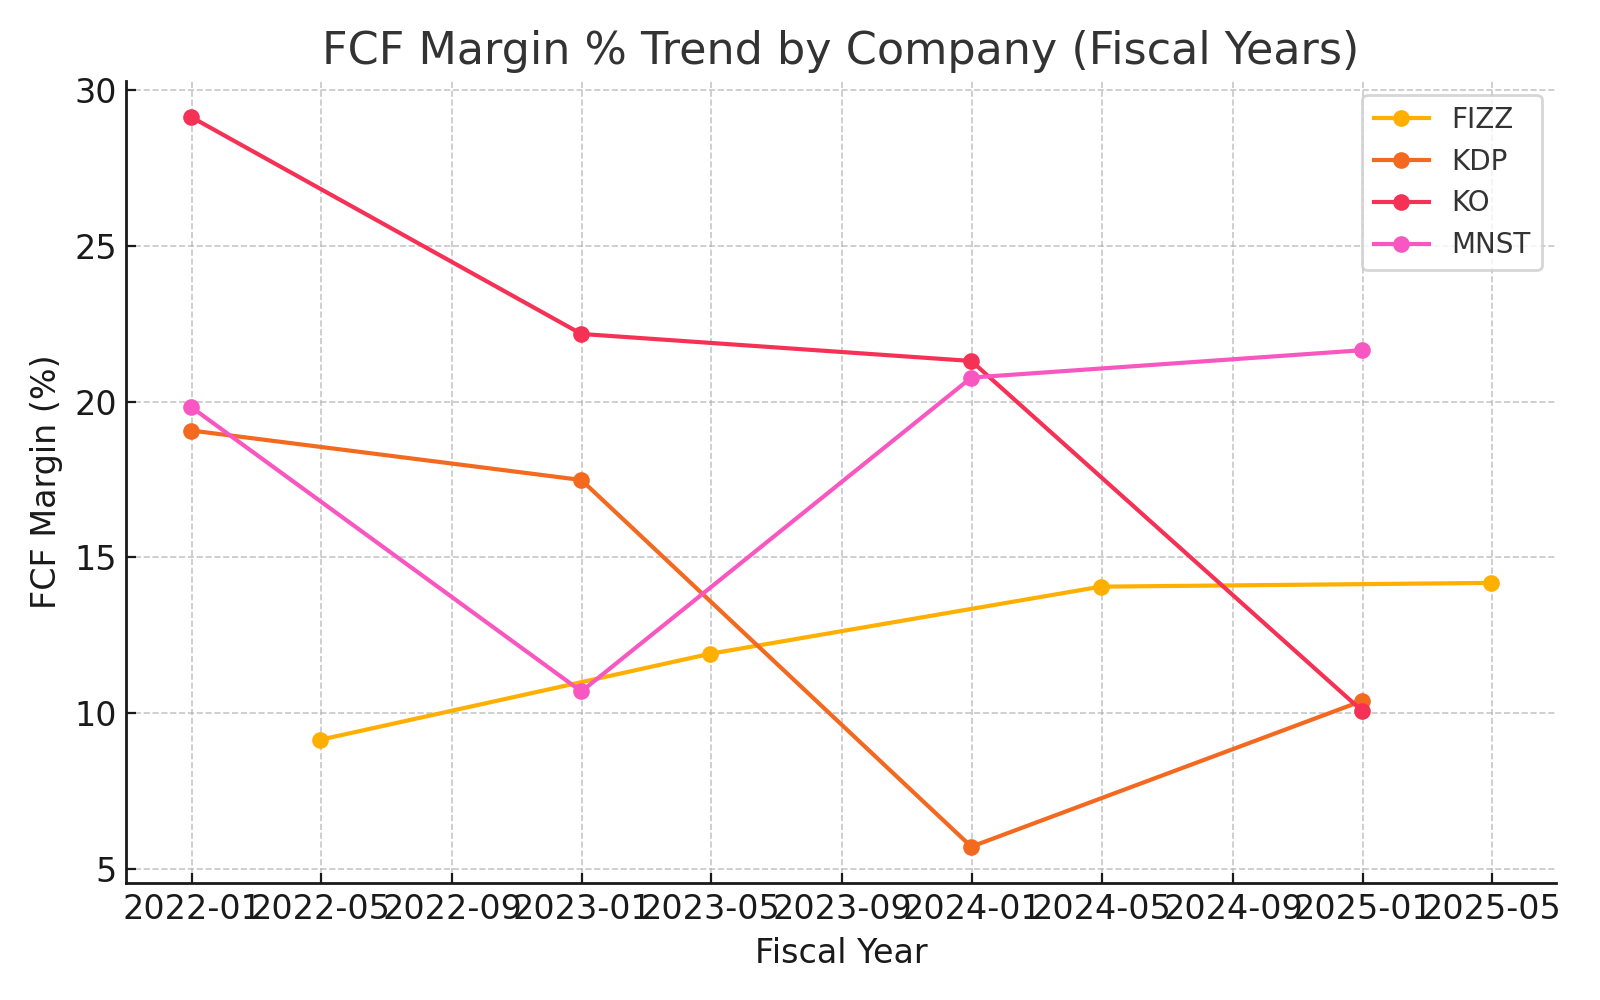
A business with a moat can defend profits over time. In our beverage set, Coca-Cola (KO) is the clearest example, and the story is visible in basic financial metrics. KO's average gross margin (~59.8%) and operating margin (~28.8%) dwarf most peers, a sign of brand power and distribution scale: the company keeps more from every dollar of sales. Those rich margins convert into reliable free cash flow (~20.7% FCF margin), which funds dividends, buybacks, and reinvestment that keep the moat strong. Most important, KO's Return on Invested Capital (~21.2%) stays high and steady (very low variability), showing the business creates value year after year—not just in good times. Monster (MNST) also looks impressive with high ROIC (~32%) and near-KO margins, but its stock and operations run a bit hotter: more volatility and sensitivity to category trends. Keurig Dr Pepper (KDP) sits mid-pack—healthy gross margin yet a much lower ROIC (~5.8%), hinting at a narrower moat. FIZZ is the cautionary tale: a sky-high ROIC number can be flattered by a tiny capital base; when you pair it with much lower margins (~35.9% gross, ~18.0% operating) and very high stock volatility, durability looks weaker. The market's verdict aligns with the fundamentals: KO compounds steadily with lower volatility and smaller drawdowns, classic moat behavior.
| Ticker | Avg Gross Margin % | Avg Operating Margin % | Avg ROIC % | Avg FCF Margin % | 5y Price CAGR % | Ann. Volatility % |
|---|---|---|---|---|---|---|
| KO | 59.75% | 28.75% | 21.17% | 20.67% | 8.40% | 15.67% |
| MNST | 53.39% | 27.67% | 32.11% | 18.24% | 9.32% | 19.92% |
| KDP | 54.30% | 21.43% | 5.81% | 13.17% | 4.06% | 17.60% |
| FIZZ | 35.86% | 18.03% | 58.21% | 12.33% | 5.35% | 53.73% |
- Revenue: shows how much the company sells. Steady growth means the brand is in demand. For a moat, consistent sales prove customer loyalty.
- Gross Margin: what's left after paying for ingredients and production. High margins mean strong pricing power, a key moat signal.
- Operating Margin: profit after running the business. Efficiency plus brand strength keep this high—proof of resilience.
- Net Margin: bottom-line profit after taxes and interest. A healthy net margin means the business model is durable in the real world.
- Free Cash Flow Margin: actual cash left after paying to keep the business running. This cash funds dividends, buybacks, and reinvestment that protect and grow the moat.
- ROIC: how effectively profits are generated from all capital (equity + debt). Sustained high ROIC well above cost of capital means the moat is real.
- ROE and ROA: how much profit is earned per dollar of equity and assets. High, stable returns point to efficient use of resources that competitors can't easily copy.
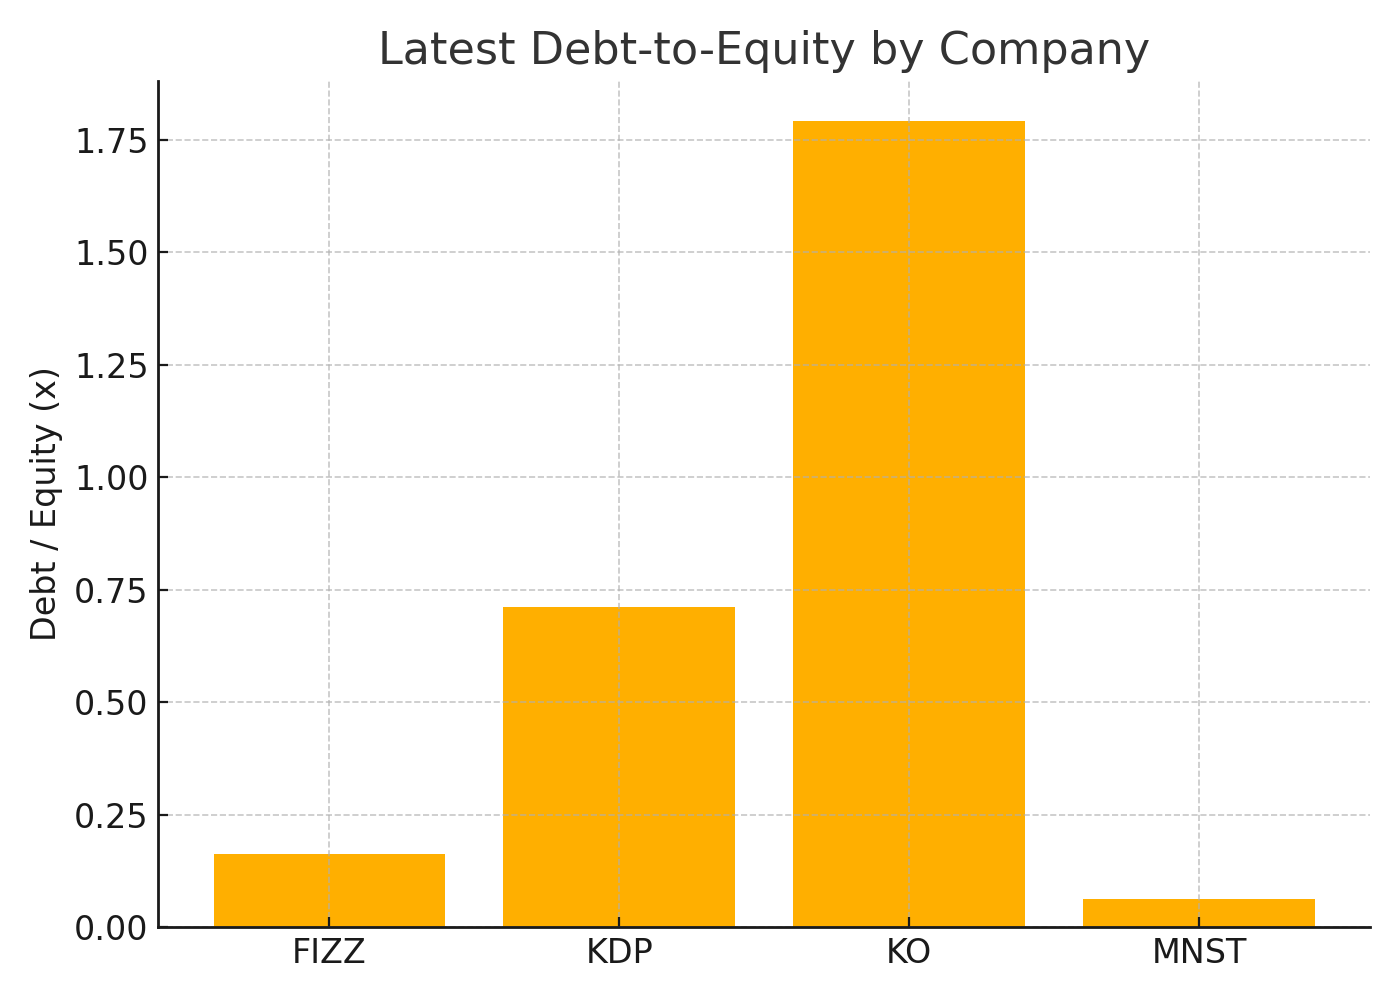
- Debt-to-Equity: shows reliance on borrowing. Companies with moats can carry debt safely; if a company needs high debt just to compete, the moat is weak.
- Interest Coverage: measures how easily profits cover interest payments. Moaty businesses earn enough to pay interest many times over.
- Price CAGR (5y): how much the stock has compounded for investors. Markets reward durable moats with steady compounding.
- Volatility & Drawdown: measure the risk felt by investors. Moaty companies usually have gentler swings and smaller drops because their business is stable.
Comments (0)
No comments yet. Be the first to comment!