Understanding the Paradox Portfolio: What Are These Numbers?
Welcome to the world of financial contradictions! The Paradox Portfolio identifies companies with a curious mix of financial traits that might look great in some ways but raise questions in others. Let's break down what each of these metrics means in plain English:
The Four Key Metrics That Matter
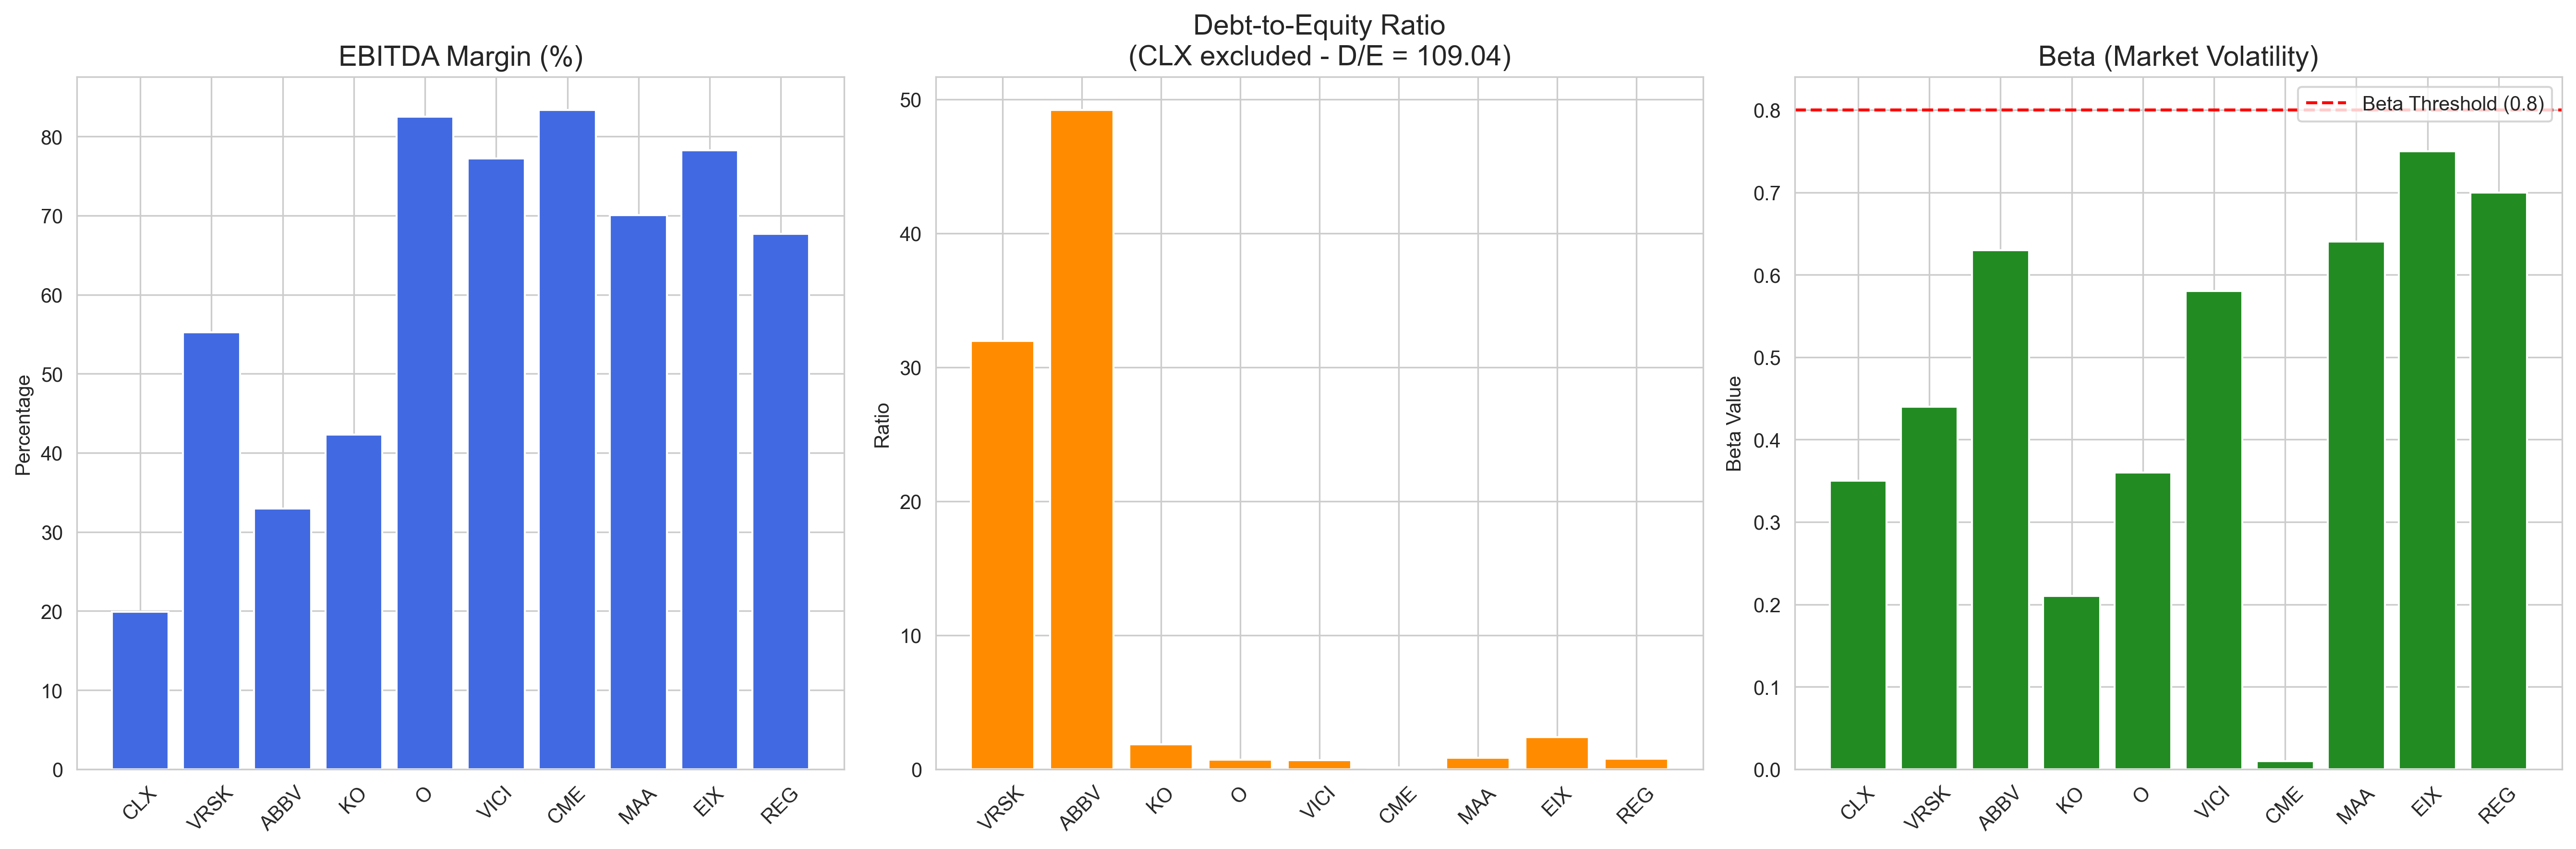
- **EBITDA Margin %**: This measures how profitable a company is before accounting for interest, taxes, depreciation and amortization. Think of it as 'earnings power' - how much profit a company generates from its core operations relative to its revenue. Higher numbers are typically better, showing strong operational efficiency. Our Paradox companies have impressive EBITDA margins, with CME Group topping the list at 83.36%.
- **Debt-to-Equity Ratio**: This shows how much a company relies on borrowed money versus shareholder investments to fund its operations. A D/E ratio of 1 means equal amounts of debt and equity. Higher numbers indicate more leverage (more debt). Clorox (CLX) has an extraordinary ratio of 109.04, meaning it has over 109 times more debt than equity!
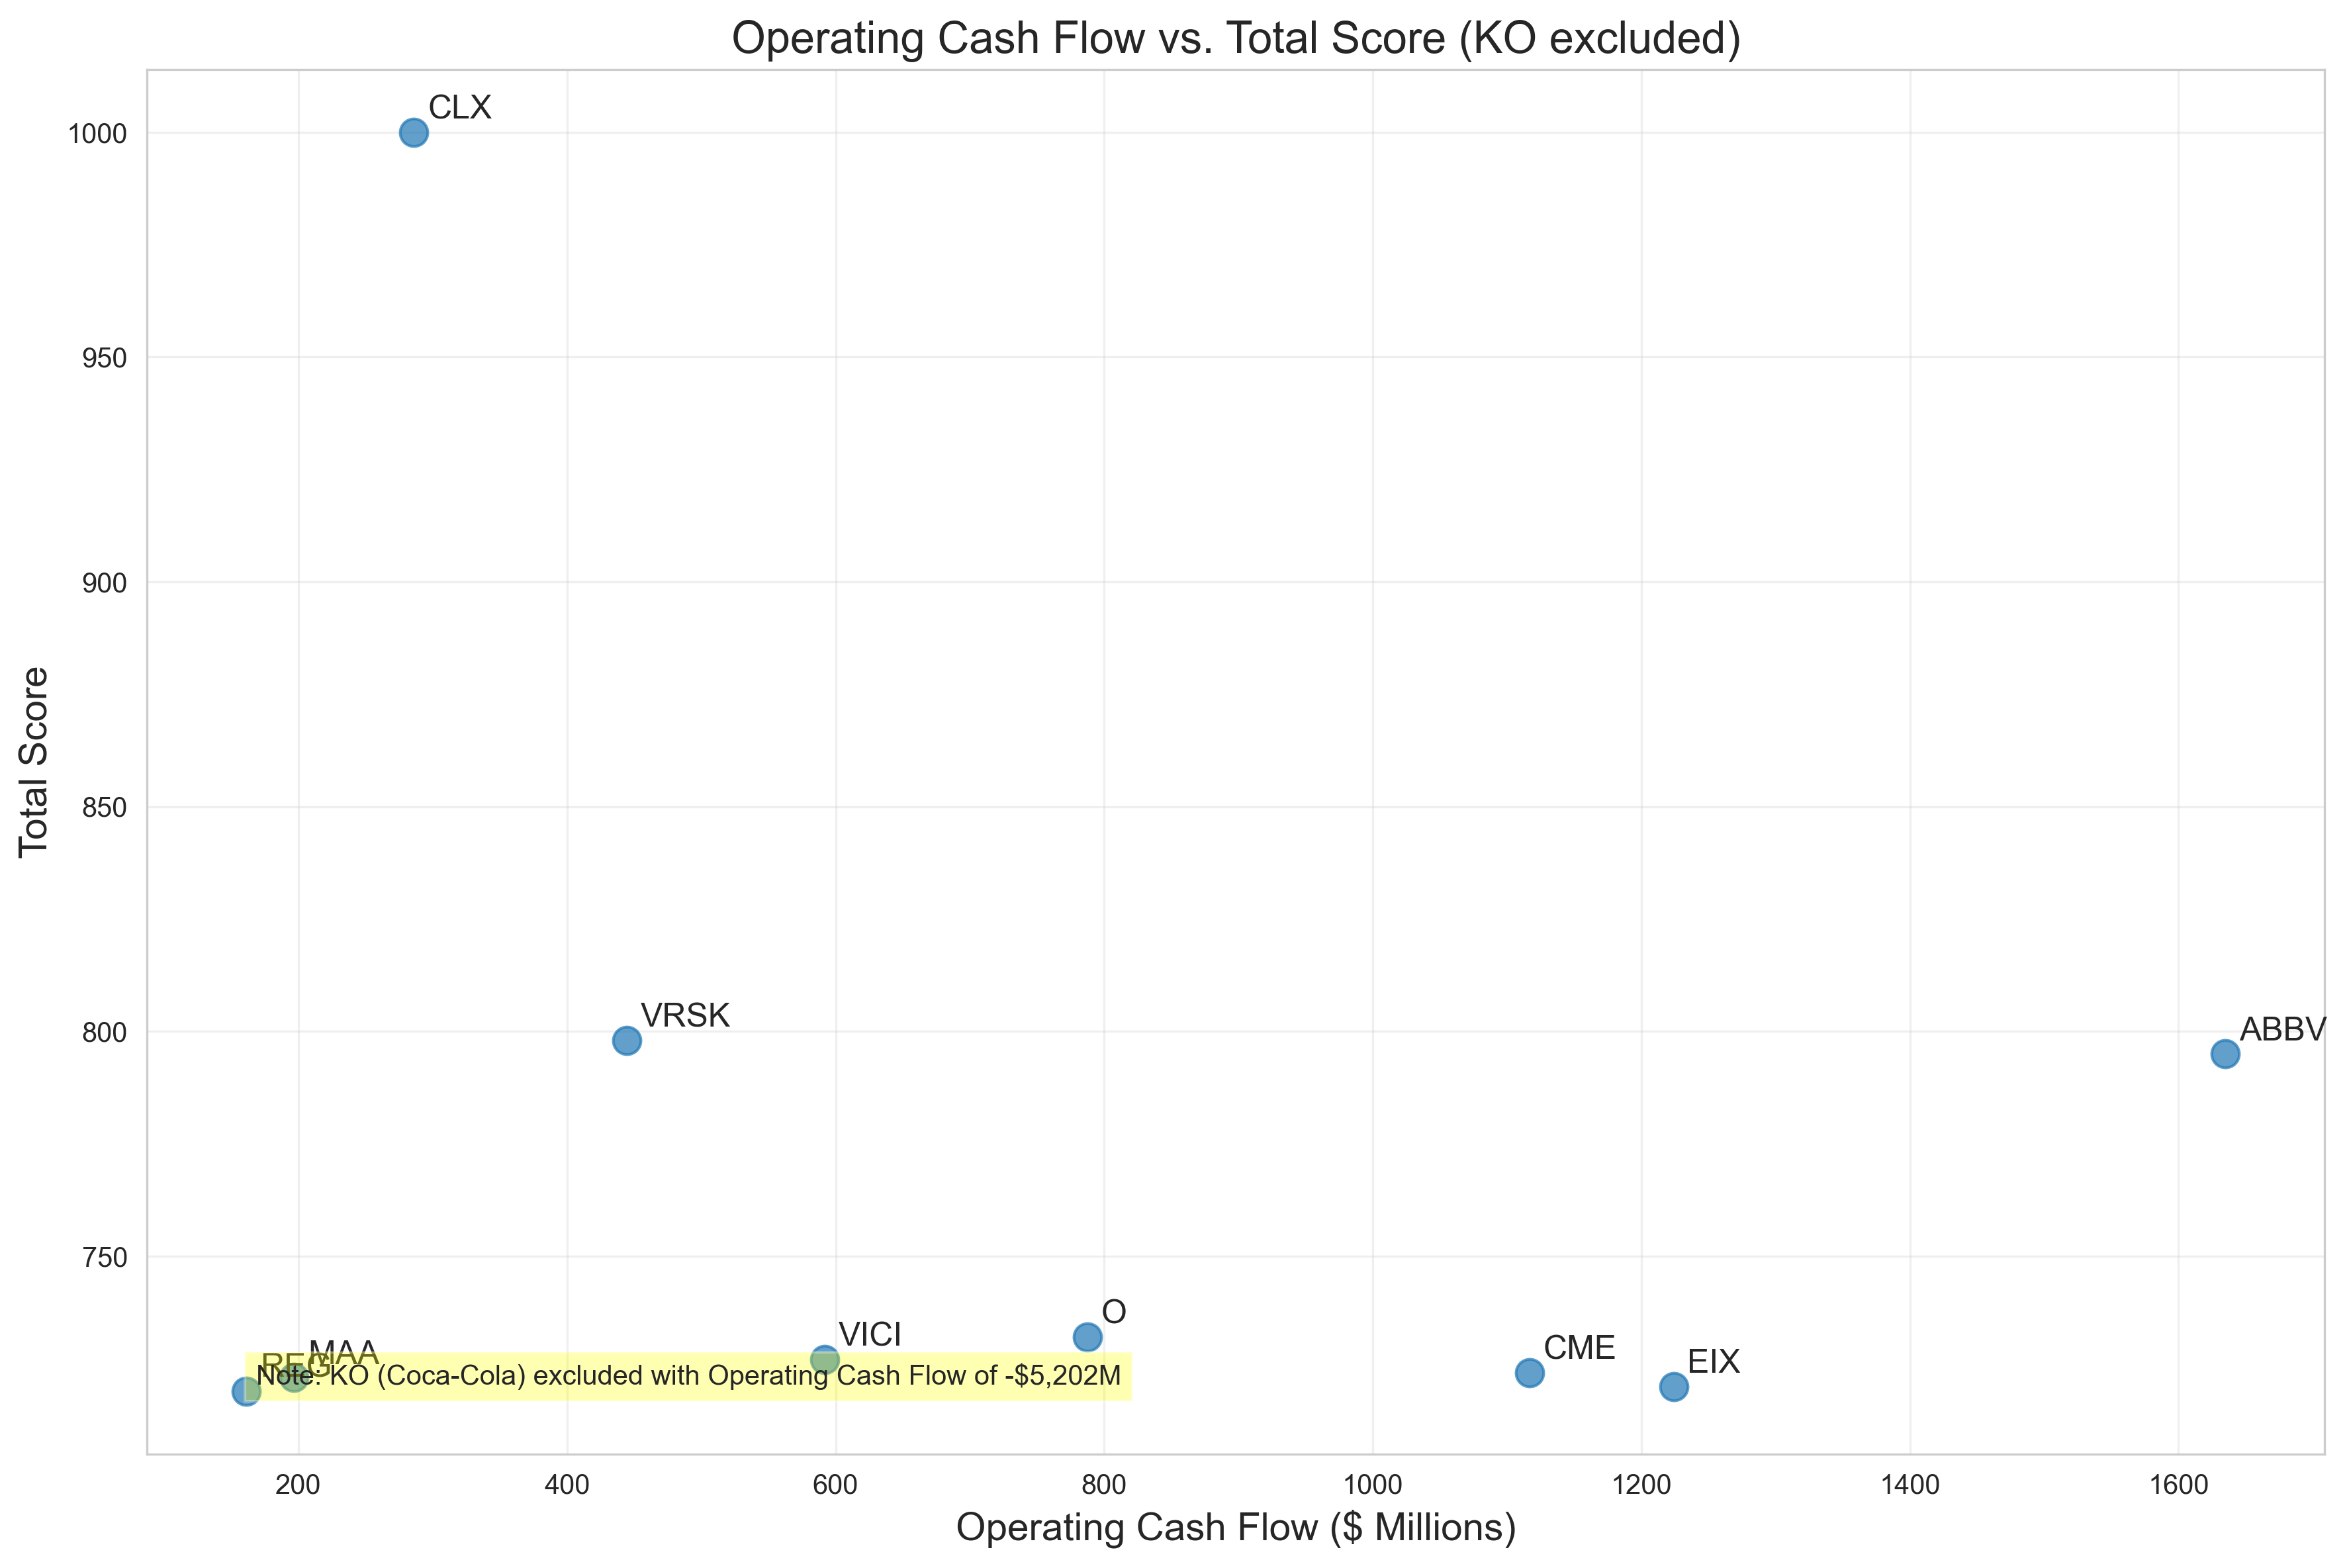
- **Operating Cash Flow**: This is actual cash generated from day-to-day business operations - not accounting profits, but real money flowing in. Measured in millions of dollars, higher numbers typically indicate better financial health. Interestingly, Coca-Cola (KO) shows negative cash flow of -$5.2 billion despite strong profitability on paper.
- **Beta**: This measures stock price volatility compared to the overall market. A beta of 1 means the stock moves with the market, while lower numbers (like all our Paradox companies with beta < 0.8) indicate stocks that are less volatile than average. CME Group has an incredibly low beta of 0.01, meaning its price barely reacts to market movements.
How the Ranking Works
Our ranking combines these metrics to find companies where high profitability (high EBITDA margin) meets high leverage (high debt-to-equity) and limited cash generation (low operating cash flow), all while maintaining stable stock prices (low beta). Each company receives a score out of 1000 based on a weighted formula: 40% for EBITDA margin, 30% for debt-to-equity ratio, and 30% for operating cash flow (with lower cash flow contributing positively to the score).
Real Estate Dominates: Why These Industries Show the Paradox
Looking at our top 10 list, something immediately jumps out: Real Estate companies appear four times, making up 40% of our Paradox Portfolio. Consumer Staples follow with two entries. This isn't random - these sectors have structural characteristics that naturally create this financial profile.
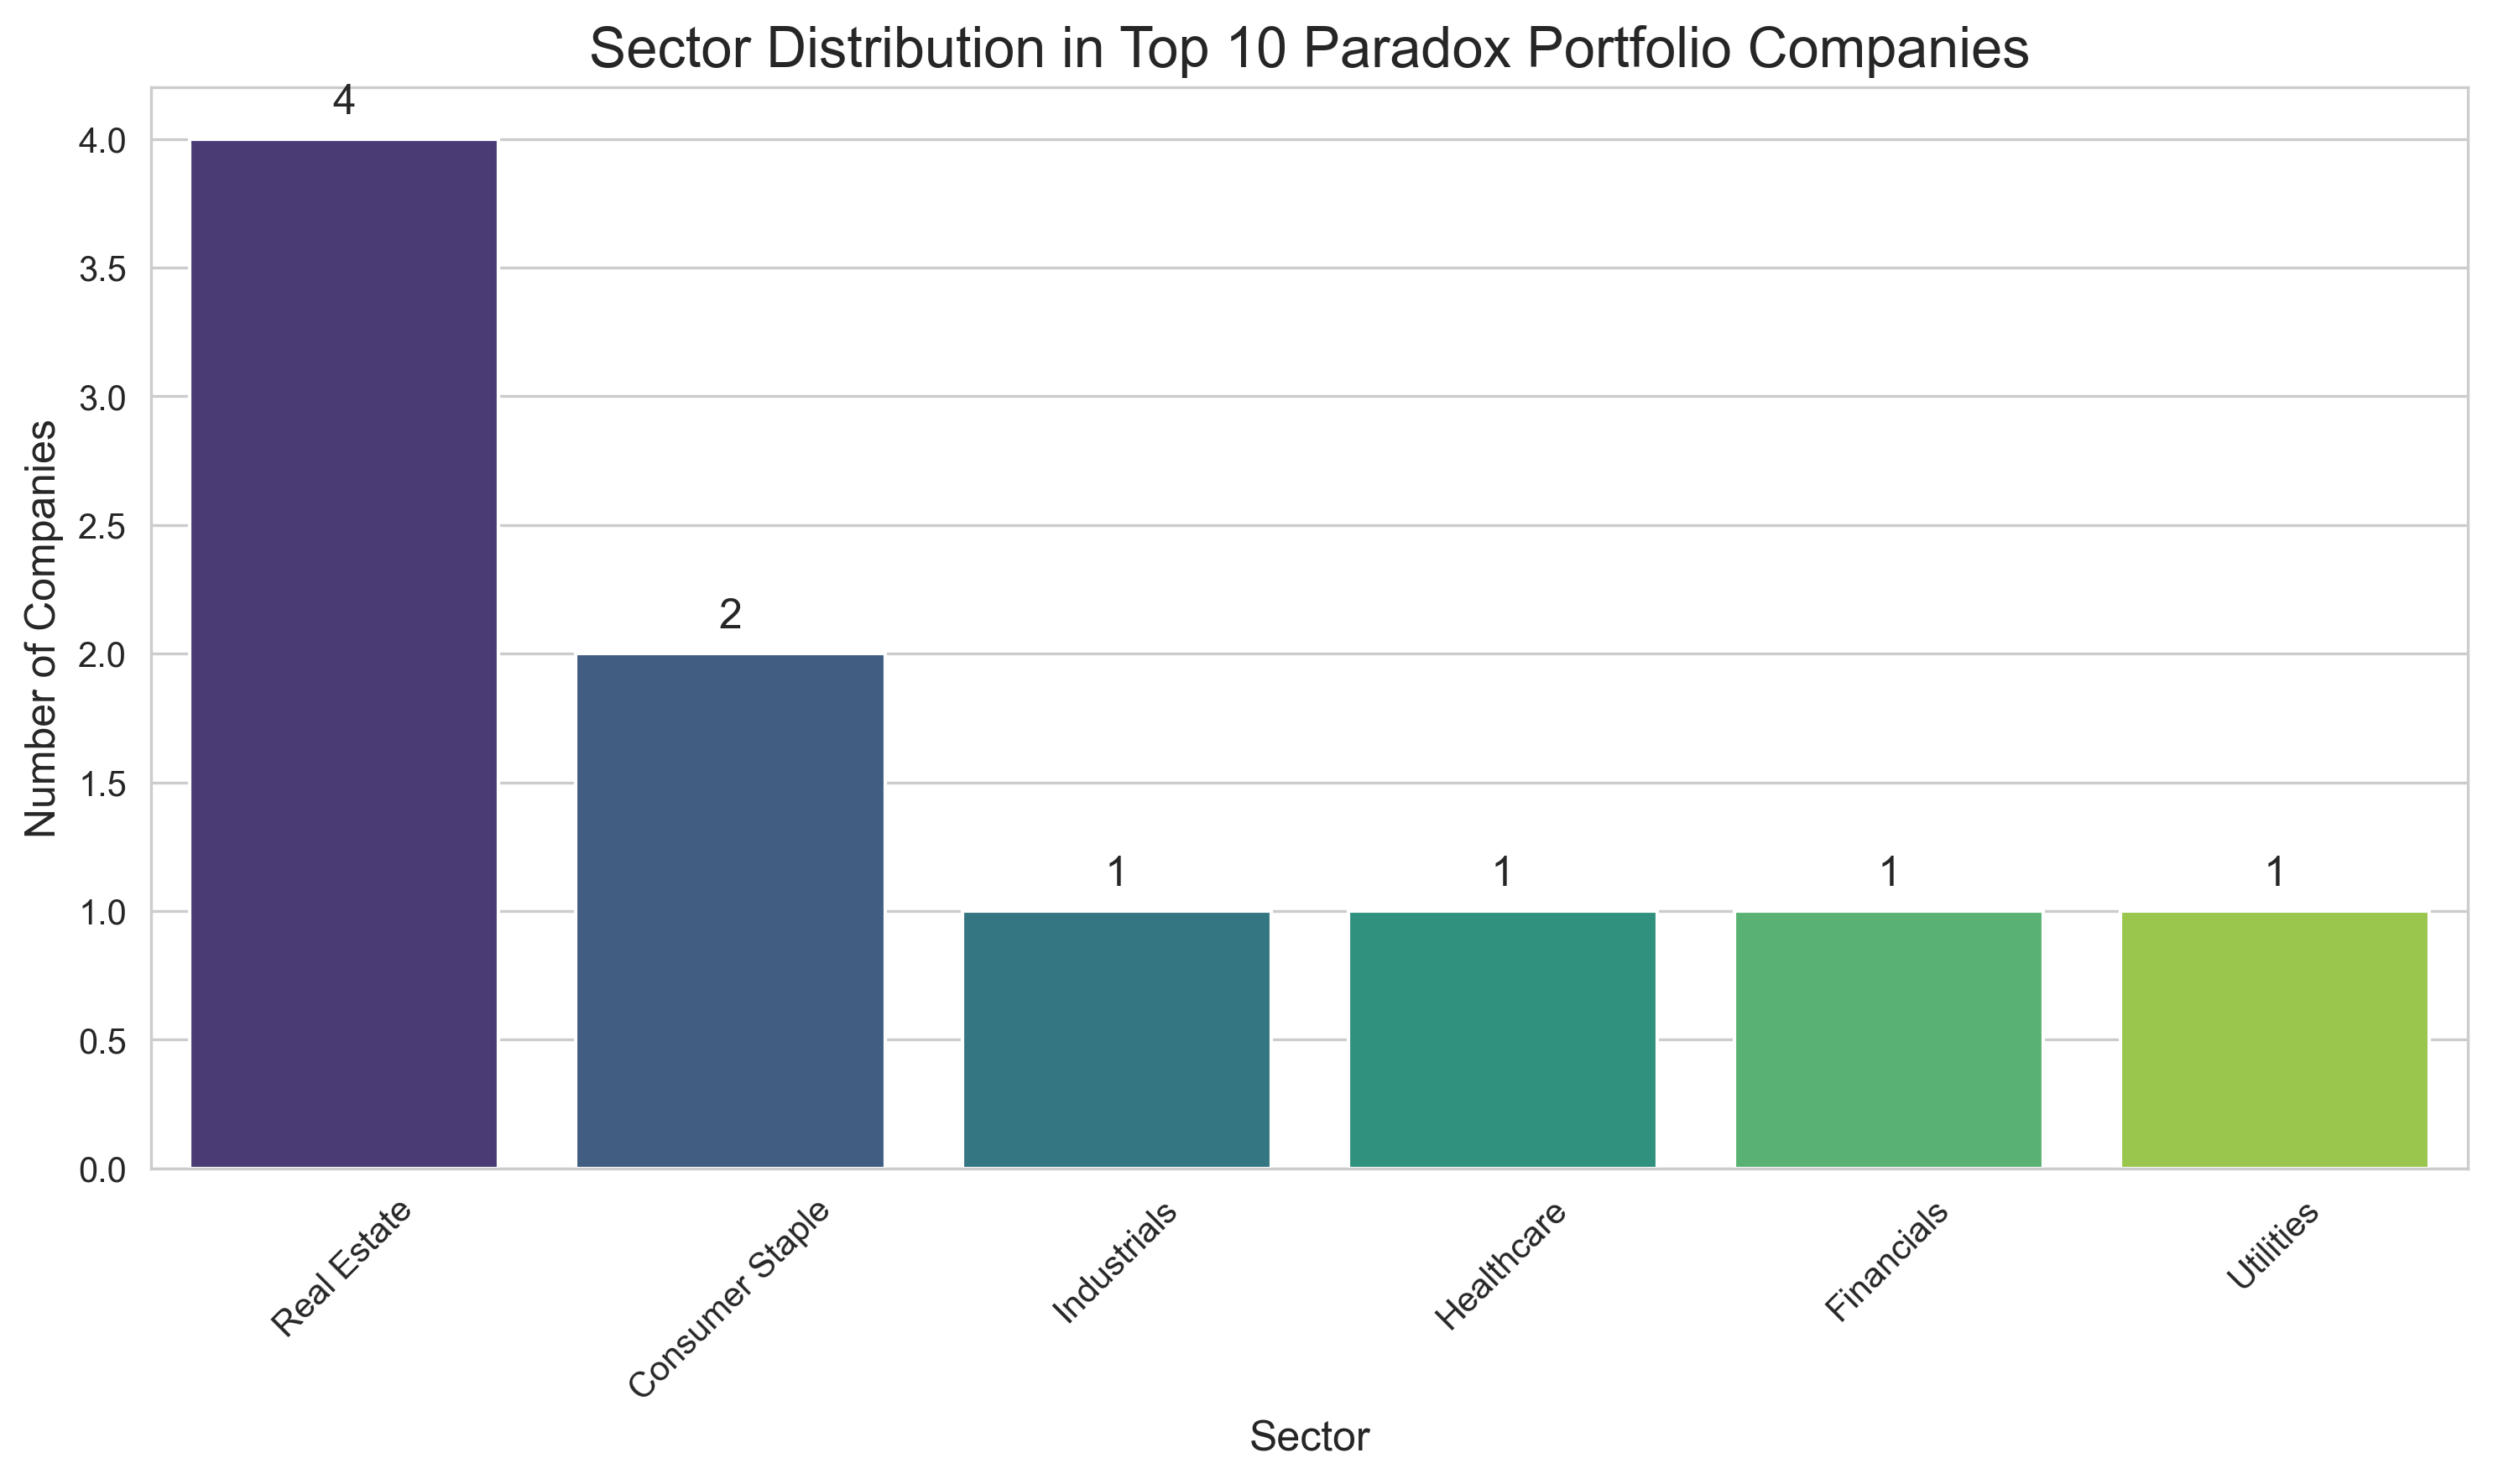
Real Estate companies like Realty Income (O), Vici Properties (VICI), Mid-America Apartment Communities (MAA), and Regency Centers (REG) typically generate steady rental income with high profit margins. However, they also tend to use significant leverage to purchase properties and may have limited cash flow due to maintenance costs, property improvements, and expansion. Their stable business models also contribute to lower stock price volatility.
Consumer Staples companies like Clorox (CLX) and Coca-Cola (KO) are interesting additions to our list. These companies sell everyday products with strong brand recognition, allowing for healthy profit margins. Their presence suggests that even traditionally stable businesses can face cash flow challenges while maintaining profitability on paper.
The Profitability Paradox: When Profits Don't Equal Cash
Perhaps the most intriguing aspect of our Paradox Portfolio is the disconnect between profitability and cash generation. Companies like CME Group show an impressive 83.36% EBITDA margin but generate relatively modest cash flow compared to their profitability. Even more striking is Coca-Cola, with strong 42.33% EBITDA margins but negative operating cash flow of -$5.2 billion.
This disconnect can happen for several reasons: Companies might have long cash conversion cycles where customers take time to pay, or they might be investing heavily in inventory or equipment. Non-cash accounting entries can also make profits look good on paper while actual cash generation lags behind. For investors, this highlights the importance of looking beyond simple profit metrics to understand a company's true financial health.
Notable Standouts: The Extremes in Our Rankings
- **Clorox (CLX)**: With our highest score of 1000, Clorox stands out for its extraordinary debt-to-equity ratio of 109.04 - by far the highest in the group. This extreme leverage combined with modest operating cash flow of $286 million could raise questions about long-term financial sustainability.
- **Coca-Cola (KO)**: Despite being a household name with strong 42.33% EBITDA margins, Coca-Cola shows negative operating cash flow of -$5.2 billion. This dramatic cash burn contrasts sharply with its profitability on paper and could indicate significant investments, one-time expenses, or potential concerns.
- **CME Group (CME)**: This company demonstrates the most extreme combination of metrics with the highest EBITDA margin (83.36%), very low debt-to-equity (0.13), and the lowest beta (0.01). This suggests an extraordinarily stable and profitable business model with minimal leverage, yet its cash flow relative to its profitability places it in our paradoxical group.
What This Means for Financial Understanding
The Paradox Portfolio reveals an important lesson in financial analysis: no single metric tells the complete story about a company's financial health. High profitability doesn't guarantee strong cash flow. Low volatility doesn't ensure financial stability. High debt isn't always problematic if cash flow is strong enough to service it.
For those interested in understanding company financials, this analysis demonstrates the importance of examining multiple metrics together and understanding the business context. A company might appear strong by one measure while showing potential weaknesses in others. This multi-dimensional view provides a more complete picture of financial reality than any single number can provide.
Beyond the Numbers: Business Model Considerations
The companies in our Paradox Portfolio aren't necessarily in financial trouble - many have business models that naturally create this financial profile. Real estate companies often use significant leverage to acquire properties. Consumer staples companies might invest heavily in marketing or R&D. Understanding industry context is crucial when interpreting these financial metrics.
This ranking offers a fascinating lens through which to view the complexity of corporate finance. It reminds us that financial analysis requires looking beyond surface-level metrics to understand the true financial story of any company.
Comments (0)
No comments yet. Be the first to comment!