In the volatile world of tech stocks, traders constantly seek reliable tools to time their entries and exits. Bollinger Bands have long been a favorite among technical analysts, but do they actually work when put to the test? We backtested a Bollinger Bands strategy on three volatile tech stocks: NVIDIA (NVDA), Tesla (TSLA), and Palantir (PLTR), starting with $10,000 for each. The results were eye-opening.
What Are Bollinger Bands?
Developed by John Bollinger in the 1980s, Bollinger Bands consist of a 20-day simple moving average (SMA) as the middle band, with upper and lower bands placed at 2 standard deviations away. The bands expand during high volatility and contract when volatility decreases. The theory suggests prices tend to return to the mean over time—when price crosses below the lower band, it may be oversold and due for a bounce.
Strategy Rules
- Start with $10,000 cash for each stock
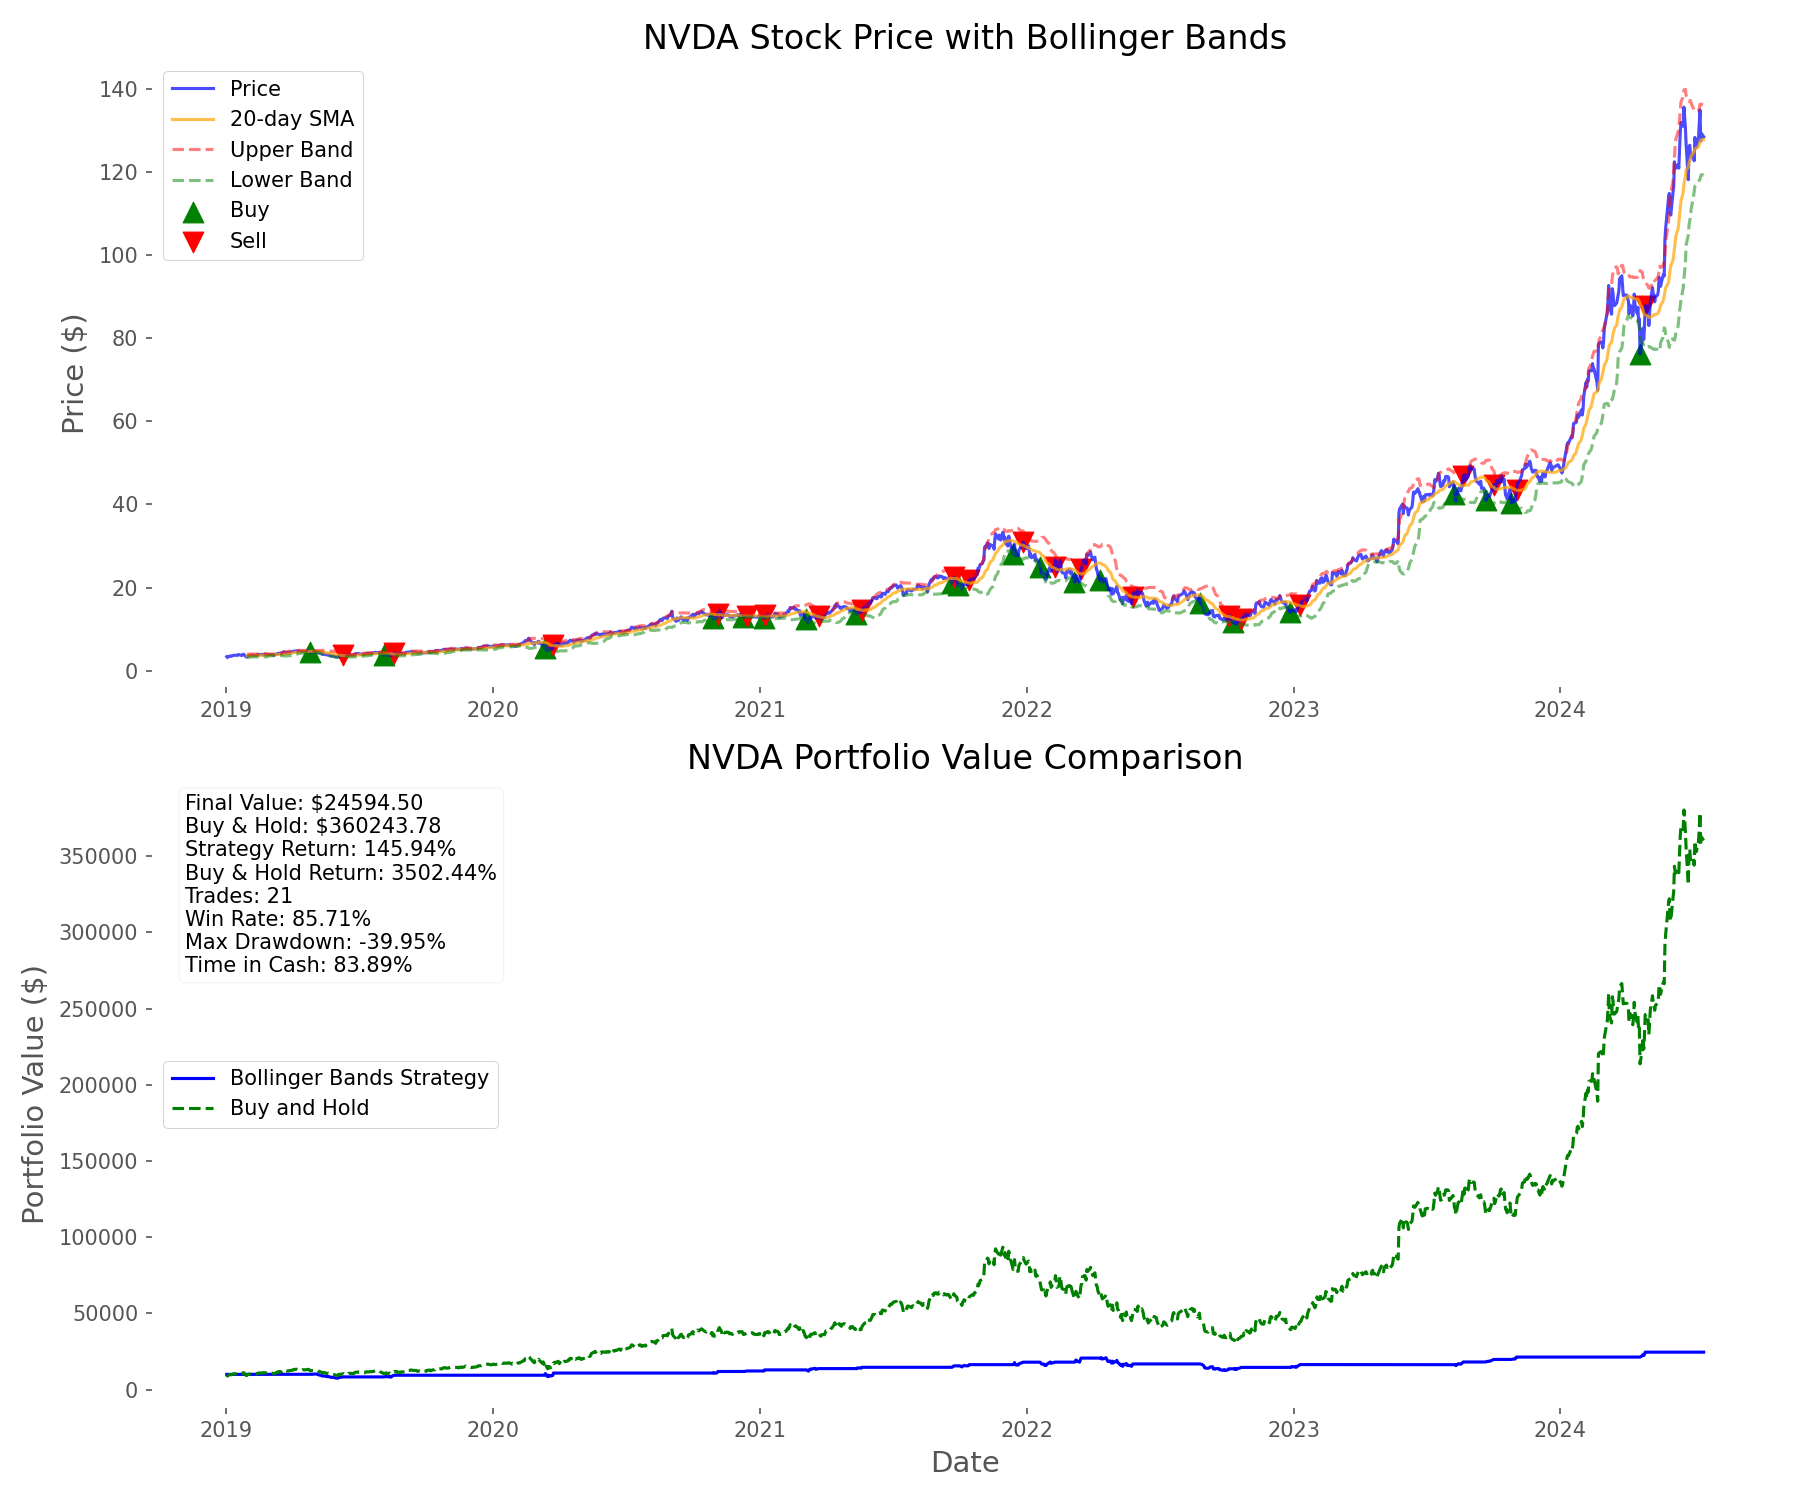
- Buy when price falls below the lower Bollinger Band (SMA - 2*STD)
- Sell all holdings when price rises above the middle band (20-day SMA)
- Only buy full shares (no fractional shares)
- Track daily portfolio value, including cash and stock holdings
For each trading day, we calculated the 20-day SMA and standard deviation to determine the bands. If not holding shares and the price fell below the lower band, we bought as many shares as possible. If holding shares and the price rose above the SMA, we sold everything. This process repeated throughout our 2019-2024 backtest period.
Backtest Results
| Metric | NVDA | TSLA | PLTR |
|---|---|---|---|
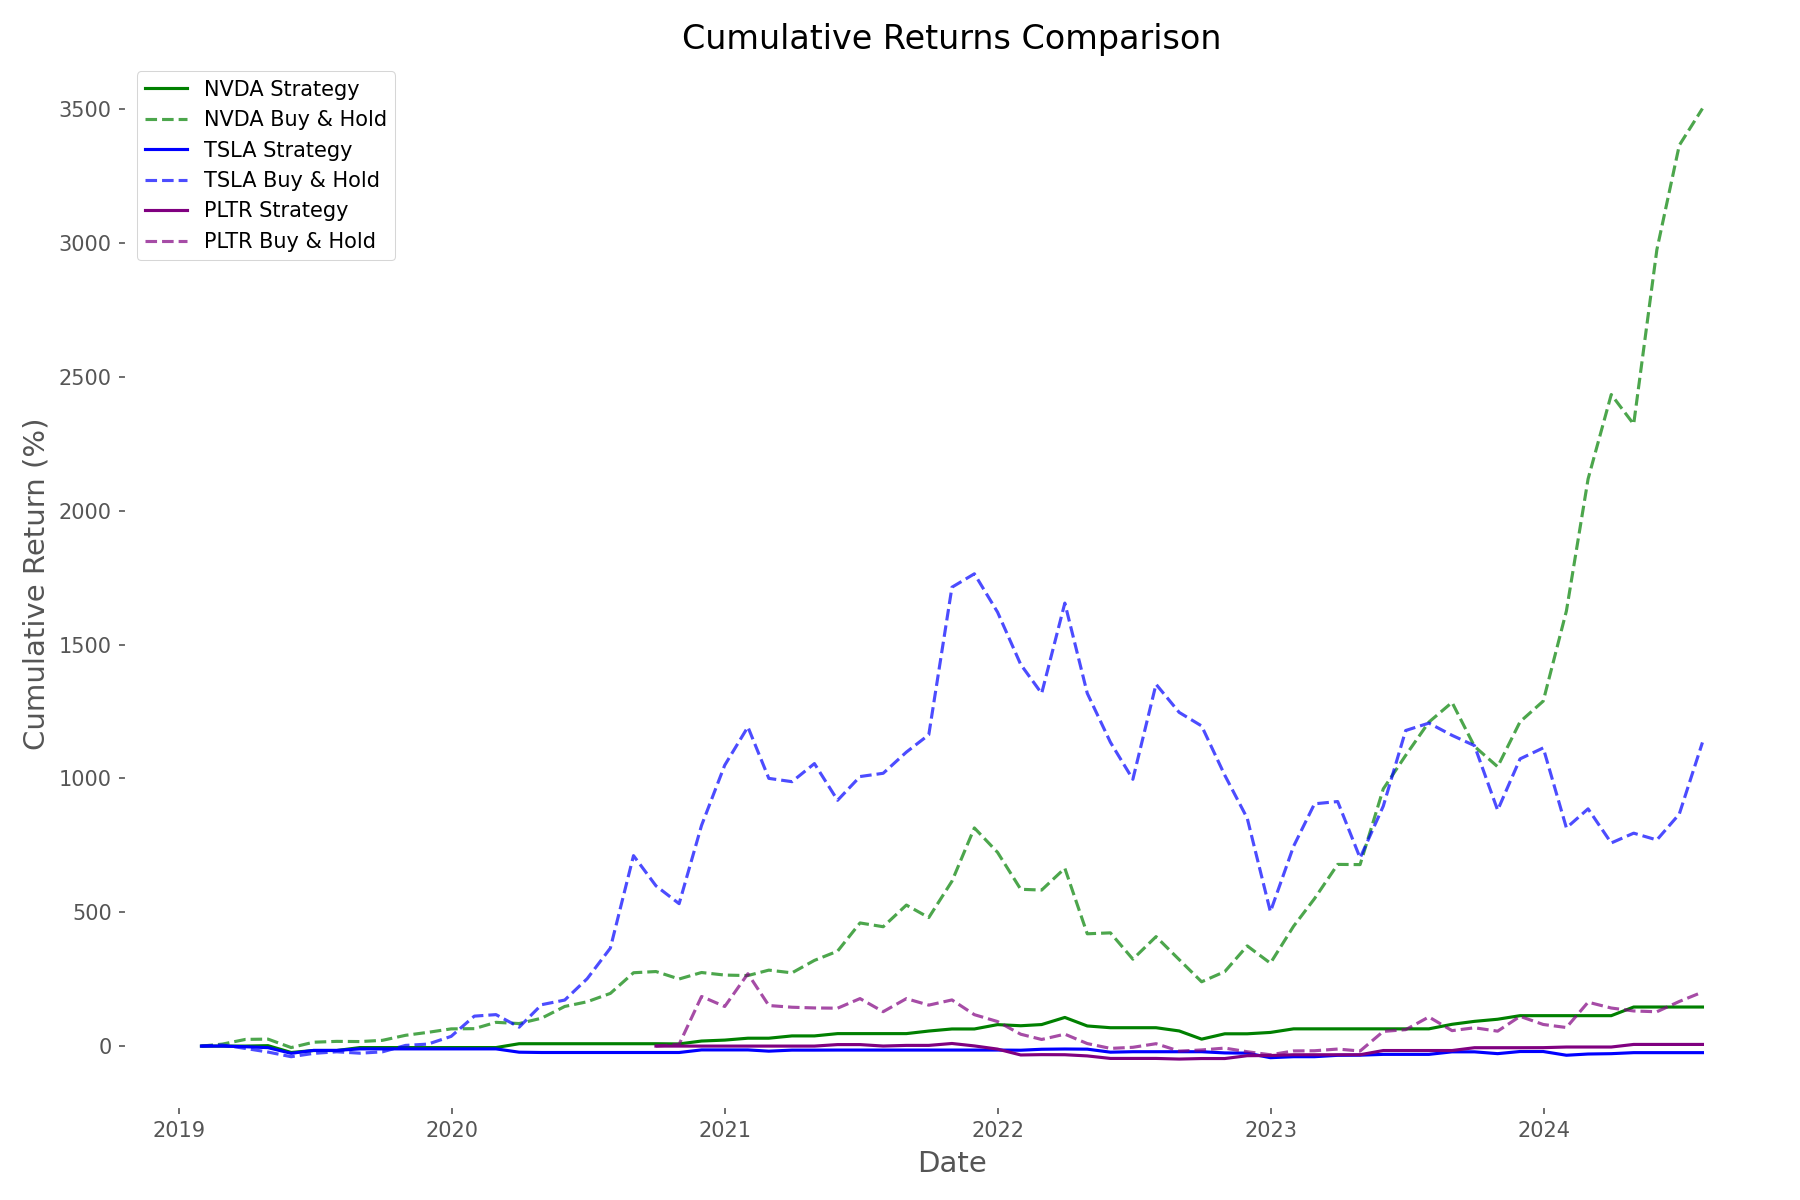
| Strategy Return | 145.94% | -24.48% | 6.19% |
| Buy-and-Hold Return | 3502.44% | 1134.32% | 164.24% |
| Final Portfolio Value | $24,594.50 | $7,551.68 | $10,618.78 |
| Buy-and-Hold Value | $360,243.78 | $123,431.70 | $26,423.96 |
| Win Rate | 85.71% | 50.00% | 69.23% |
| Time in Cash | 83.89% | 77.70% | 75.11% |
Key Findings
The strategy showed impressive win rates, particularly for NVDA (85.71%) and PLTR (69.23%). However, it dramatically underperformed a simple buy-and-hold approach for all three stocks. NVDA's strategy returned 145.94% compared to buy-and-hold's staggering 3502.44%. TSLA's strategy actually lost money (-24.48%) while buy-and-hold would have returned 1134.32%.
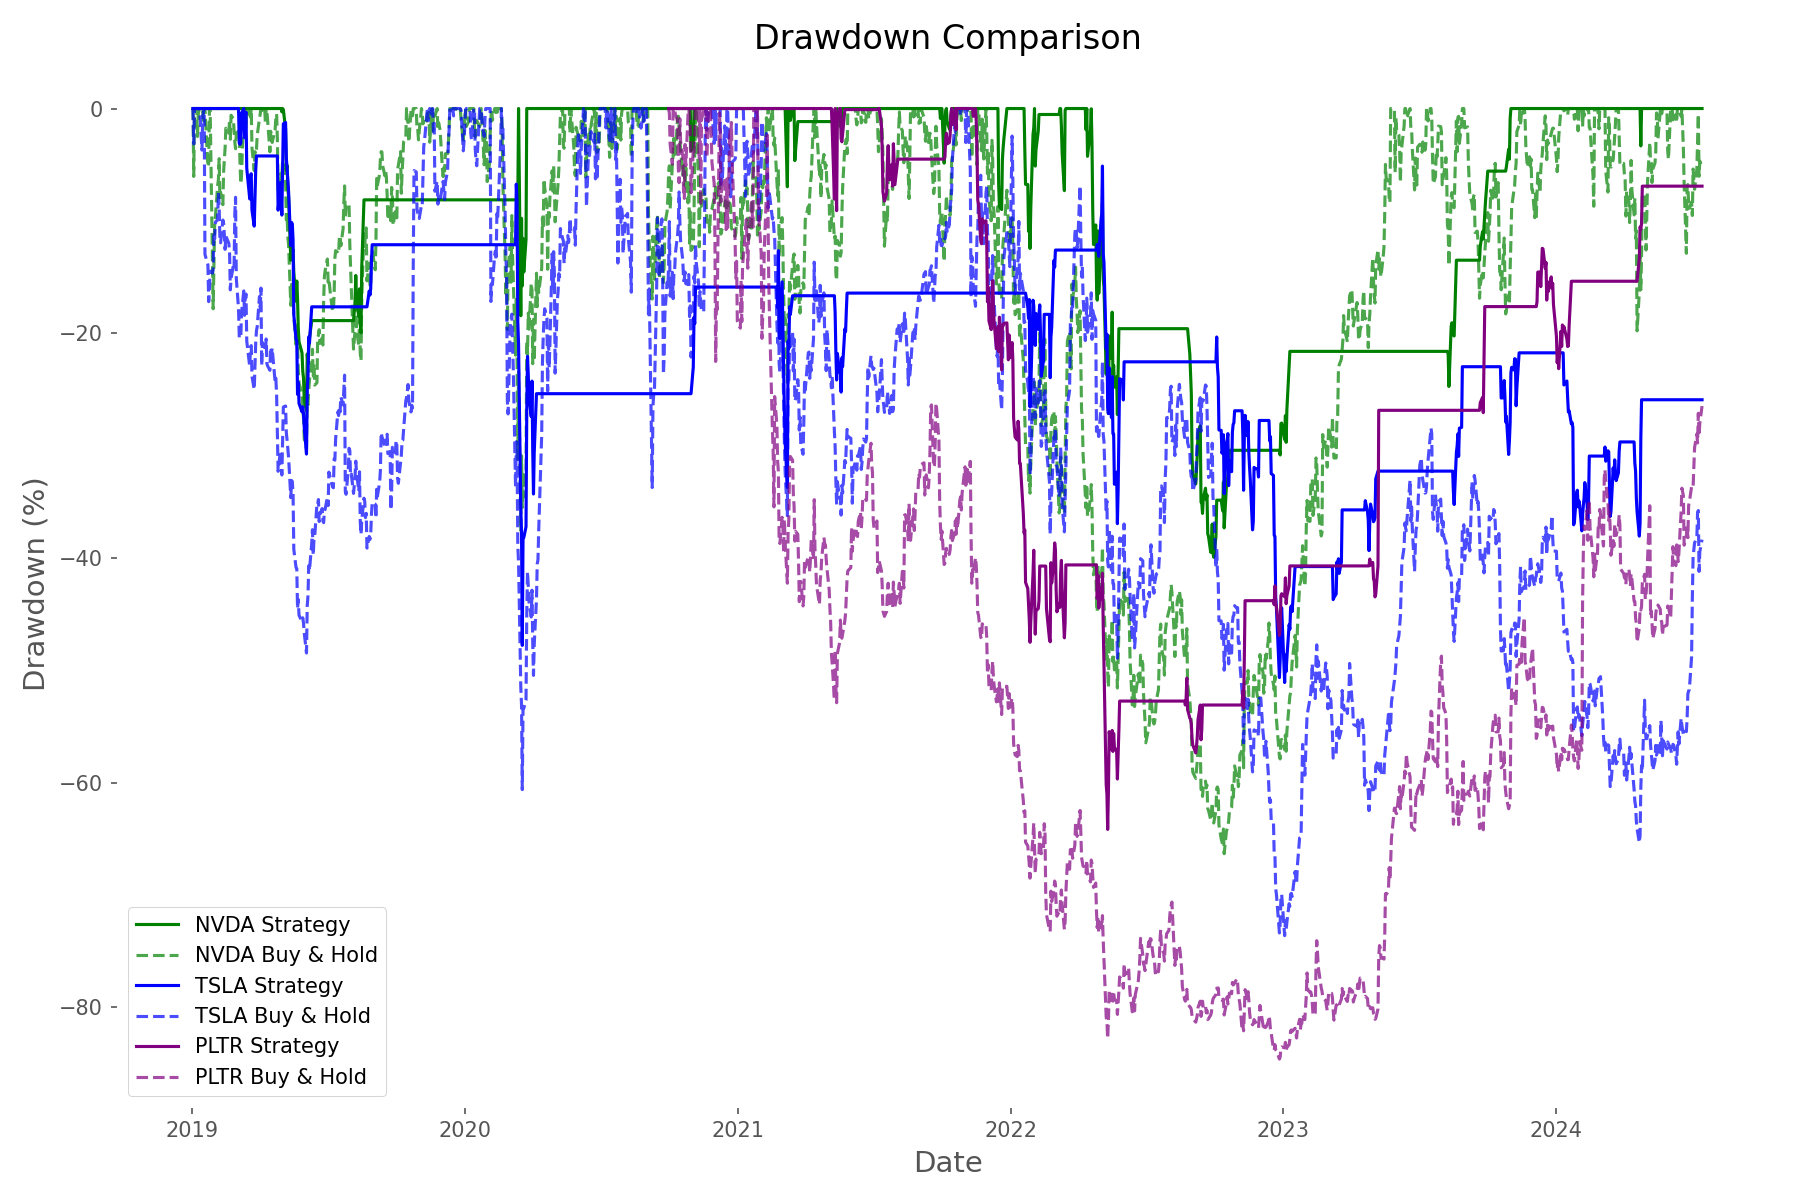
The most revealing statistic was the time spent in cash: 75-84% across all three stocks. This means our strategy was sitting on the sidelines during most of the historic bull runs these tech stocks experienced. While this reduced volatility and drawdowns, it also severely limited returns.
Why Did the Strategy Underperform?
The primary reason was the strong directional trends these tech stocks experienced during our test period. Bollinger Bands work best in range-bound, mean-reverting markets, not in strongly trending ones. When stocks like NVDA and TSLA entered powerful uptrends, our strategy quickly sold after small gains and then remained in cash, missing the bulk of the moves.
Potential Improvements
- Adjust the standard deviation multiplier to optimize entry and exit points
- Implement partial position sizing instead of all-in/all-out trading
- Add trend filters to avoid trading against strong uptrends
- Modify the exit strategy to hold positions longer during bull markets
- Combine Bollinger Bands with other indicators like RSI or volume
Conclusion
Our backtest reveals both the strengths and limitations of Bollinger Bands. While the strategy provided high win rates and some downside protection, it significantly underperformed buy-and-hold by being too conservative and spending too much time in cash during strong uptrends. This doesn't mean Bollinger Bands are useless—they simply need to be applied in the right context or combined with other tools. They might perform better in range-bound markets or as one component of a more comprehensive trading system rather than as a standalone strategy.
Comments (0)
No comments yet. Be the first to comment!