AI Bubble Era: Sector Survival Strategies from the Dotcom Bubble
In March 2000, the Nasdaq hit a record high of 5,048 points. Just 2.5 years later, it plummeted 78%. But not all sectors collapsed equally. Some sectors evaporated by over 80%, while others actually rose.
As AI-themed stocks surge today and tech valuations raise concerns, what can we learn from history? I analyzed real data from 9 major sectors spanning 1997 to 2005.
📊 Analysis Overview
- Period: 1997-2005 (full dotcom bubble cycle: rise → crash → recovery)
- Core Period: March 10, 2000 → October 9, 2002 (bubble crash phase)
- Data: 9 SPDR Sector ETFs + representative stock baskets
- Sectors: Technology, Financials, Health Care, Consumer Staples, Consumer Discretionary, Energy, Industrials, Materials, Utilities
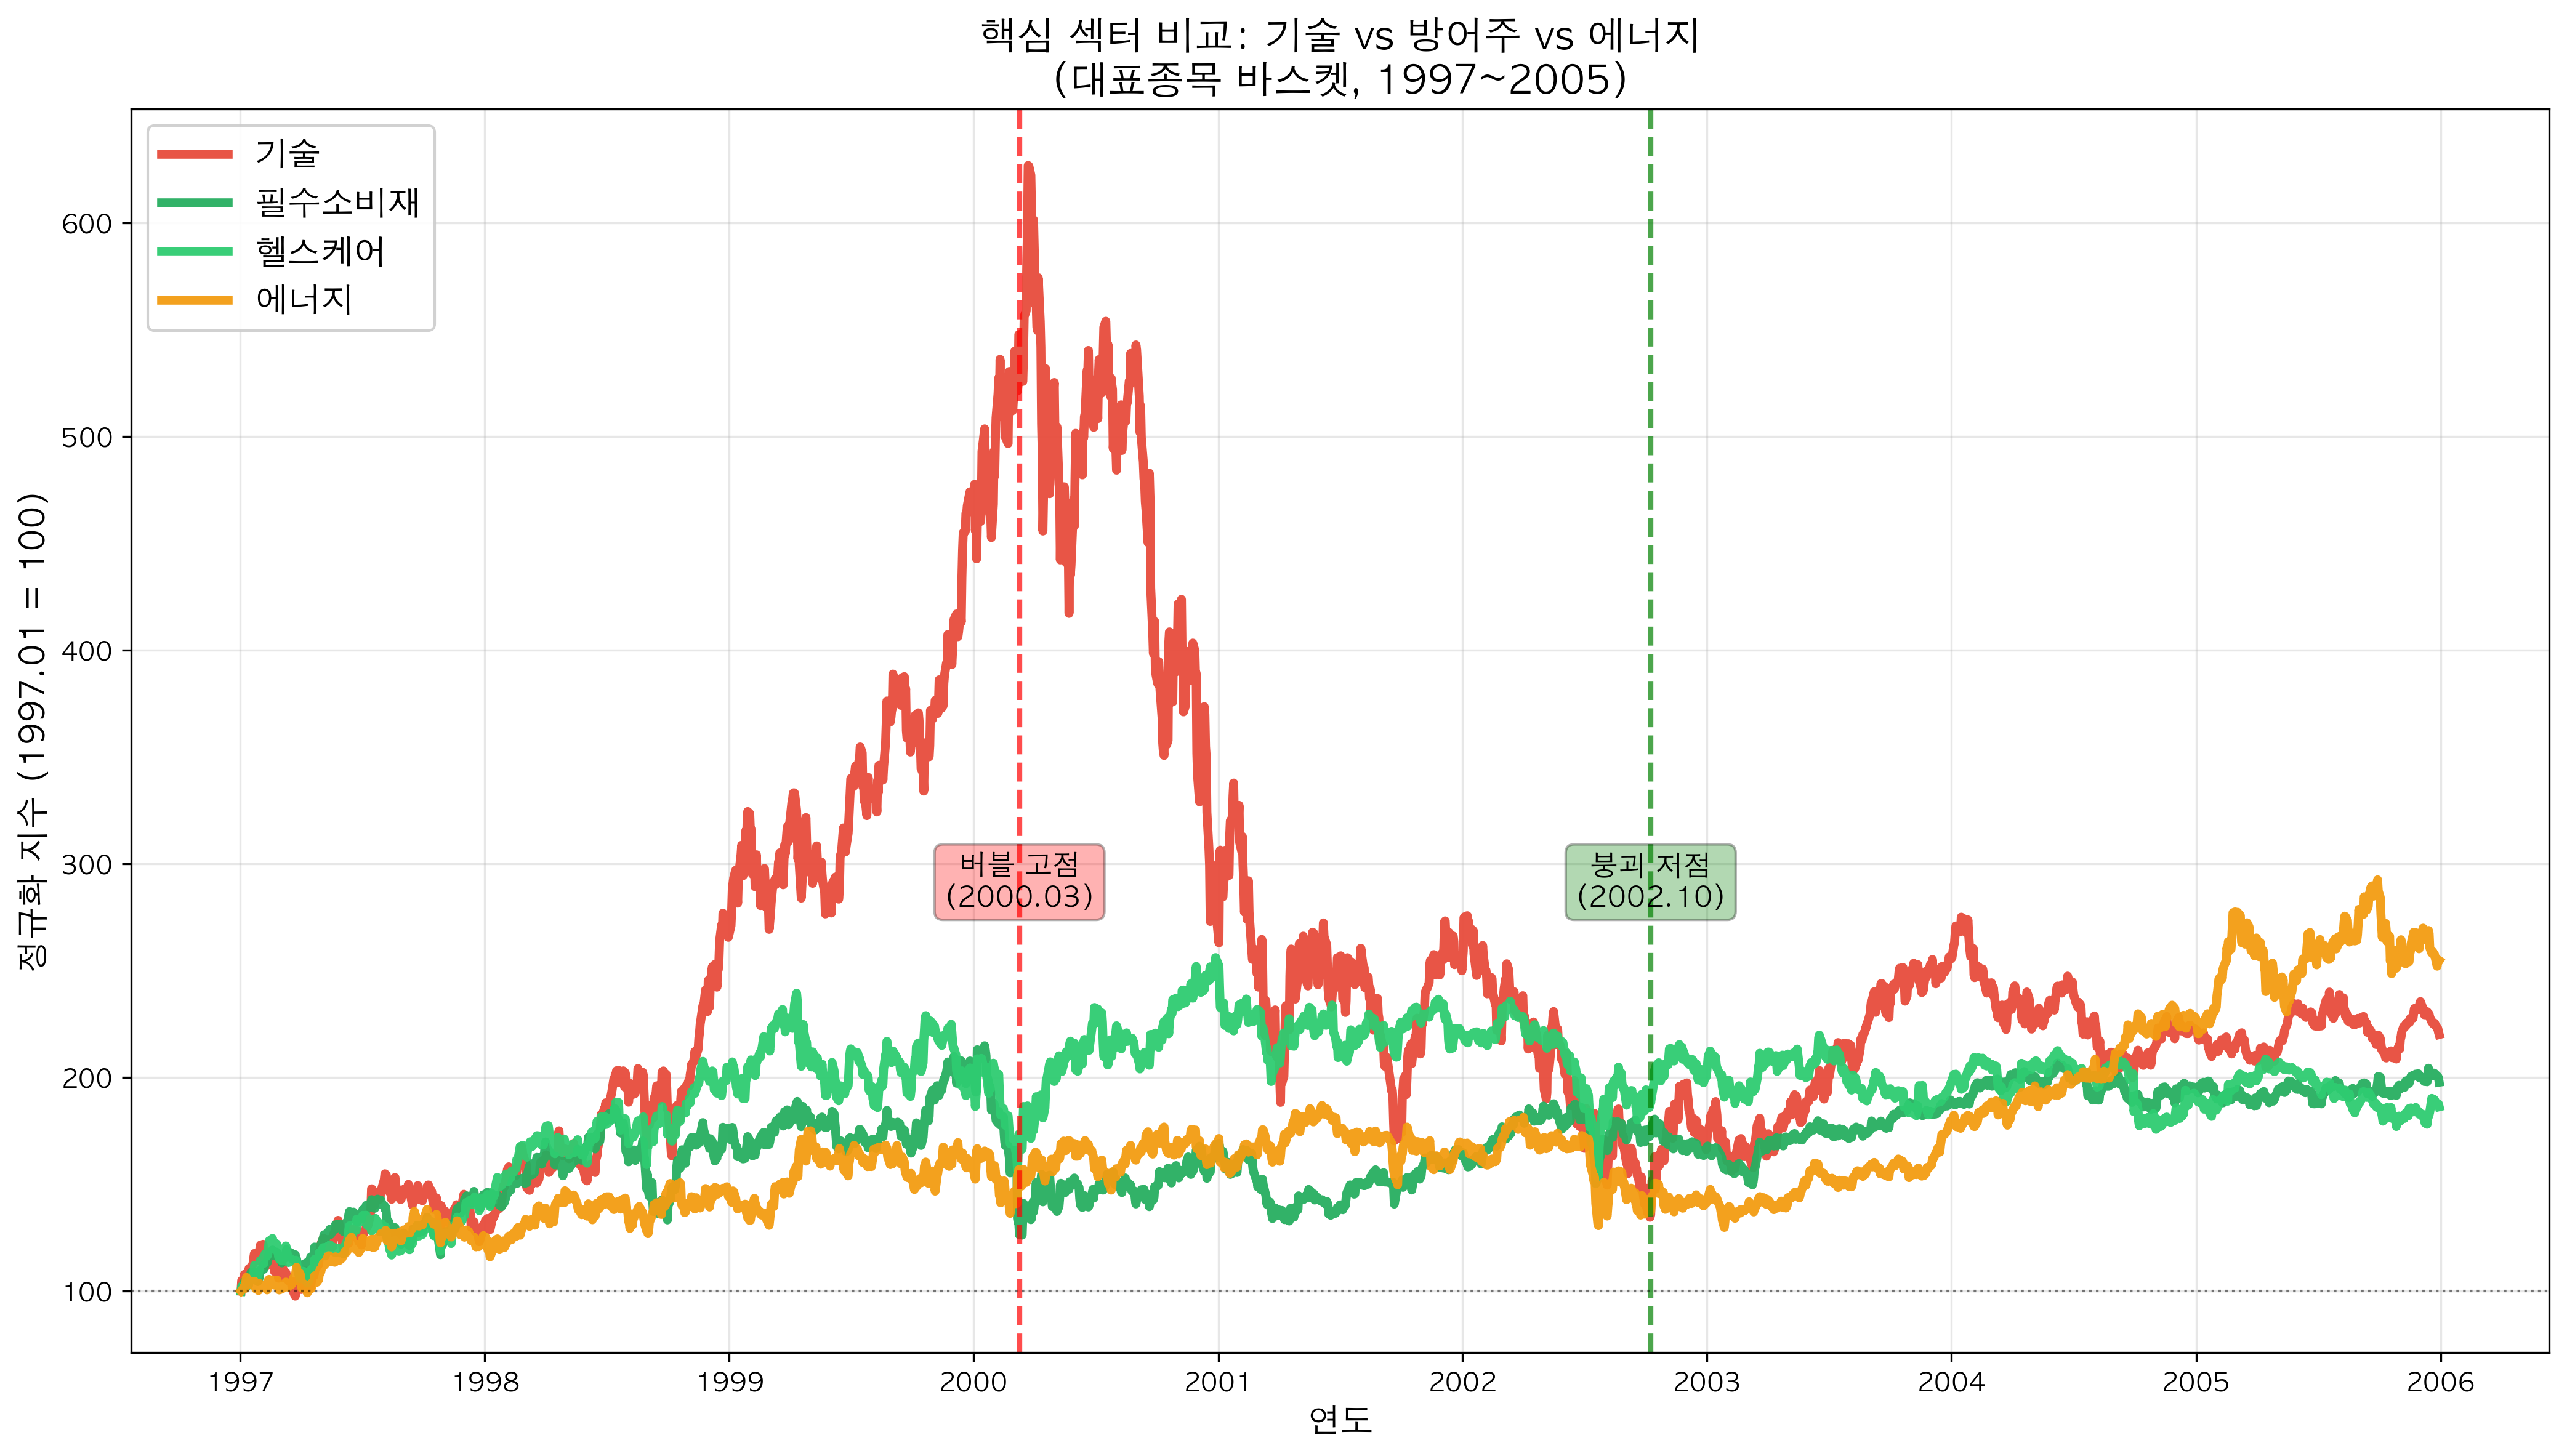 Chart: Key sector trends before and after dotcom bubble — Tech crashed, Consumer Staples rose, Energy strong in recovery
🔥 Sector Report Card: Who Survived and Who Died
1. Technology — Ground Zero of the Disaster
ETF Data:
- Crash period loss: -80.6%
- Maximum drawdown: -82.0%
- Cumulative return by 2005: -32.4%
Representative Stock Basket (Microsoft, Intel, Cisco):
- Crash period loss: -75.2%
- Maximum drawdown: -78.5%
- Cumulative return by 2005: +120.1%
Interpretation: As the epicenter of the bubble, tech stocks took the hardest hit. From the March 2000 peak, the tech ETF soared to 182.79 (normalized index) before crashing to 36.48 in October 2002. That's a devastating 80% plunge.
What's fascinating is that the blue-chip basket (Microsoft, Intel, Cisco) recovered to +120% by 2005, while the ETF remained at -32%. This shows that countless dotcom companies vanished completely.
Lesson: When bubbles burst, even quality stocks drop 80%, but they recover over time. Meanwhile, theme stocks and junk companies never come back.
2. Consumer Staples — Safe Harbor in the Storm
ETF Data:
- Crash period loss: +6.7% (gain!)
- Maximum drawdown: -35.9%
- Cumulative return by 2005: -2.3%
Representative Stock Basket (Coca-Cola, P&G, Walmart):
- Crash period loss: +37.1% (gain!)
- Maximum drawdown: -41.2%
- Cumulative return by 2005: +97.8%
Interpretation: Consumer Staples was the only sector with positive returns during the crash period. People still drink Coca-Cola, buy P&G products, and shop at Walmart even when the economy struggles.
Notably, the blue-chip basket gained a remarkable 37% during the crash. When markets panicked, investors flocked to stable cash flows in consumer staples.
Lesson: When a bubble is suspected, moving assets to consumer staples is effective. This is your choice when capital preservation is the priority.
3. Health Care — Defensive Blue-Chips
ETF Data:
- Crash period loss: -7.1%
- Maximum drawdown: -33.3%
- Cumulative return by 2005: +33.5%
Representative Stock Basket (J&J, Pfizer, Merck):
- Crash period loss: +10.1% (gain!)
- Maximum drawdown: -40.2%
- Cumulative return by 2005: +86.3%
Interpretation: Health Care, along with Consumer Staples, was a top defensive sector. People need hospitals and medicine regardless of economic conditions.
Particularly, the blue-chip basket (J&J, Pfizer, Merck) gained 10% during the crash. While tech stocks plummeted 80%, health care stayed positive.
Lesson: Health Care is a core pillar alongside Consumer Staples when building a defensive portfolio.
4. Financials — Surprisingly Resilient
ETF Data:
- Crash period loss: -3.2%
- Maximum drawdown: -36.6%
- Cumulative return by 2005: +54.1%
Representative Stock Basket (JPMorgan, Bank of America, AmEx):
- Crash period loss: -34.2%
- Maximum drawdown: -49.5%
- Cumulative return by 2005: +158.1%
Interpretation: Since the dotcom bubble was primarily a tech valuation problem, financials took relatively minor damage. The ETF dropped just -3.2% during the crash period.
(Note: The opposite happened in 2008. Financials took the hardest hit during the financial crisis. Safe sectors vary depending on the type of bubble.)
Lesson: Not all crises are equal. Sectors to avoid during a tech bubble differ from those during a financial crisis.
5. Utilities — Data Divergence
ETF Data:
- Crash period loss: -34.4%
- Maximum drawdown: -52.3%
- Cumulative return by 2005: +33.8%
Representative Stock Basket (Duke, Southern, Exelon):
- Crash period loss: +17.1% (gain!)
- Maximum drawdown: -43.3%
- Cumulative return by 2005: +196.4%
Interpretation: Utilities present an interesting case. The ETF fell -34%, but the blue-chip basket rose 17%.
The reason is simple. During the dotcom era, many energy/power-related junk stocks also went public, dragging down the ETF performance. Meanwhile, traditional utility giants like Duke Energy and Southern Company attracted investors with stable dividends.
Lesson: Even in defensive sectors, ETFs and blue-chips can diverge significantly. Individual stock selection matters.
6. Energy — Strong Commodity Recovery
ETF Data:
- Crash period loss: -22.7%
- Maximum drawdown: -41.5%
- Cumulative return by 2005: +142.9%
Representative Stock Basket (Exxon, Chevron):
- Crash period loss: -9.0%
- Maximum drawdown: -30.6%
- Cumulative return by 2005: +154.7%
Interpretation: Energy had no direct connection to the dotcom bubble, so damage was relatively limited. Moreover, China's rapid growth after 2002 drove explosive oil demand, pushing the sector up 140%+ by 2005.
Lesson: Commodities/Energy perform well during economic recovery. They can offer buying opportunities at post-crash lows.
7. Industrials — Cyclical Pain
ETF Data:
- Crash period loss: -28.1%
- Maximum drawdown: -43.5%
- Cumulative return by 2005: +47.7%
Representative Stock Basket (3M, Caterpillar, Honeywell):
- Crash period loss: -10.8%
- Maximum drawdown: -39.3%
- Cumulative return by 2005: +120.3%
Interpretation: As cyclical stocks, industrials suffered during the recession. However, since they weren't as overvalued as tech stocks, the decline was relatively moderate.
Lesson: Avoid cyclical stocks during bubble crashes, but quality names show strong rebounds during recovery.
8. Materials — Moderate Impact
ETF Data:
- Crash period loss: -12.1%
- Maximum drawdown: -37.6%
- Cumulative return by 2005: +70.1%
Representative Stock Basket (DuPont):
- Crash period loss: -16.4%
- Maximum drawdown: -48.4%
- Cumulative return by 2005: +131.8%
Interpretation: Materials were distant from tech stocks, so crash losses were limited. The sector showed strong recovery after 2003 thanks to China's infrastructure boom.
9. Consumer Discretionary — Wobbling with the Economy
ETF Data:
- Crash period loss: -12.6%
- Maximum drawdown: -31.5%
- Cumulative return by 2005: +35.2%
Representative Stock Basket (Home Depot, McDonald's):
- Crash period loss: -52.4%
- Maximum drawdown: -68.0%
- Cumulative return by 2005: +143.5%
Interpretation: Consumer Discretionary performs well in good times and struggles in bad times. The sector suffered during the crash as consumer sentiment weakened, but it wasn't as defensive as Consumer Staples.
Lesson: Consumer Staples is safer than Consumer Discretionary during downturns.
📉 Sector Rankings at a Glance
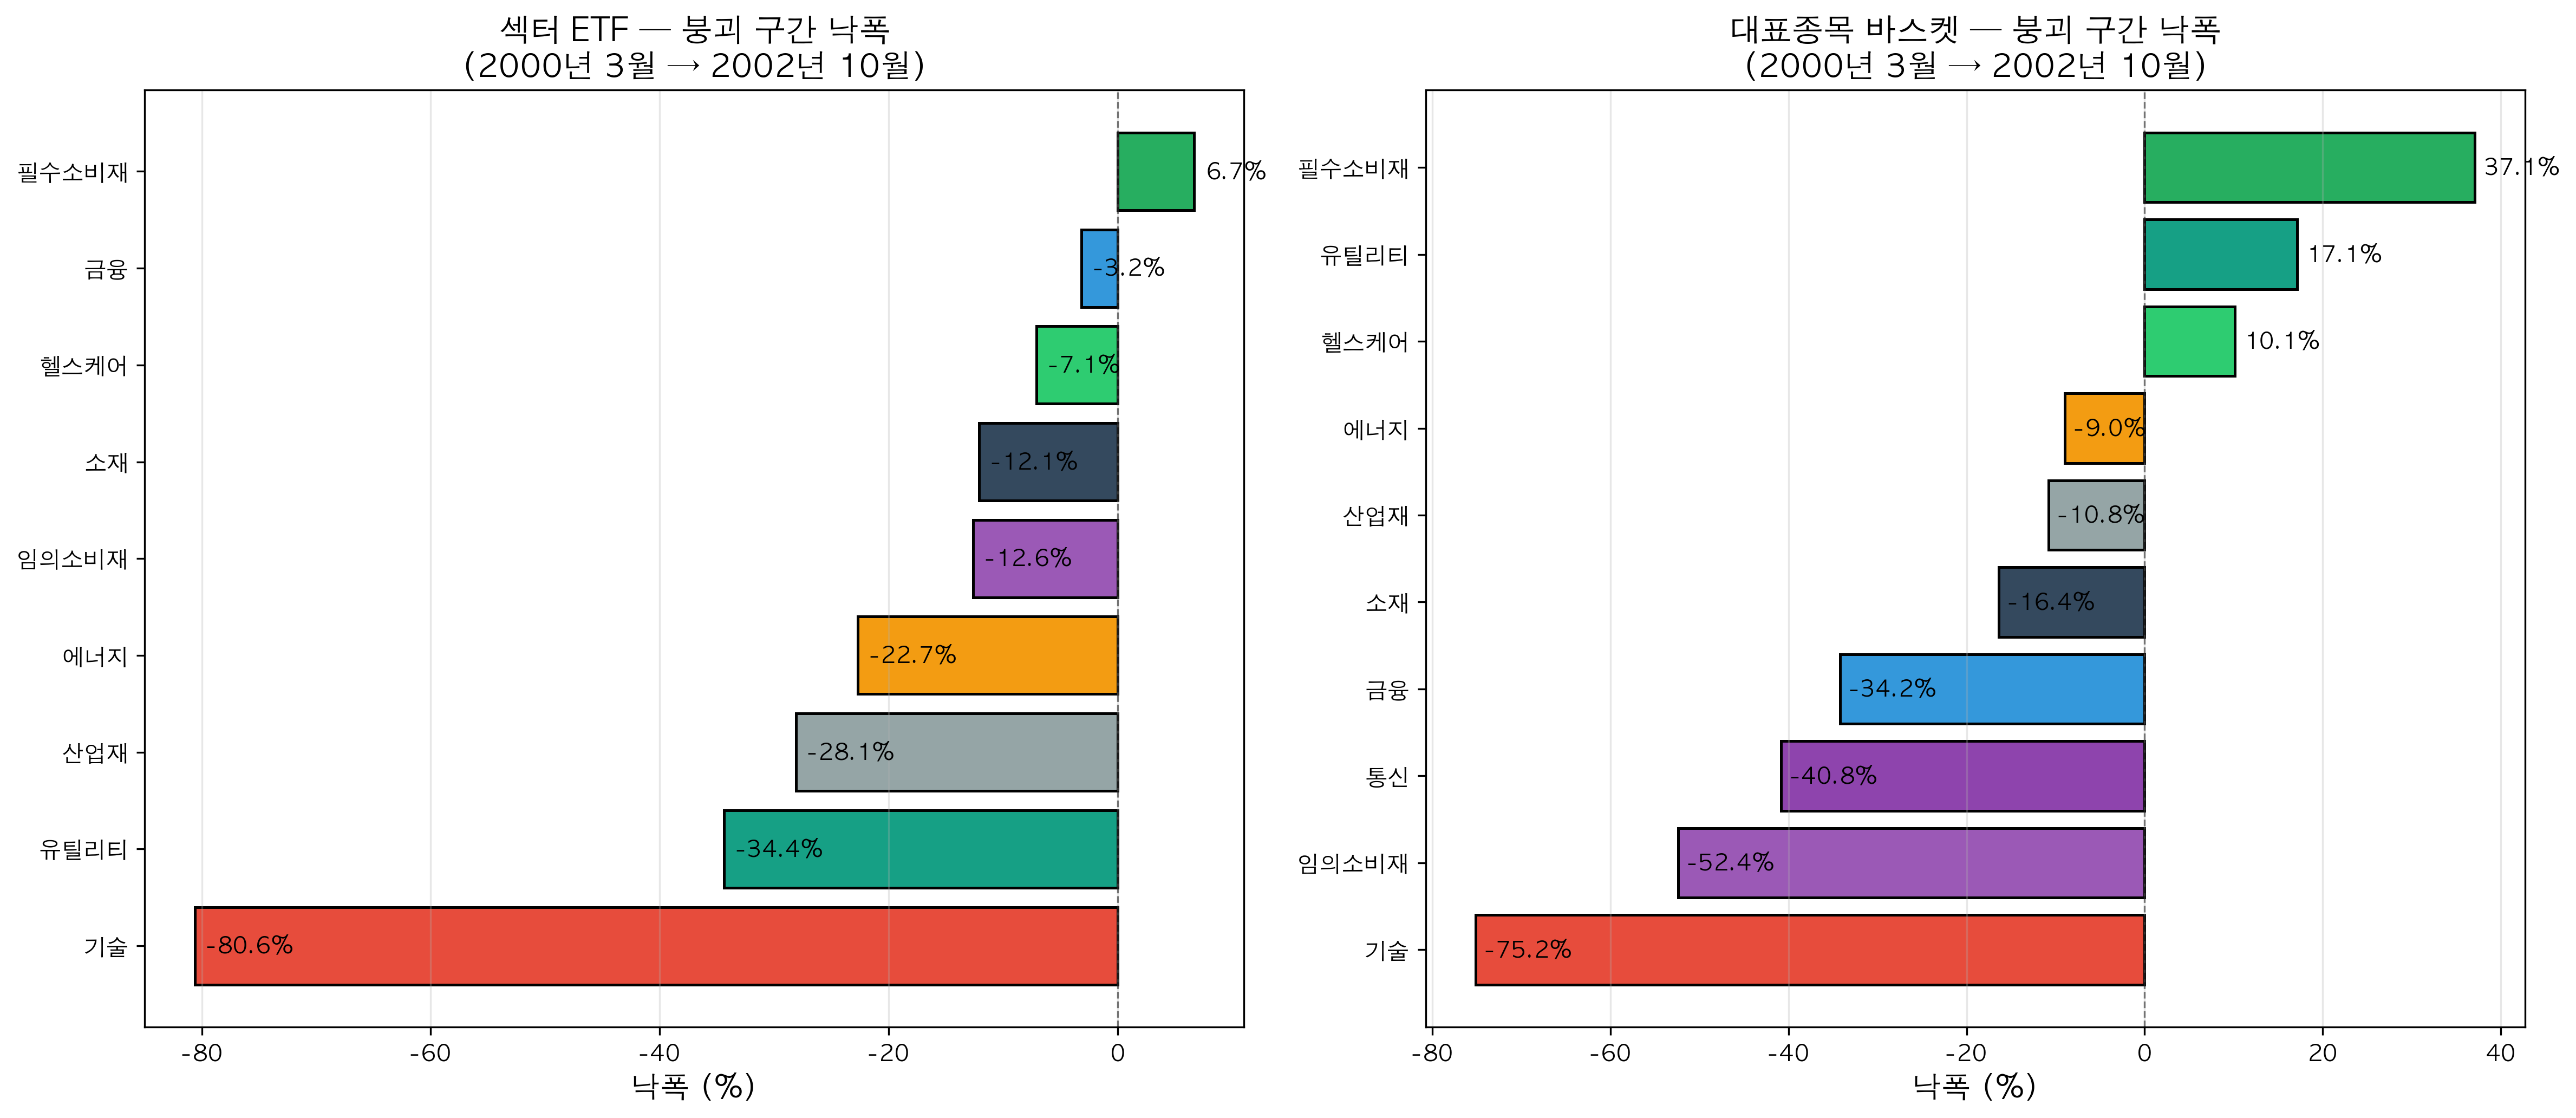 Chart: Sector losses during crash period (March 2000 ~ October 2002). Left: ETF, Right: Stock baskets
Crash Period (Mar 2000 ~ Oct 2002) Loss Rankings (ETF basis)
Least Affected (Defensive):
- Consumer Staples: +6.7% ✅
- Financials: -3.2%
- Health Care: -7.1%
- Materials: -12.1%
- Consumer Discretionary: -12.6%
Middle: 6. Energy: -22.7% 7. Industrials: -28.1% 8. Utilities: -34.4%
Worst: 9. Technology: -80.6% ❌
Full Period (1997~2005) Cumulative Return Rankings (ETF basis)
- Energy: +142.9%
- Materials: +70.1%
- Financials: +54.1%
- Industrials: +47.7%
- Consumer Discretionary: +35.2%
- Utilities: +33.8%
- Health Care: +33.5%
- Consumer Staples: -2.3%
- Technology: -32.4%
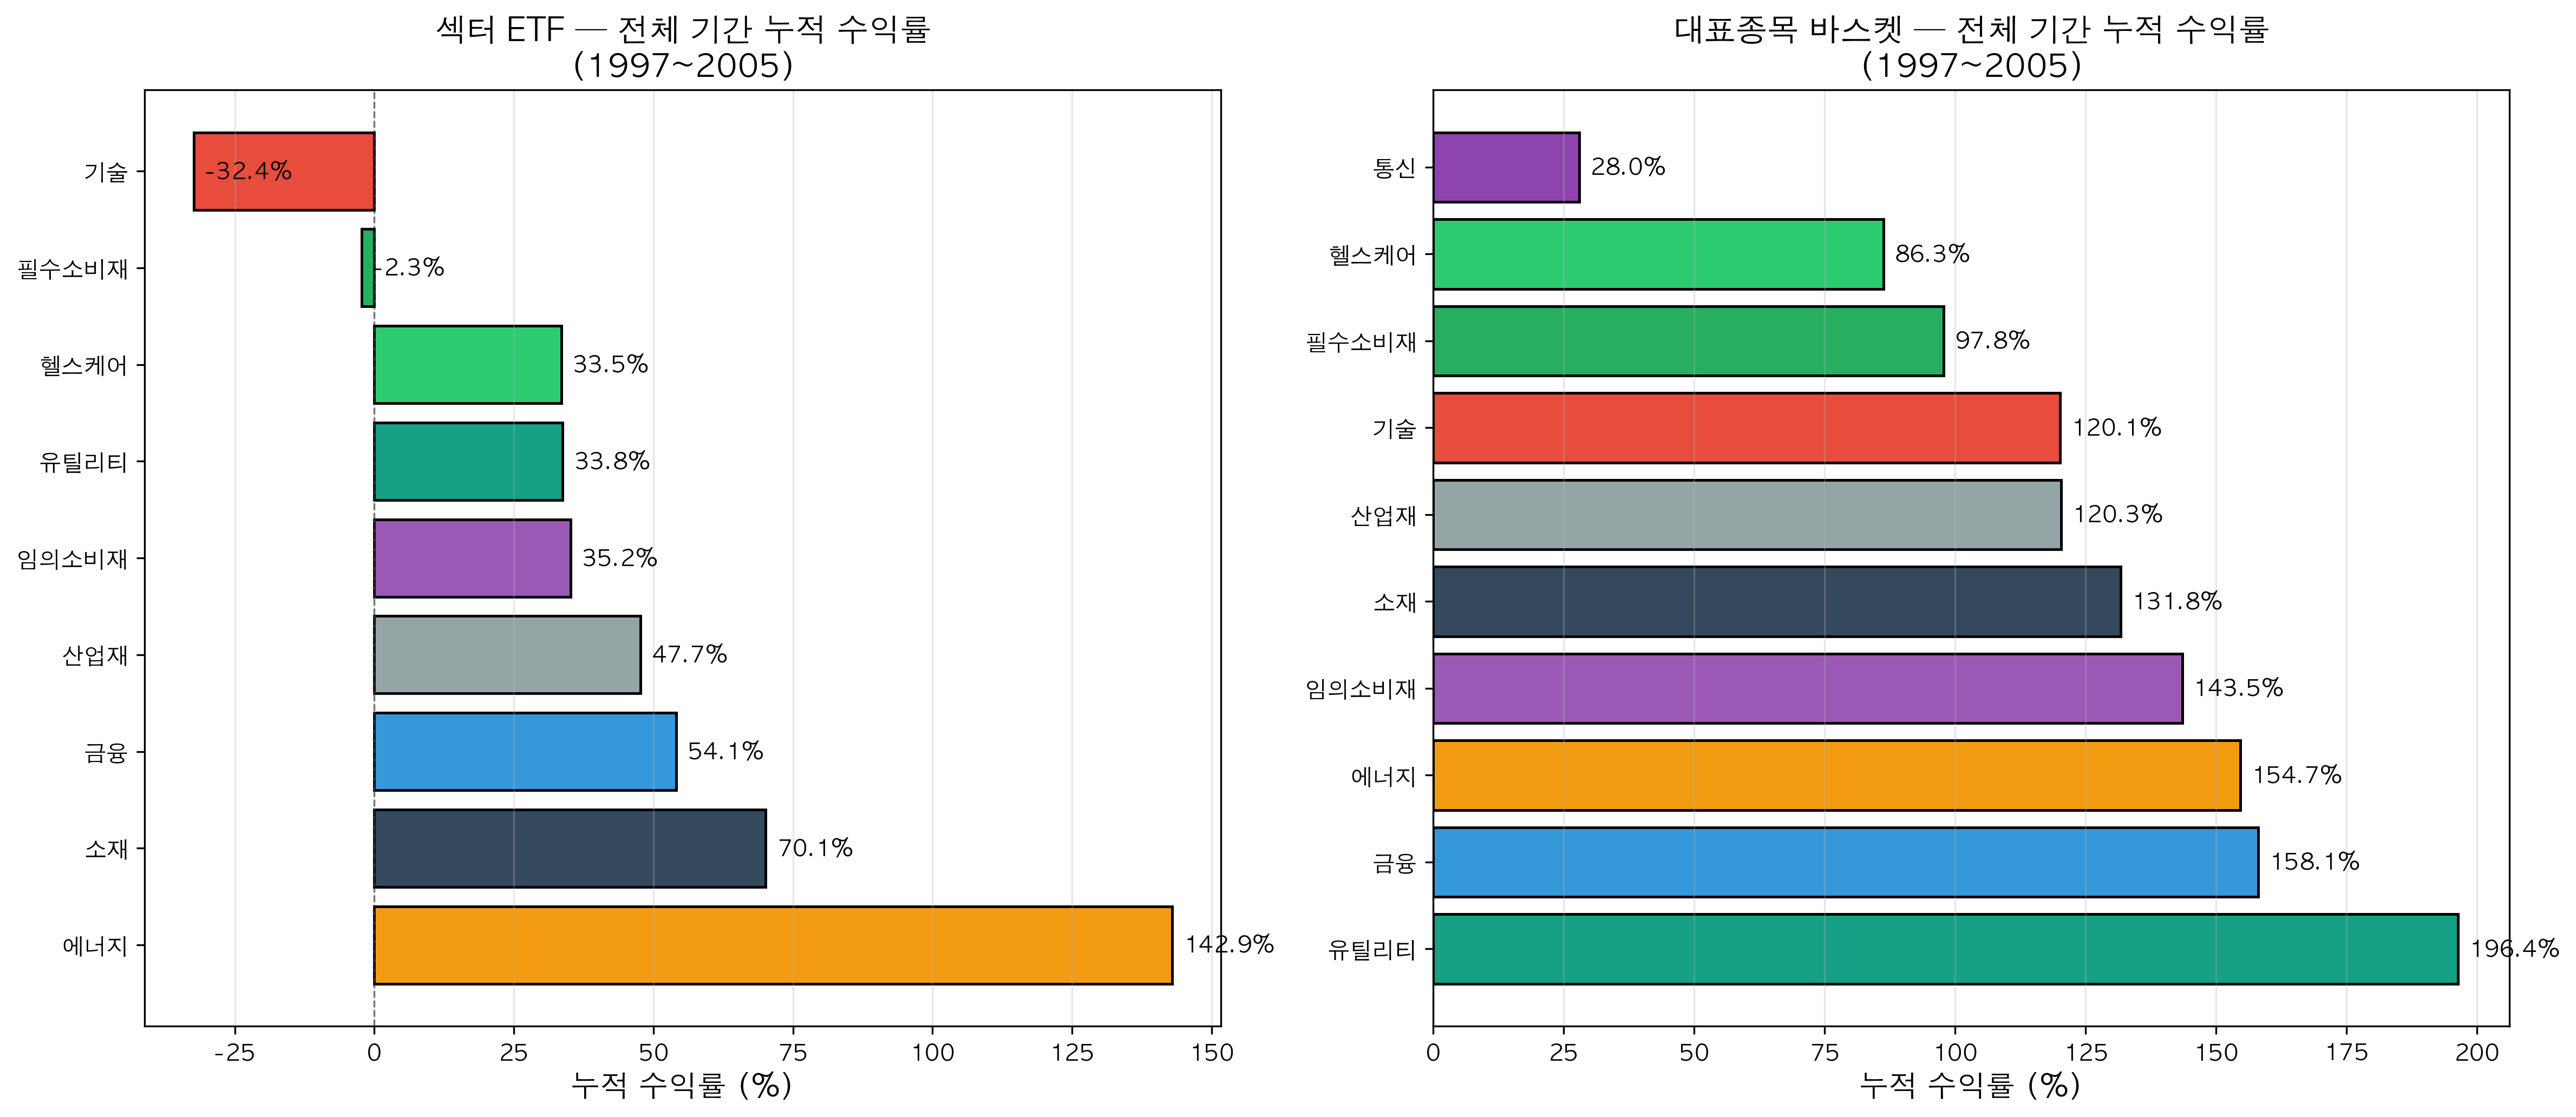 Chart: Cumulative returns for full period 1997~2005 (Left: ETF, Right: Stock baskets)
Insight: Consumer Staples, the safest during the crash, had the lowest long-term returns. Meanwhile, commodity sectors like Energy and Materials delivered the highest returns during recovery.
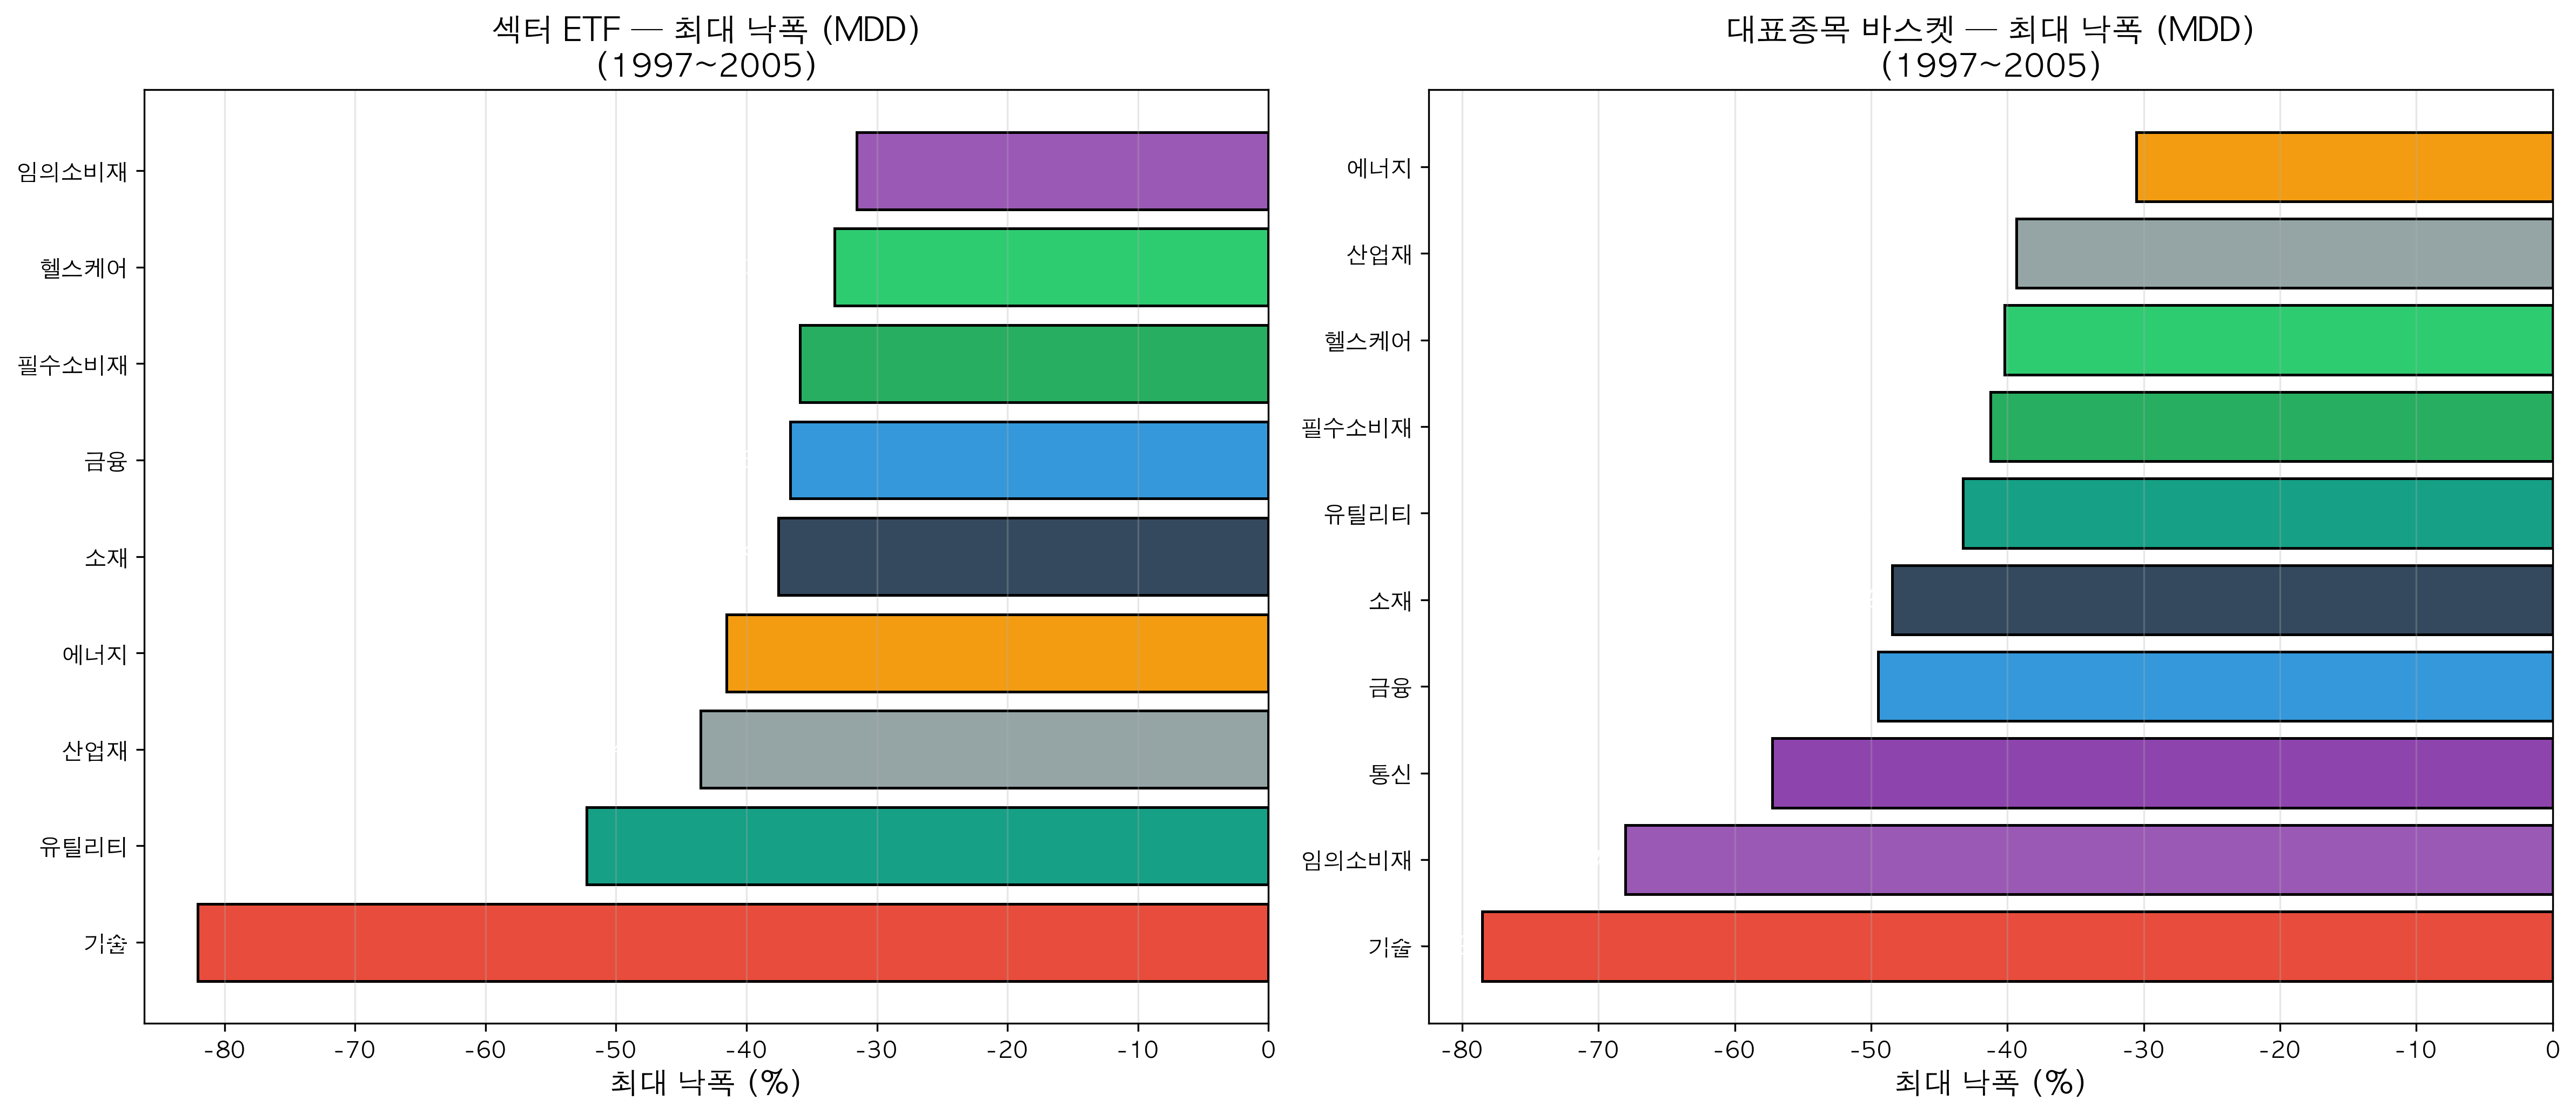 Chart: Maximum drawdown (MDD) comparison across sectors during 1997~2005
💡 Lessons for 2025
1. Bubbles Are Sector-Selective
During the dotcom bubble, tech dropped -80%, but Consumer Staples and Health Care actually rose. The claim that "the whole market crashes" is false. Sector selection determines survival.
2. Defensive Sectors = Consumer Staples + Health Care
Data proves it. During bubble crashes, the safest havens are Consumer Staples and Health Care. Both sectors posted positive returns (blue-chip basket basis) during the crash period.
3. Blue-Chips vs. Junk Stocks
Tech ETFs were still -32% in 2005, but the Microsoft/Intel/Cisco basket recovered to +120%. Even within the same sector, blue-chips and theme stocks have different fates.
4. Post-Crash Recovery Winner = Commodities
Energy and Materials showed moderate losses during the crash but delivered the highest returns during recovery after 2002. If you're targeting buying opportunities at the bottom, watch cyclicals/commodities.
5. Financials Depend on the Crisis Type
Financials were safe during the dotcom bubble but suffered most in the 2008 financial crisis. You must accurately identify the source of the bubble.
6. Time Favors Blue-Chips
Blue-chips like Microsoft and Intel also dropped 75%, but eventually recovered. Meanwhile, countless dotcom companies disappeared. For long-term investors, holding blue-chips is the answer.
🎯 Practical Strategy: What About Your Portfolio Now?
When a Bubble Is Suspected (Now?)
Increase Exposure:
- Consumer Staples (Coca-Cola, P&G, Walmart types)
- Health Care blue-chips (J&J, Pfizer, Merck types)
- Dividend stocks (Utilities, Telecom)
Reduce Exposure:
- Tech stocks with excessive valuations (especially theme stocks)
- Consumer Discretionary (cyclical)
- Industrials (cyclical)
Early Recovery After Crash (After Confirming Bottom)
Aggressive Buying Targets:
- Energy (oil/natural gas)
- Materials (copper, steel, etc.)
- Industrial blue-chips
- Tech blue-chips (at bottom)
Stay Conservative:
- Consumer Staples (low returns during recovery)
- Health Care (defense priority)
📈 Full Sector Trend Charts
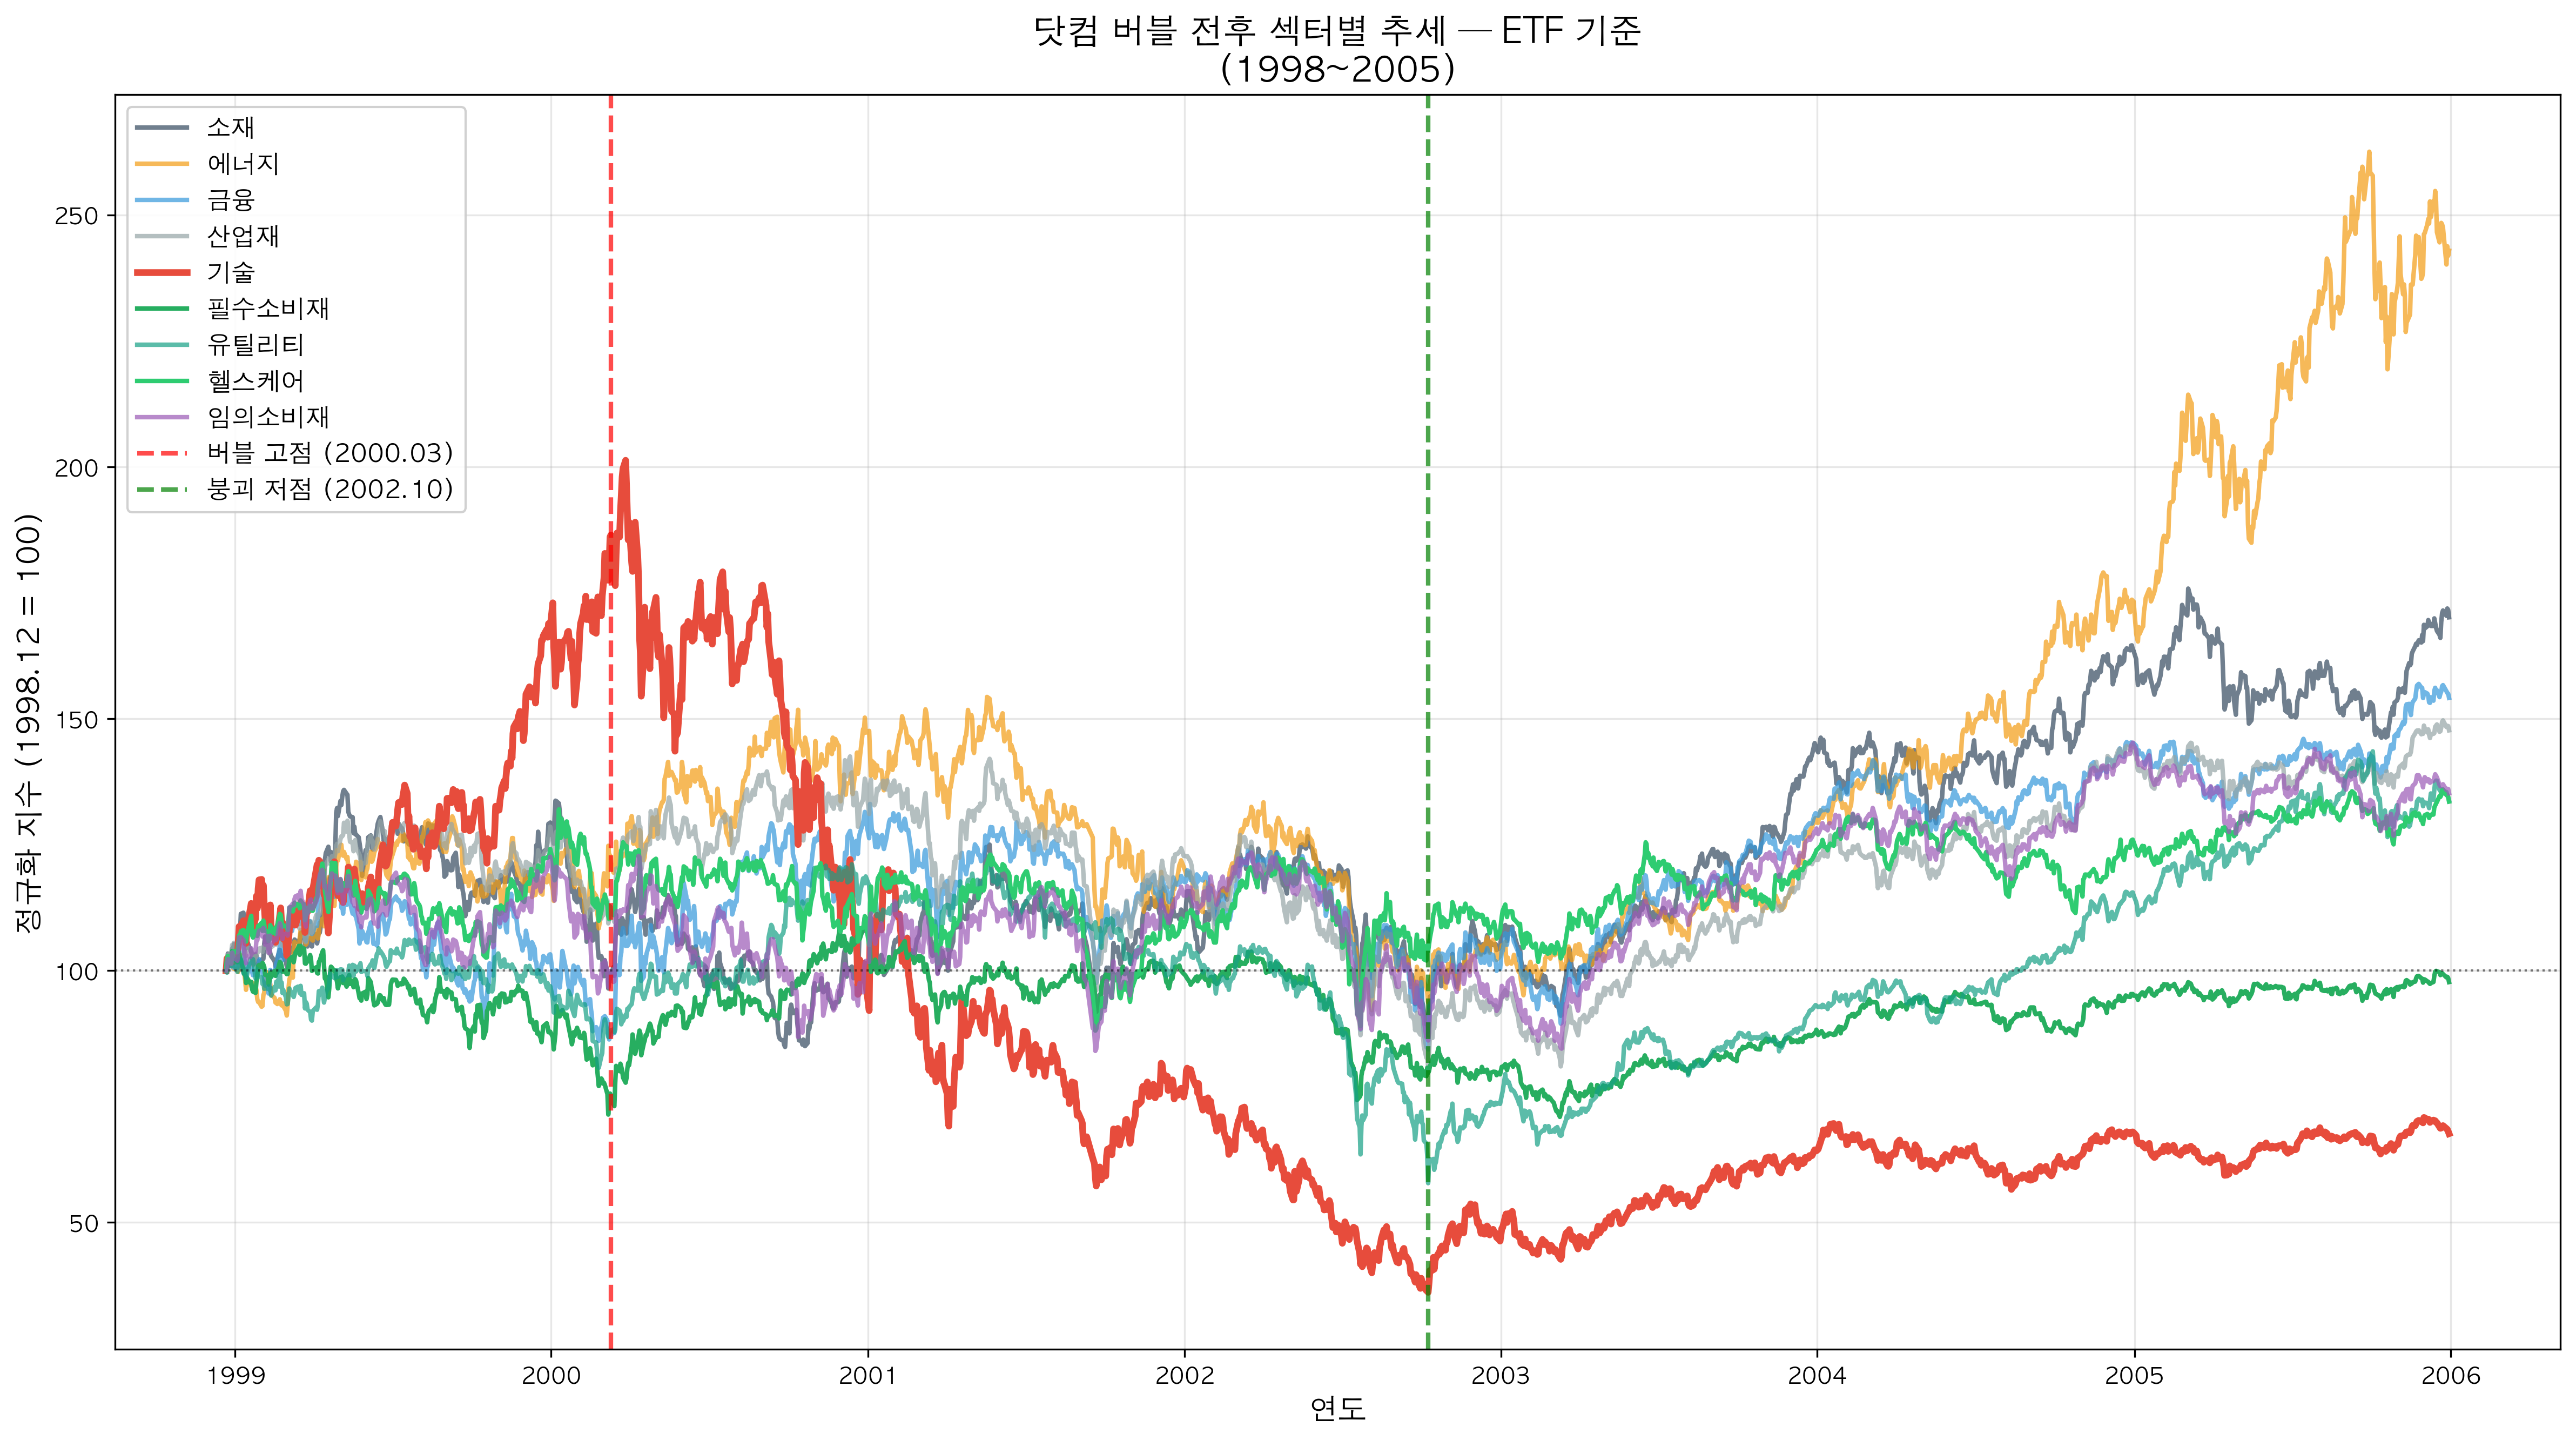 Chart: All sector trends around dotcom bubble — ETF basis (1998~2005)
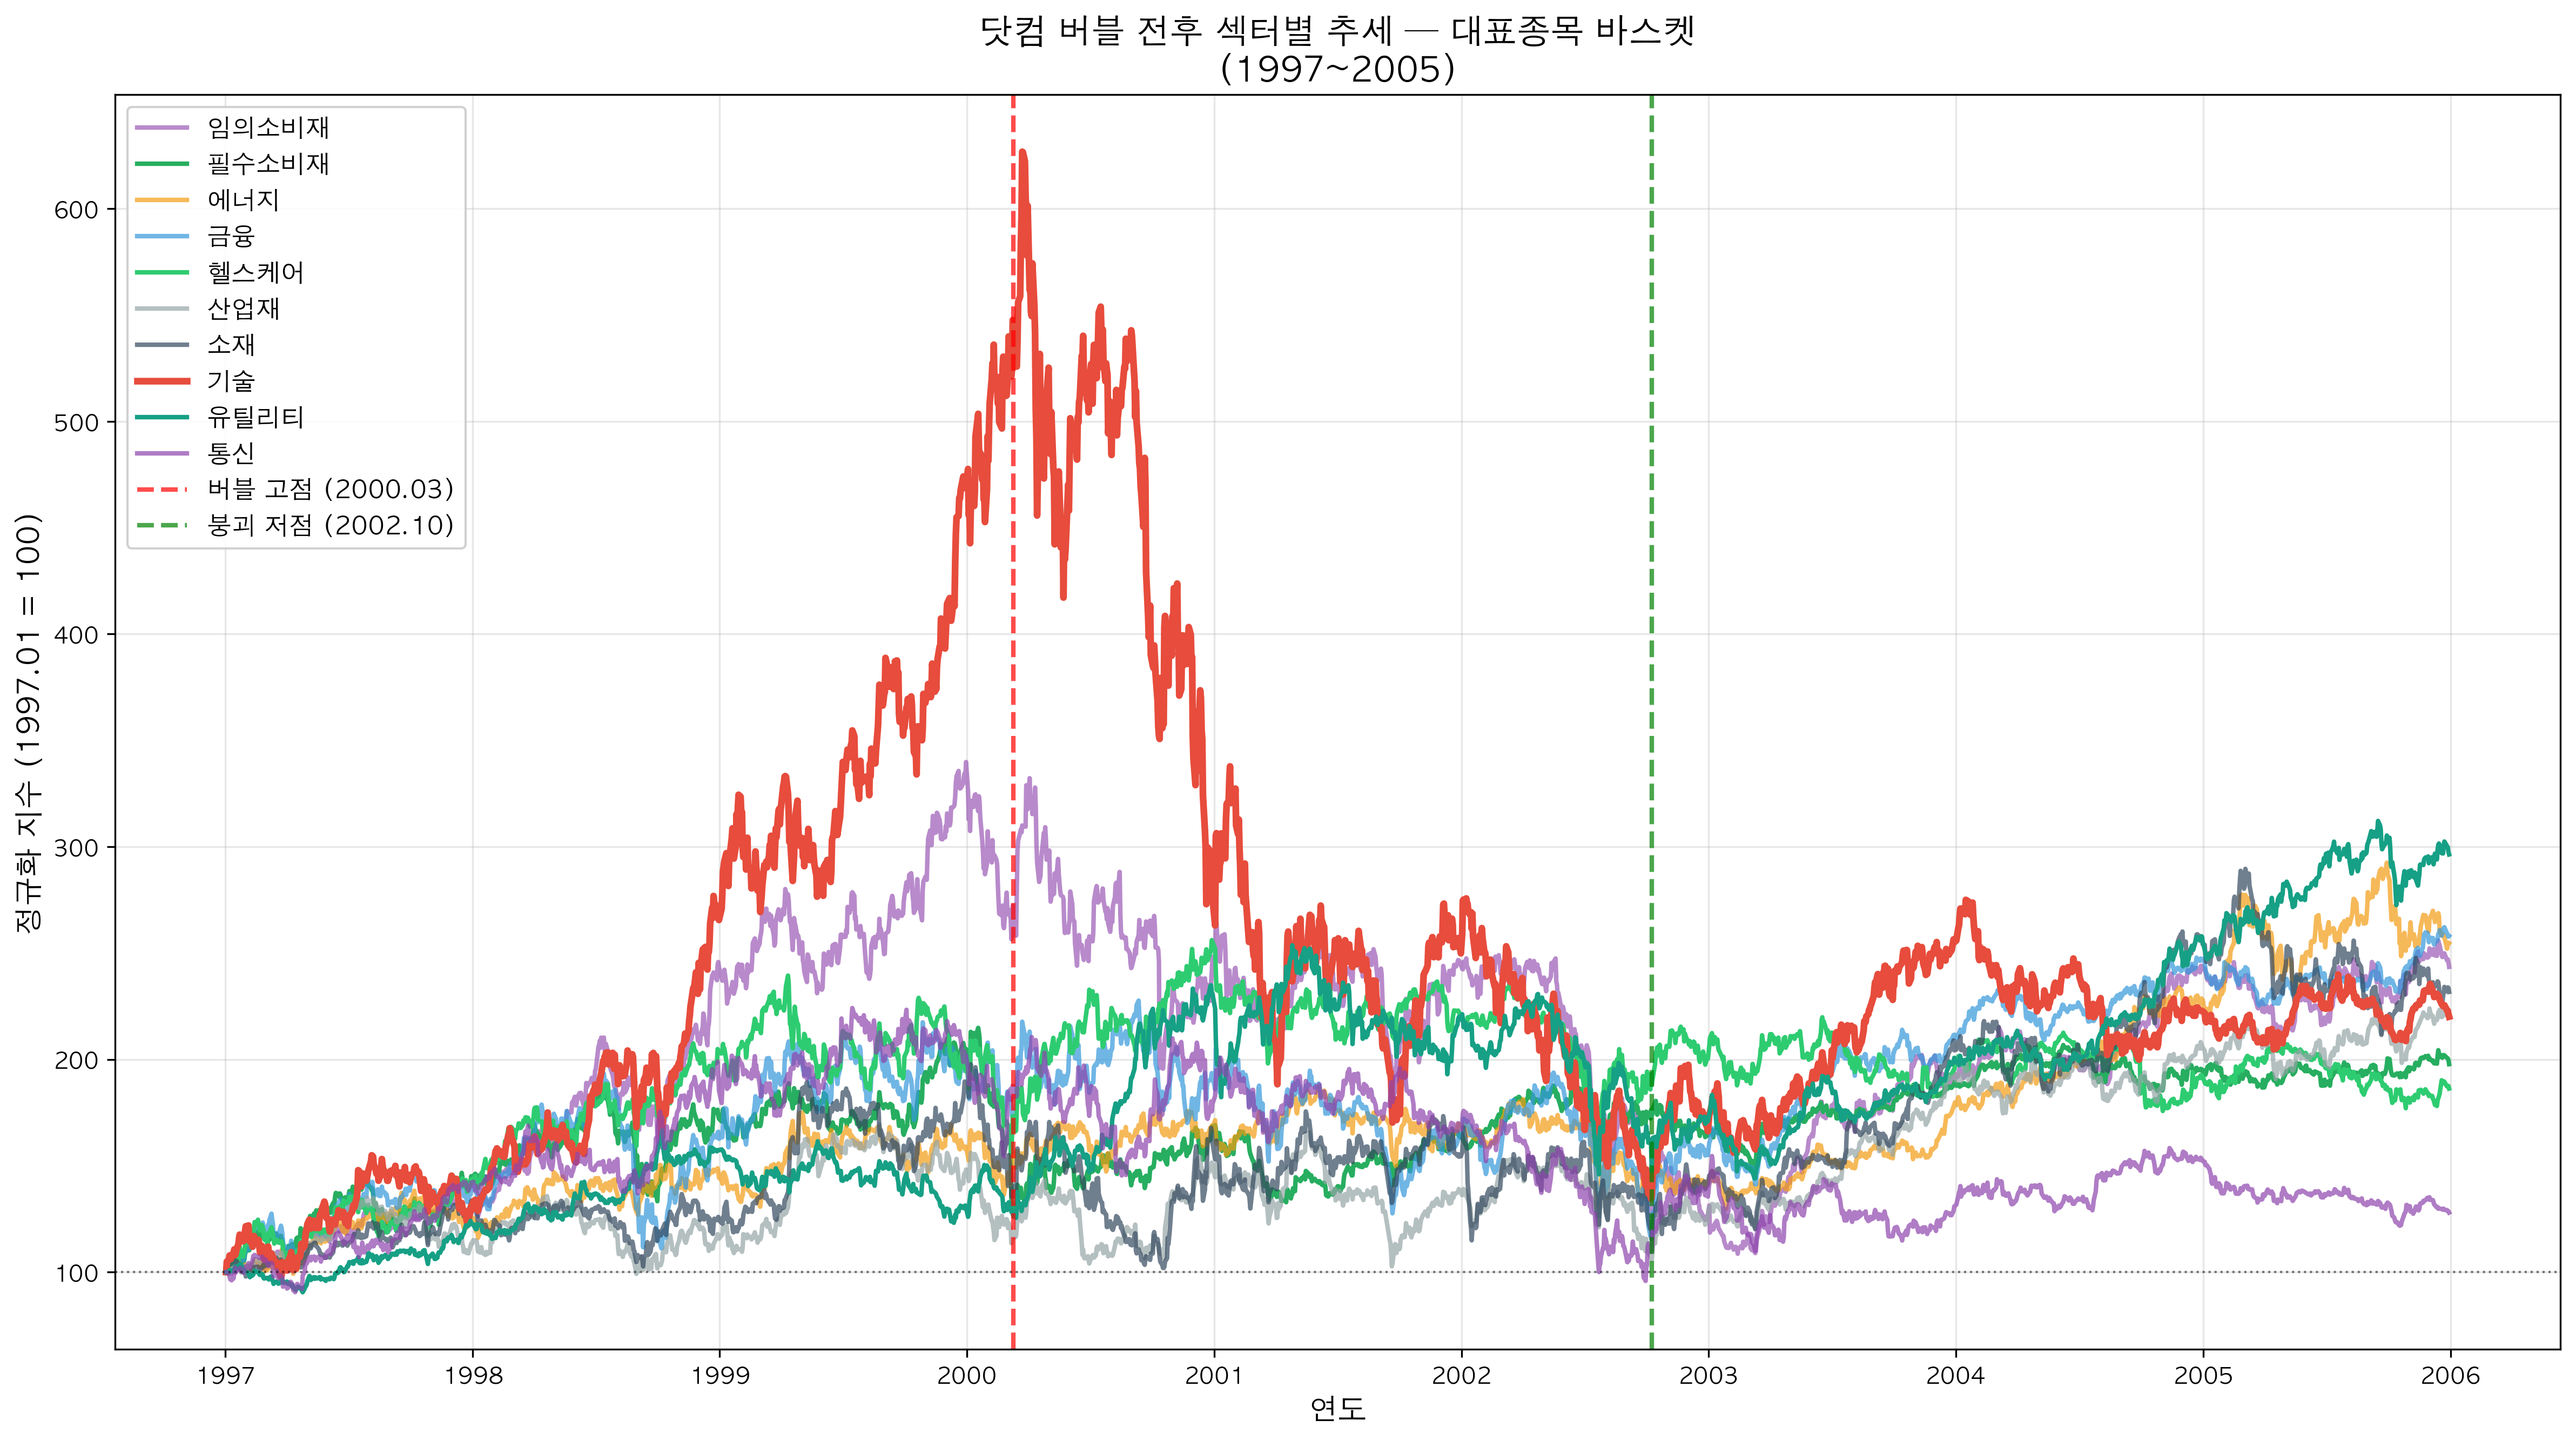 Chart: All sector trends around dotcom bubble — Representative stock baskets (1997~2005)
📌 Conclusion: History Doesn't Repeat, But It Rhymes
The dotcom bubble of 2000 differs from the situation in 2025. Back then, companies like Pets.com went public with no revenue, while today's Big Tech generates massive profits.
But the core bubble mechanism remains the same:
- Excessive valuations
- The belief that "this time is different"
- Sector concentration
- Flight to defensive sectors during corrections
Data doesn't lie. 25 years ago, Consumer Staples and Health Care protected investors during the bubble crash, while tech fell 80%.
Is your portfolio ready to weather the storm?
This analysis is based on 1997-2005 SPDR Sector ETF and representative stock basket data. Investment decisions should be made at your own discretion and responsibility.
Comments (0)
No comments yet. Be the first to comment!