Introduction
Momentum investing is based on a compelling premise: stocks that have performed well recently tend to continue performing well in the near term. This phenomenon has fascinated investors for decades, as it challenges the efficient market hypothesis and suggests that price trends contain valuable information. Rather than relying on assumptions or anecdotal evidence, we've conducted a comprehensive analysis to test whether momentum truly holds up through rigorous historical testing using S&P 500 data from 2015 to 2025.
Our goal was to determine which specific configuration of momentum parameters works best. Does a 3-month lookback period outperform a 12-month one? Is it better to hold positions for 1 month or 3 months? Should we skip the most recent month to avoid short-term reversals? And what percentage of top performers should we select? These questions guided our systematic investigation.
Methodology
We analyzed monthly closing prices for 480 S&P 500 stocks over a decade, testing 32 different momentum strategy configurations. Our step-by-step approach was as follows:
- Step 1: For each month, calculate the return over the lookback period (3, 6, 9, or 12 months) for every stock
- Step 2: Rank all stocks based on their past performance during the lookback period
- Step 3: Select the top performers (either top 10% or top 20%) for the portfolio
- Step 4: Hold these stocks for the specified period (1 or 3 months)
- Step 5: Calculate comprehensive performance metrics including total return, annualized return, volatility, Sharpe ratio, maximum drawdown, and win rate
We tested all combinations of the following parameters to identify the optimal configuration:
- Lookback periods: 3, 6, 9, and 12 months
- Holding periods: 1 and 3 months
- Skip month options: With and without skipping the most recent month
- Selection criteria: Top 10% and top 20% of performers
Results: Best Performing Strategy
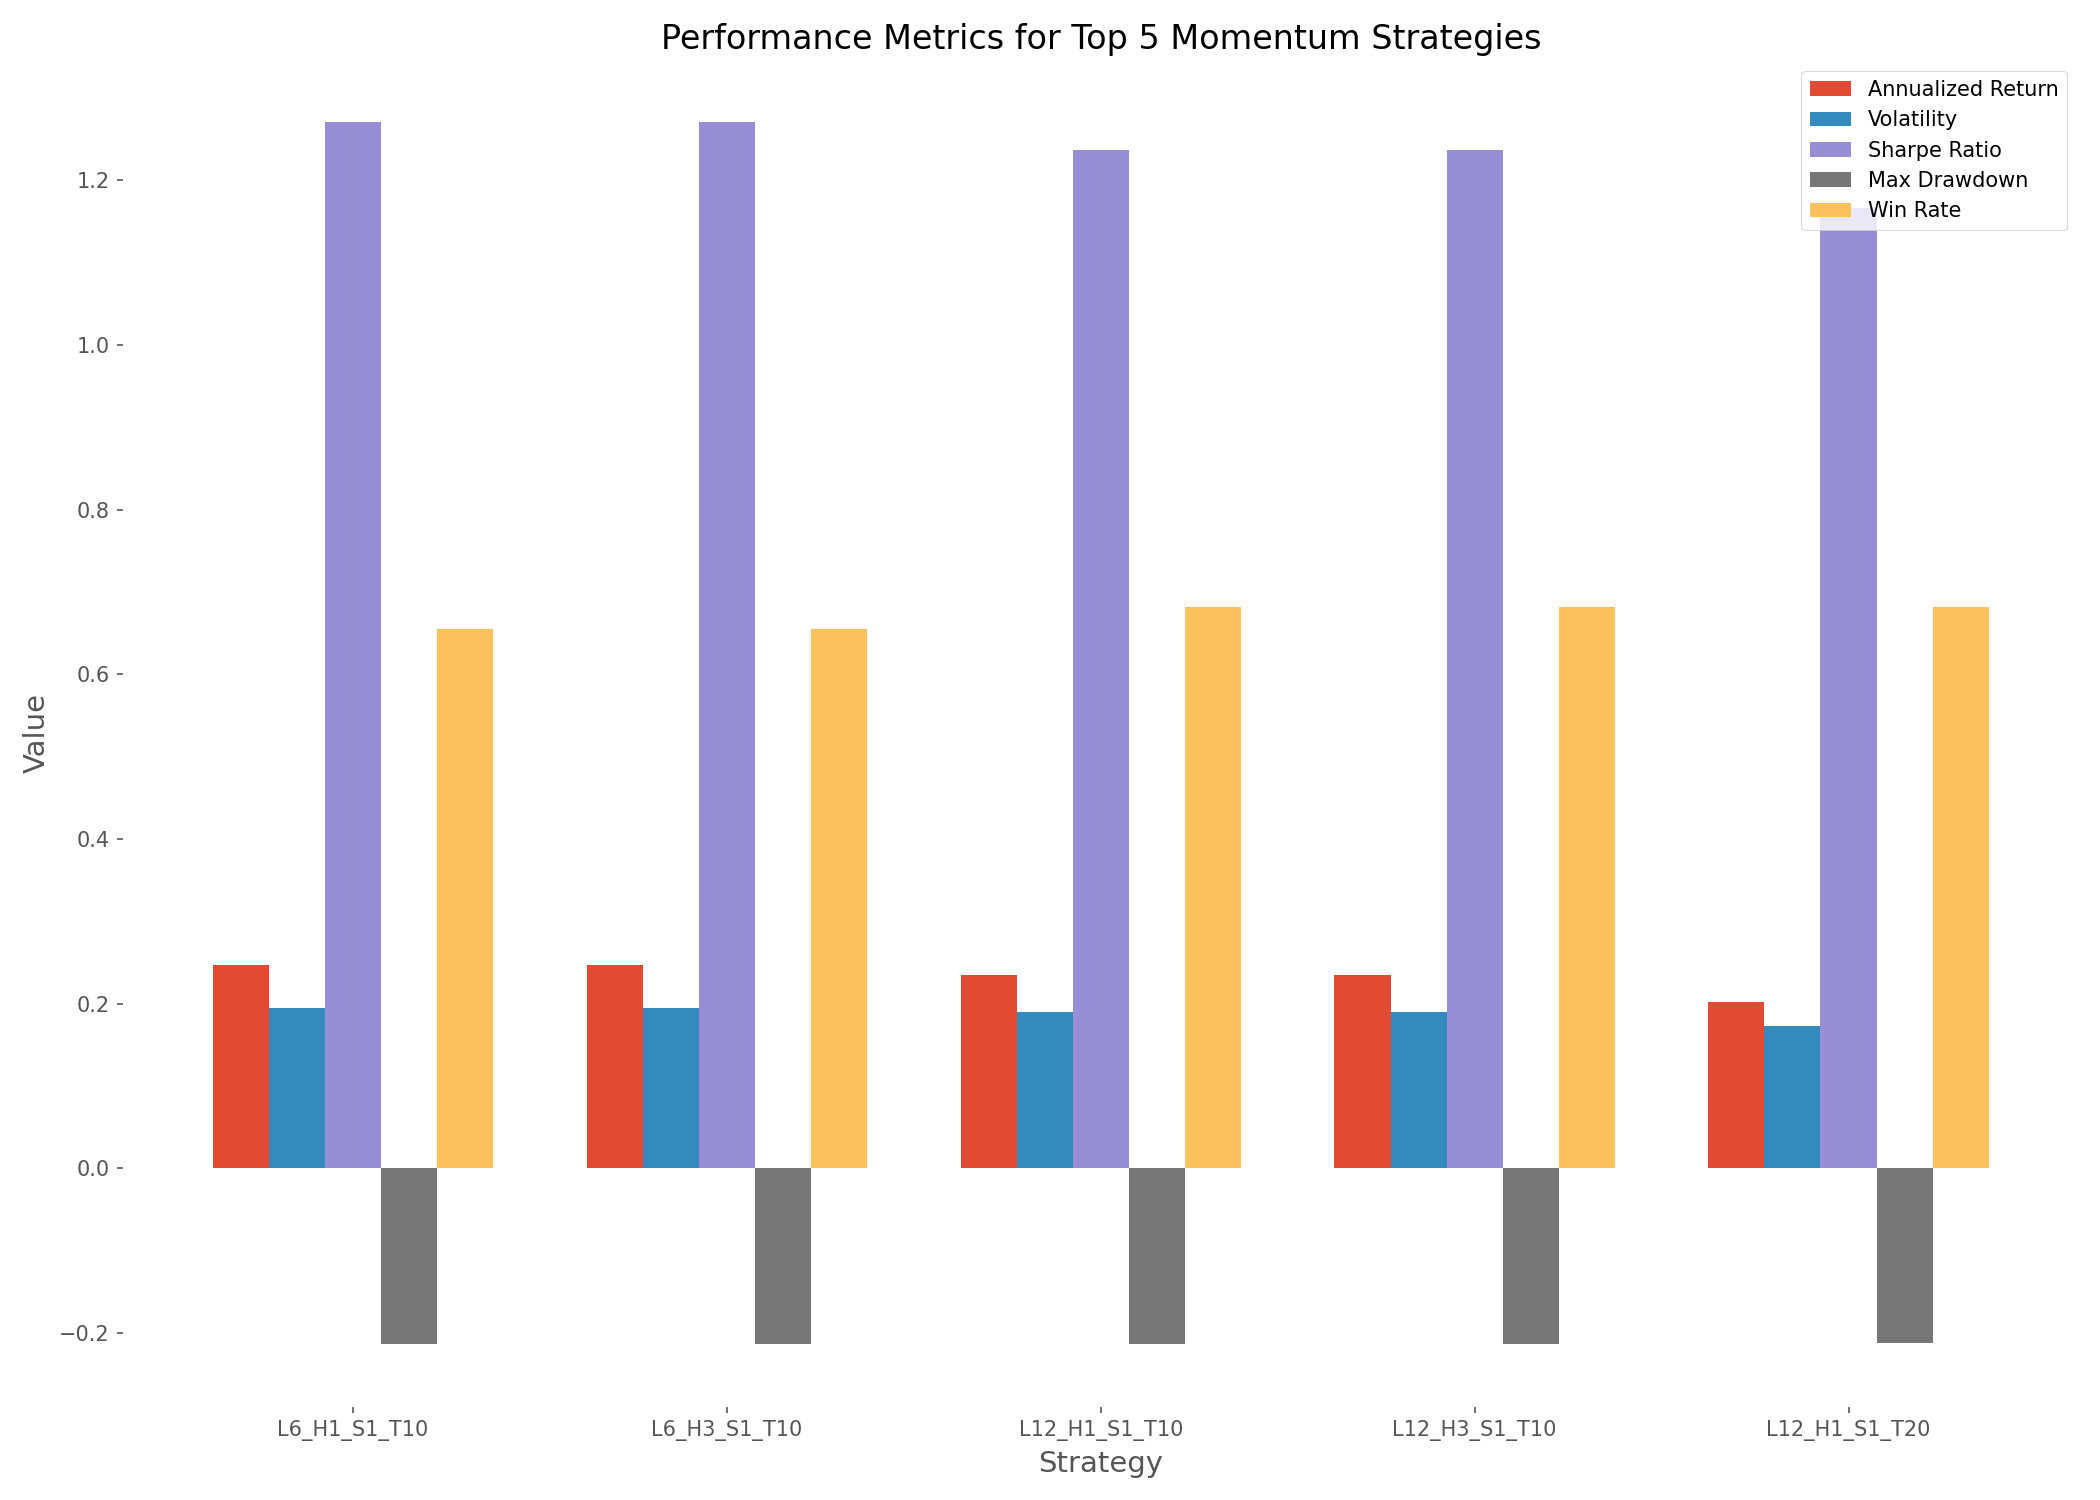
After analyzing all 32 configurations, we identified the best performing strategy: a 6-month lookback period, 1-month holding period, skipping the most recent month, and selecting the top 10% of performers (L6_H1_S1_T10). This strategy delivered exceptional results that significantly outperformed the broader market:
- Total return: 702.06% (vs. approximately 250% for the S&P 500)
- Annualized return: 24.74%
- Volatility: 19.48%
- Sharpe ratio: 1.27
- Maximum drawdown: -21.31%
- Win rate: 65.49%
Parameter Effectiveness
Our analysis revealed important insights about each parameter's impact on performance. The heatmap below visualizes how different combinations of lookback and holding periods affected the Sharpe ratio (a measure of risk-adjusted returns):
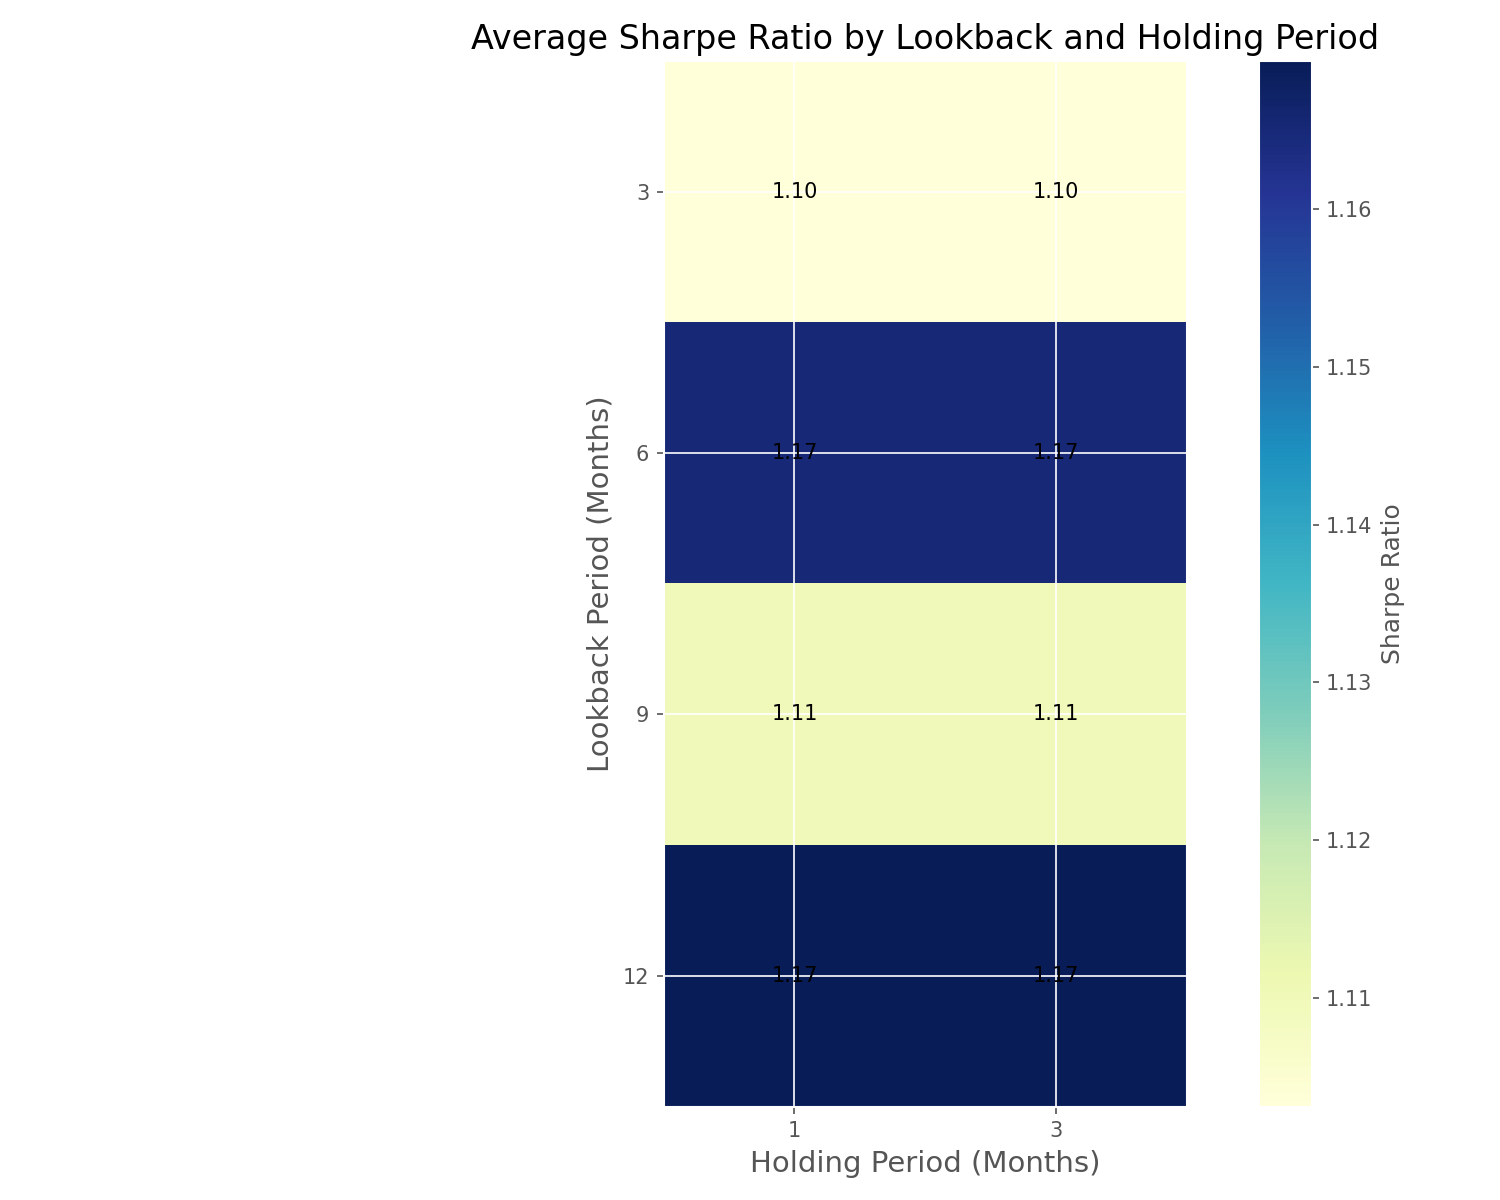
Key findings about each parameter's effectiveness include:
- Lookback period: The 12-month lookback had the highest average Sharpe ratio (1.17), suggesting that longer-term momentum signals tend to be more reliable
- Holding period: We found no significant difference between 1-month and 3-month holding periods, indicating flexibility in rebalancing frequency
- Skip month option: Skipping the most recent month improved performance (Sharpe ratio 1.16 vs 1.12), confirming the value of avoiding short-term reversals
- Selection percentage: Top 10% selection outperformed top 20% (Sharpe ratio 1.16 vs 1.11), showing that concentration in the strongest momentum stocks enhances returns
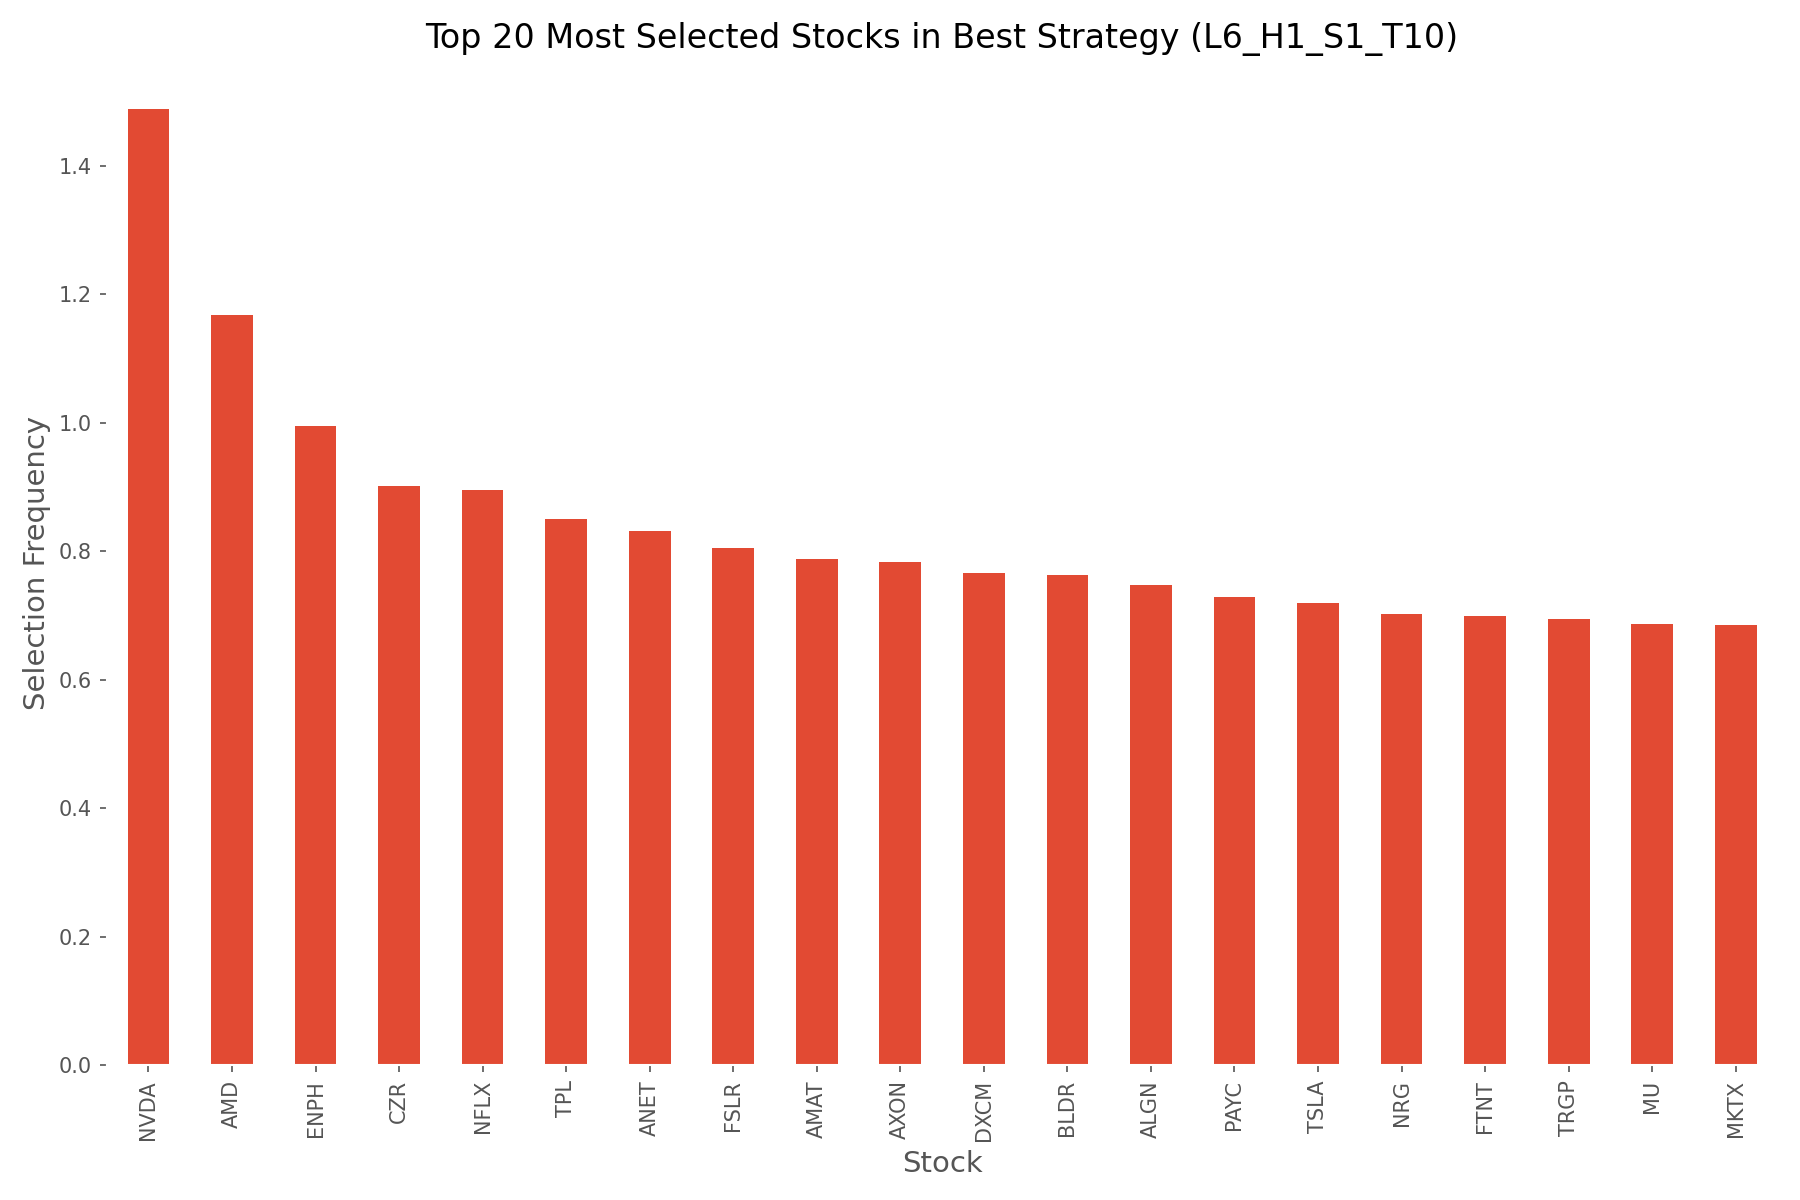
Top Selected Stocks
The best strategy consistently selected stocks with strong momentum. The visualization below shows which stocks were most frequently included in the portfolio over the 10-year period:
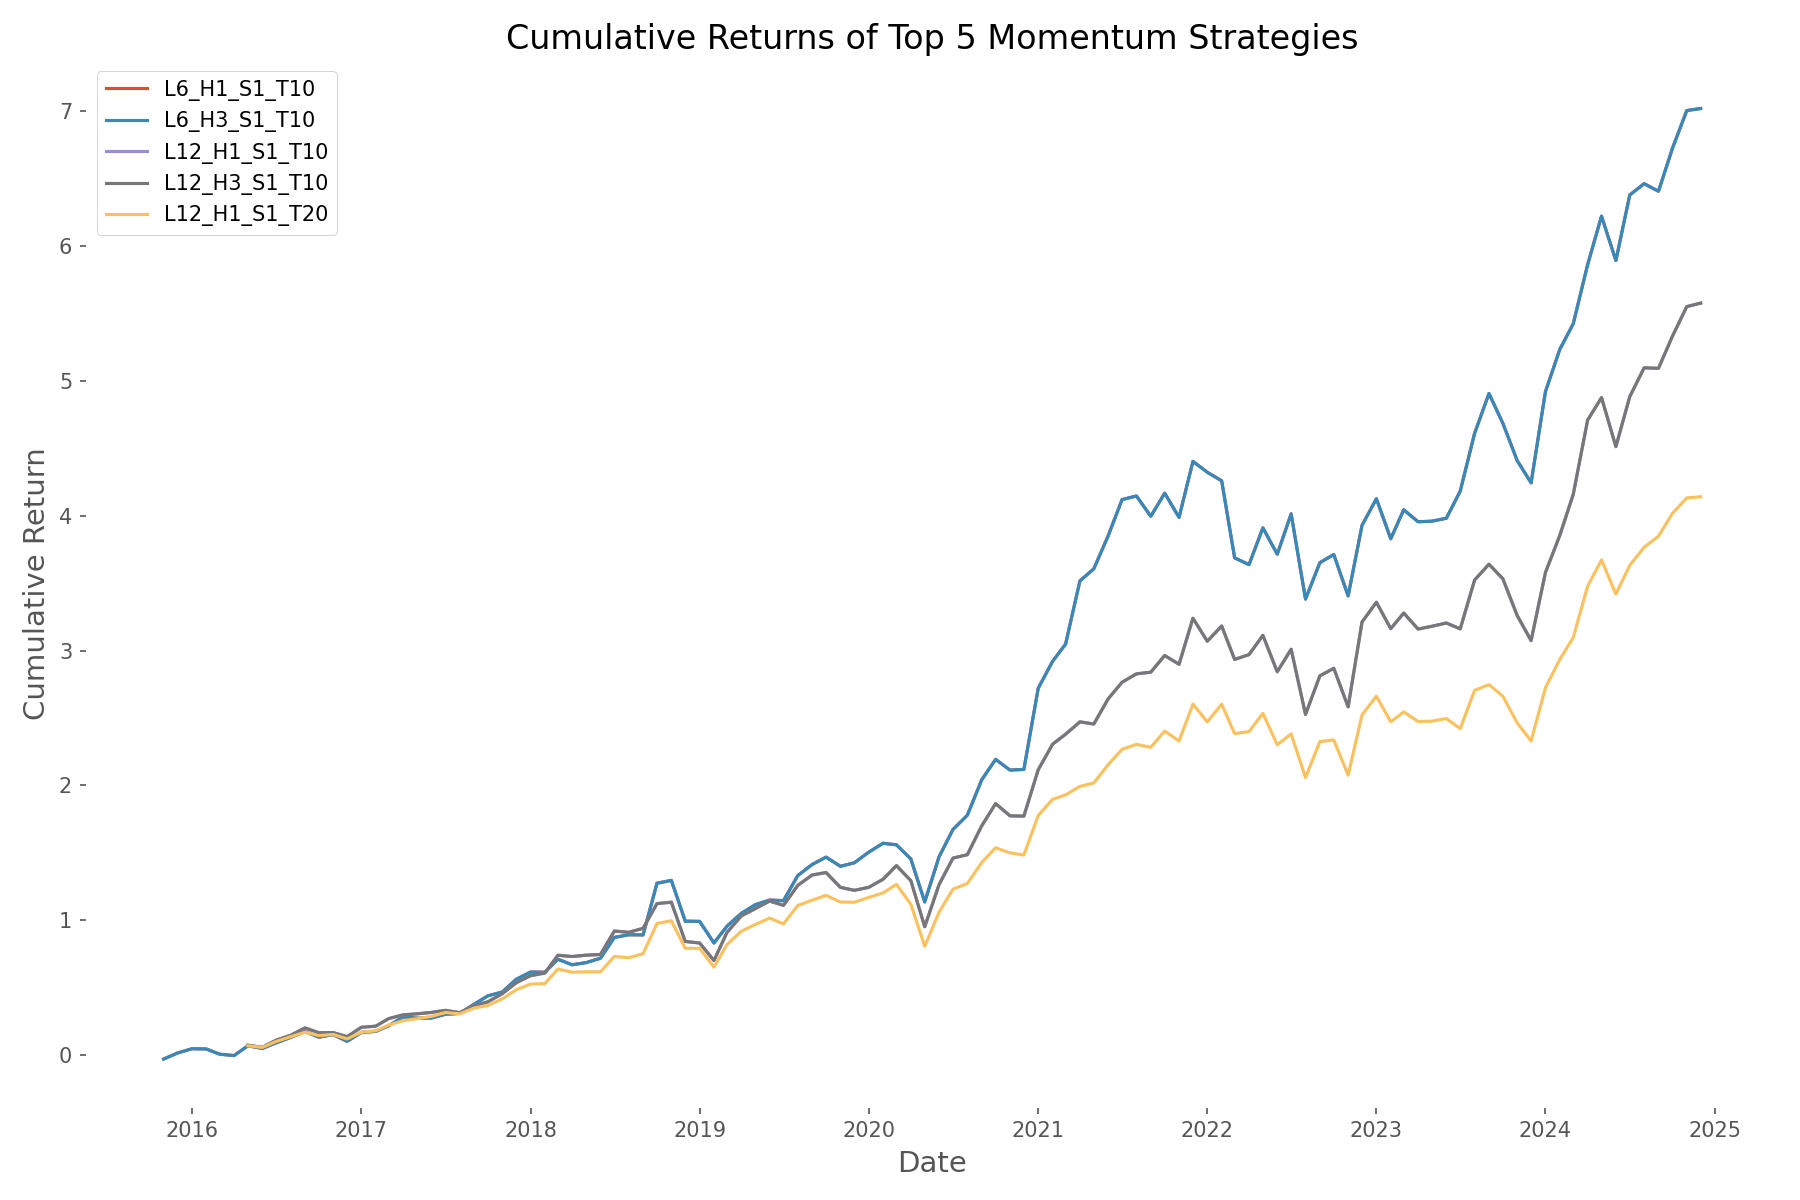
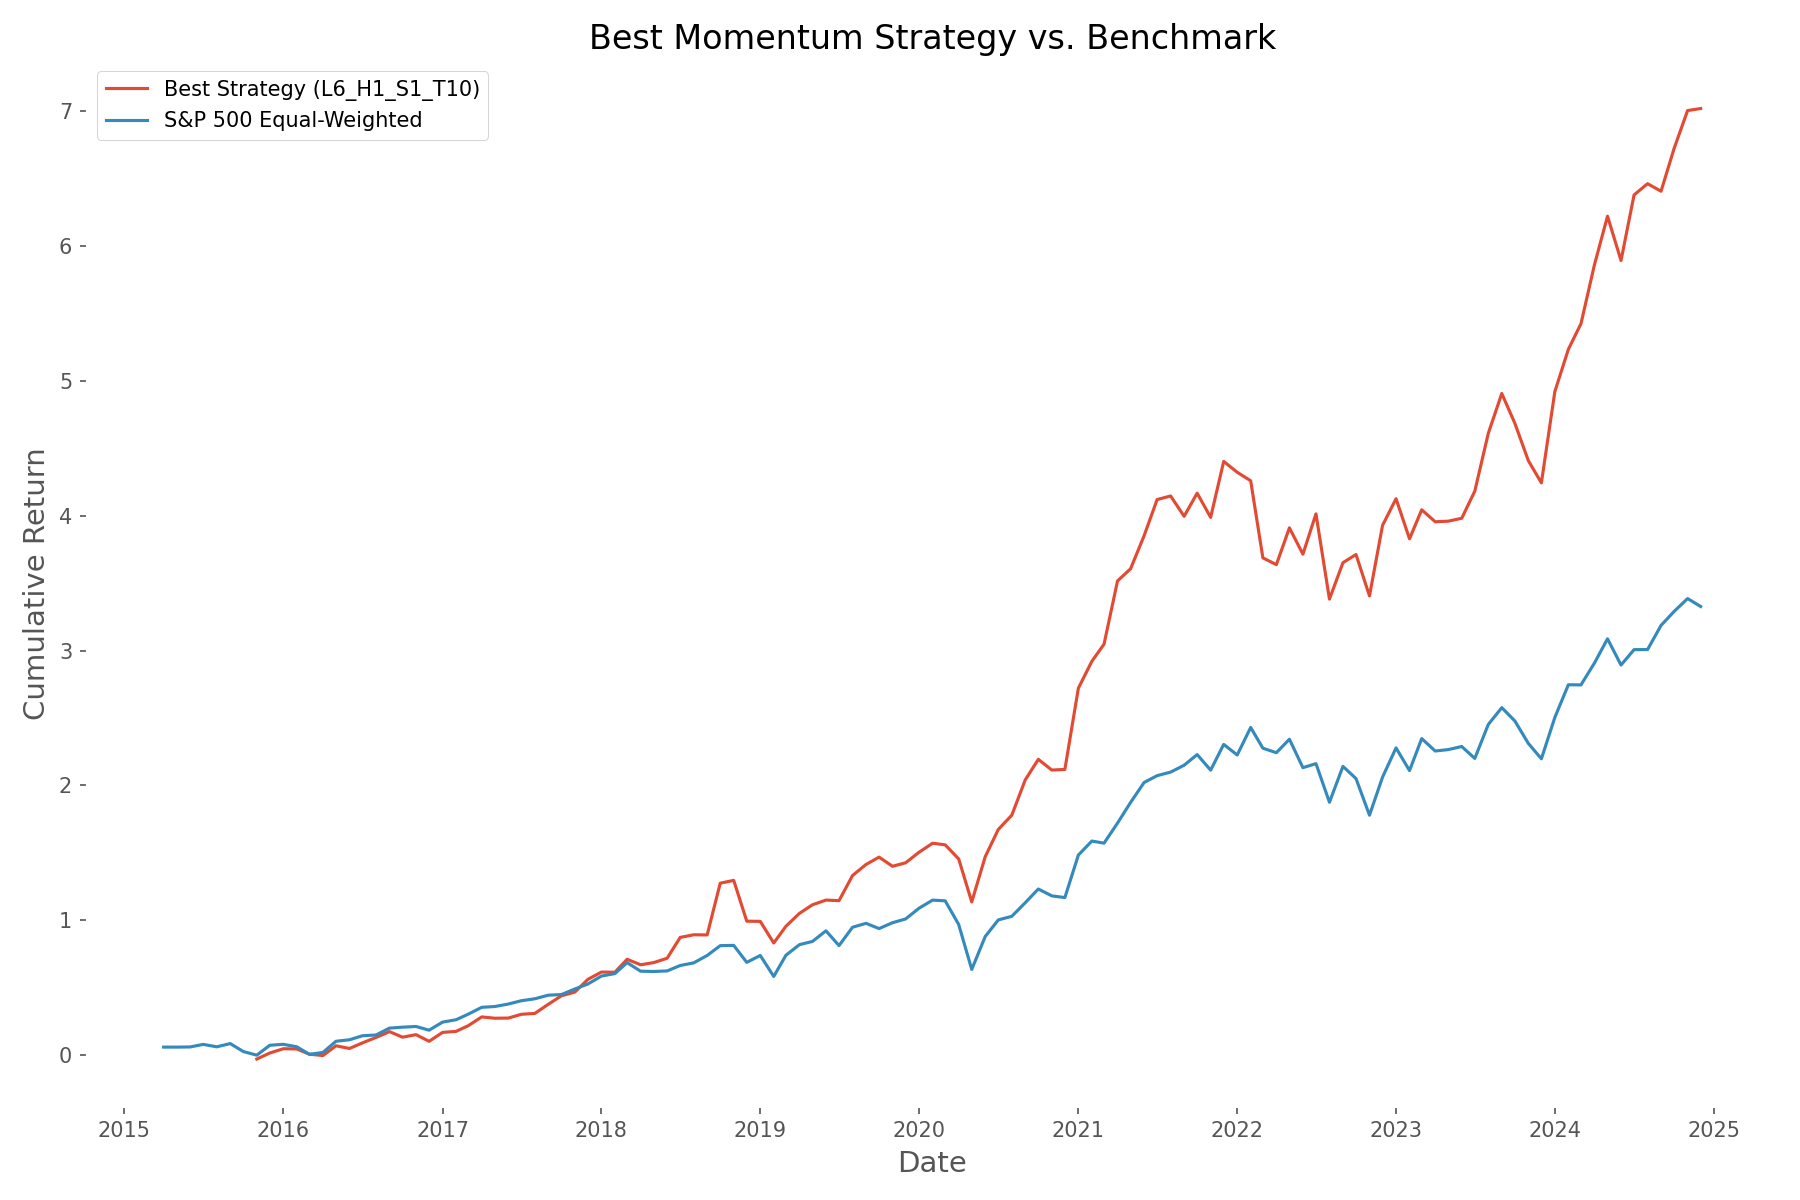
Strategy vs. Benchmark
To put the strategy's performance in context, we compared it to an equal-weighted S&P 500 benchmark. As shown below, the momentum strategy significantly outperformed the benchmark over the 10-year period:
Conclusion
Our comprehensive backtest confirms that momentum is a persistent and powerful investment factor. The optimal strategy—using a 6-month lookback period, 1-month holding period, skipping the most recent month, and selecting the top 10% of performers—delivered an impressive 702% total return over the decade, significantly outperforming the broader market.
These findings provide valuable guidance for investors looking to implement momentum strategies in their portfolios. By focusing on intermediate-term momentum, skipping the most recent month to avoid short-term reversals, and concentrating on the strongest momentum stocks, investors can potentially capture significant excess returns. However, it's important to remember that past performance does not guarantee future results, and momentum strategies may perform differently in changing market environments.
Comments (0)
No comments yet. Be the first to comment!