Introduction
You've just received a $12,000 bonus, inheritance, or tax refund. Congratulations! But now comes the age-old investing dilemma: should you invest it all at once (Lump Sum) or spread it out over time (Dollar-Cost Averaging)? This question has tormented investors for decades, with passionate advocates on both sides.
Rather than relying on conventional wisdom or gut feelings, we've conducted a comprehensive data analysis using real market data from the S&P 500 ETF (SPY), Nasdaq ETF (QQQ), and Bitcoin (BTC-USD). We've examined how these strategies performed during bull markets, bear markets, and even dramatic crashes like 2008 and 2020.
The results might surprise you—and more importantly, they'll help you make a more informed decision about your own investment strategy.
What Are DCA and Lump Sum?
Before diving into the data, let's clarify what these strategies actually entail:
<strong>Dollar-Cost Averaging (DCA)</strong> involves investing equal amounts at regular intervals over time. For our analysis, this means investing $1,000 monthly for 12 months. The key advantage is that you automatically buy more shares when prices are low and fewer when prices are high, potentially reducing the impact of market volatility.
<strong>Lump Sum investing</strong> means putting your entire investment amount into the market at once. In our simulation, this means investing the full $12,000 on day one. The philosophy here is simple: markets tend to rise over time, so the sooner your money is fully invested, the more time it has to grow.
Beyond the mechanics, there's also a psychological dimension. DCA can help overcome the fear of investing at the "wrong time," while Lump Sum investors might worry about missing out on potential gains by keeping money on the sidelines.
Data Collection and Simulation Setup
To compare these strategies objectively, we collected historical daily price data using the Tiingo API for three different assets representing varying levels of volatility:
- SPY (S&P 500 ETF) - Lower volatility, broad market exposure
- QQQ (Nasdaq ETF) - Medium volatility, tech-heavy exposure
- BTC-USD (Bitcoin) - High volatility cryptocurrency
Our simulation parameters were consistent across all tests:
- Total investment: $12,000
- DCA strategy: $1,000 invested monthly for 12 months
- Lump Sum strategy: Full $12,000 invested on day one
- Time periods analyzed: Financial Crisis (2008), Bull Market (2017), COVID Crash (2020), Recent Period (2022)
For each scenario, we calculated key performance metrics including total return, volatility (standard deviation), maximum drawdown (largest peak-to-trough decline), and Sharpe ratio (risk-adjusted return).
Simulation Results and Data Visualization
Portfolio Values During Market Volatility
Let's start by examining how both strategies performed during one of the most volatile periods in recent history—the COVID-19 crash of 2020:
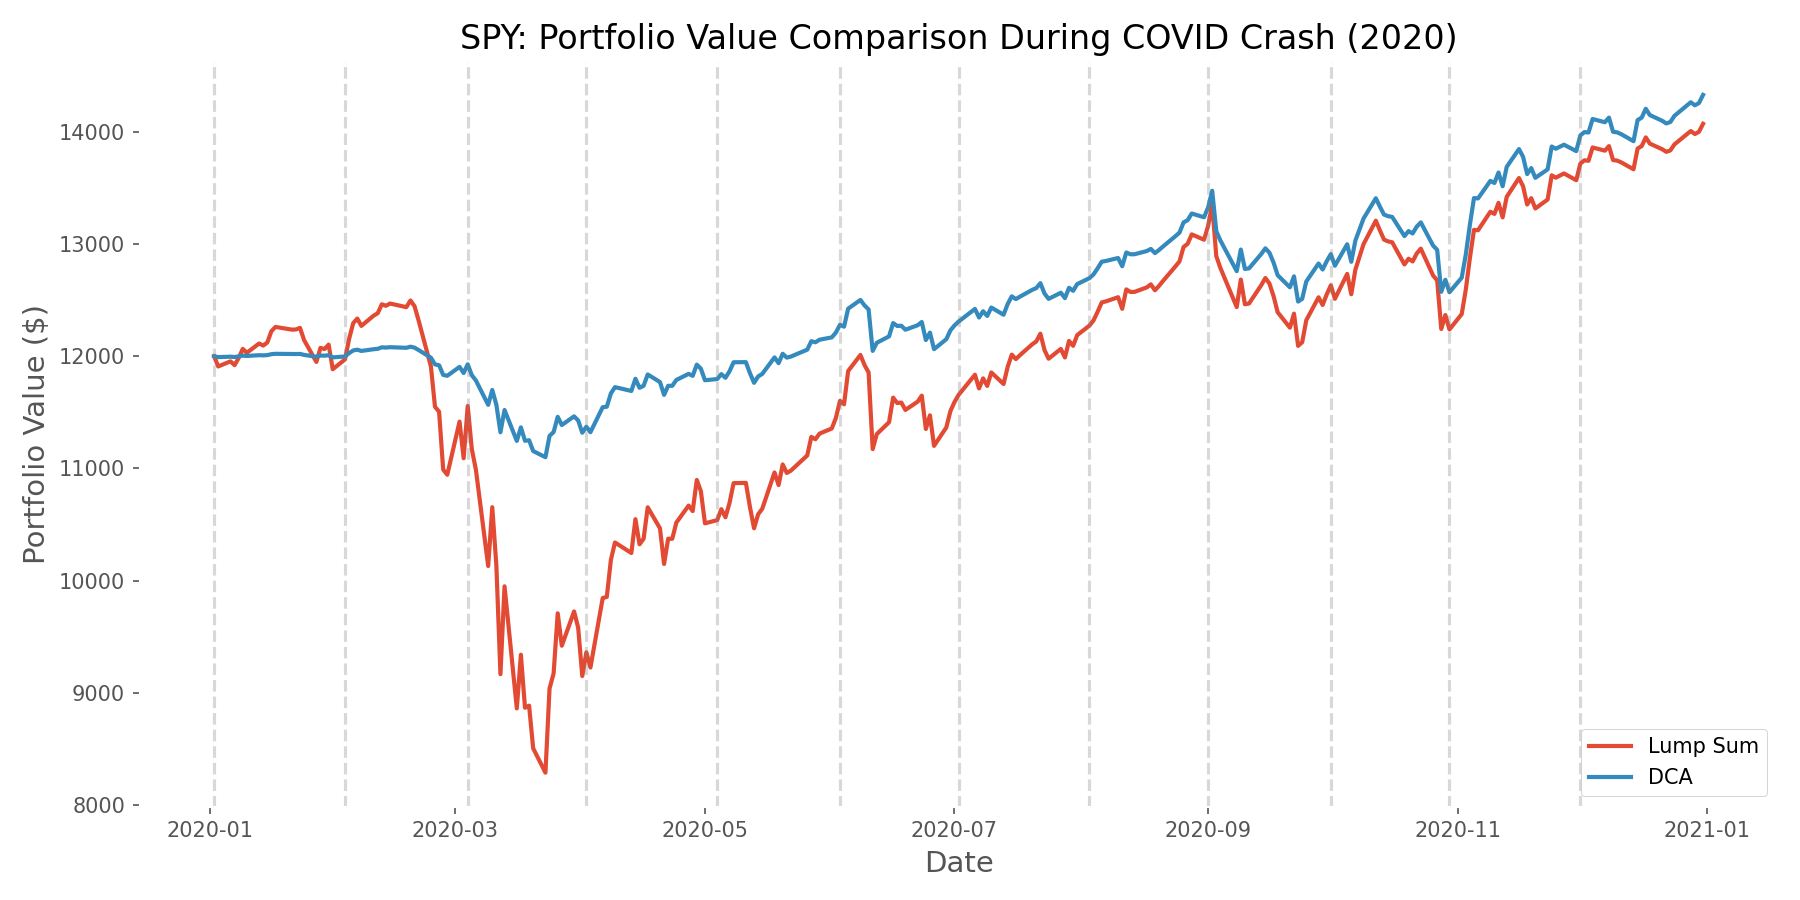
The chart reveals a fascinating story. When the market plummeted in March 2020, the Lump Sum portfolio experienced a dramatic decline. Meanwhile, the DCA strategy was only partially invested, cushioning the blow. As the market recovered, DCA continued deploying cash at lower prices, ultimately resulting in better performance by the end of the period.
Total Returns Across Different Market Conditions
When we expand our analysis across different market conditions and asset classes, a clear pattern emerges:
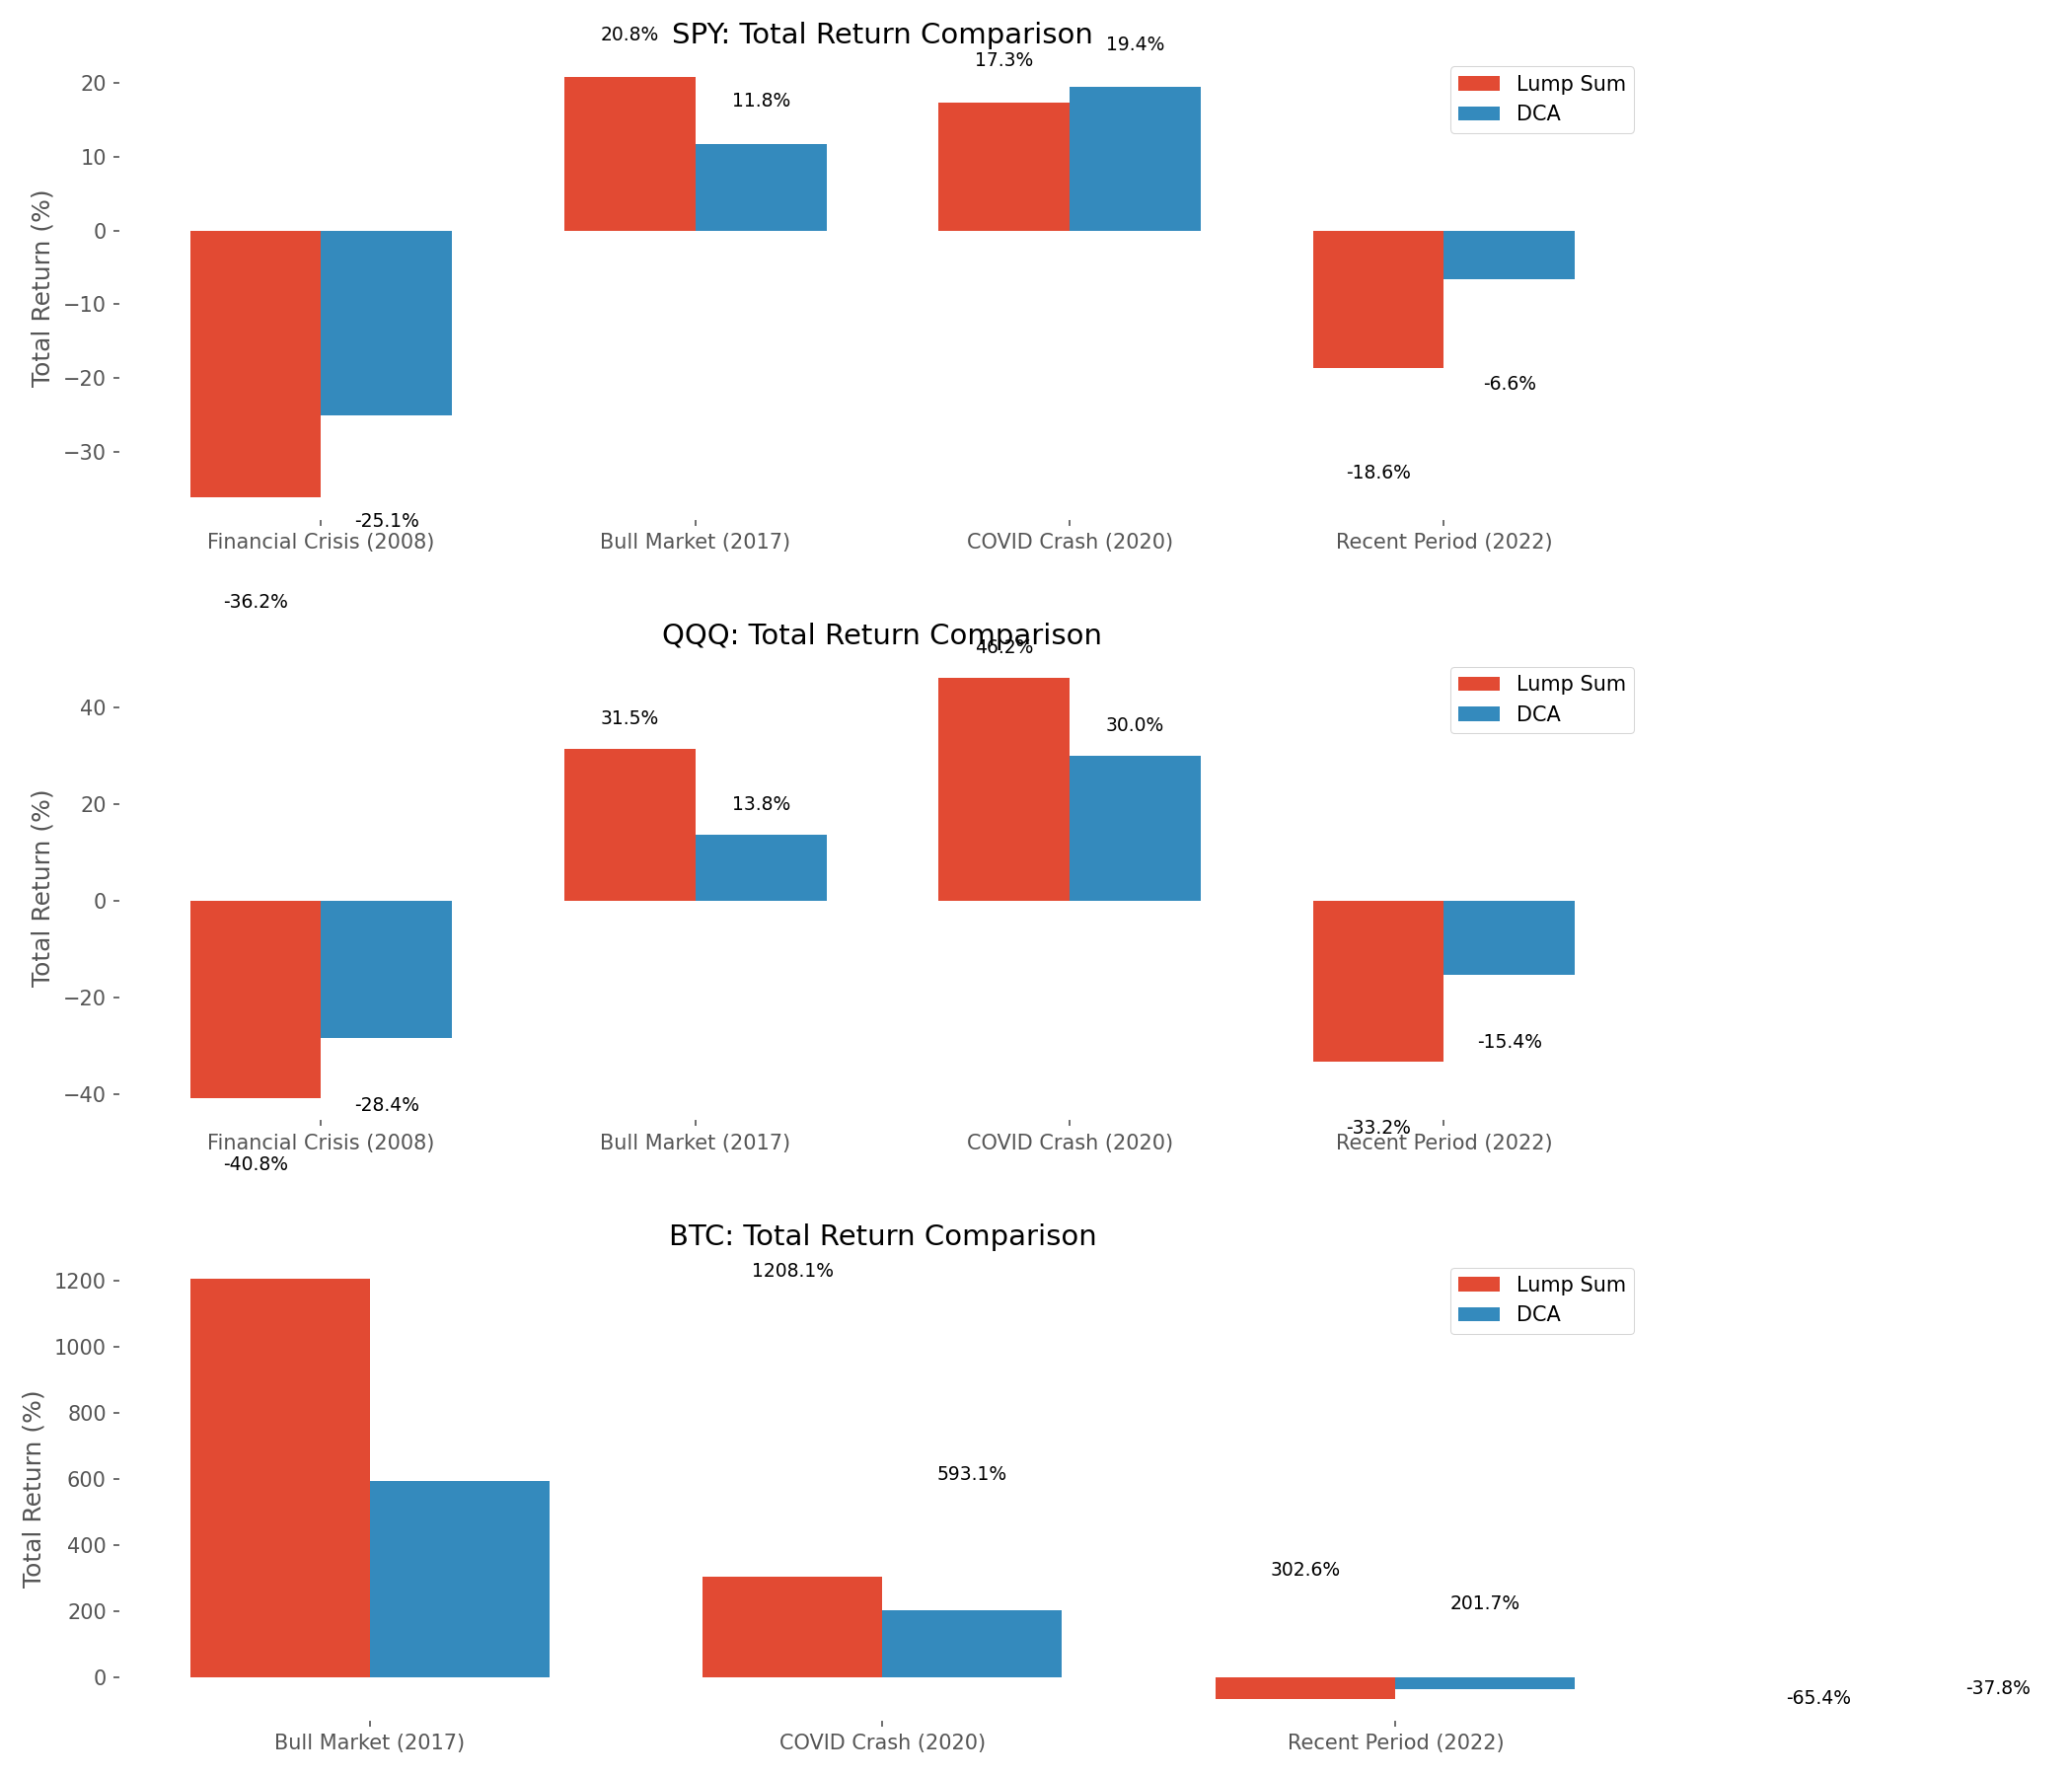
The data reveals that market direction is the primary determinant of which strategy performs better. In bull markets like 2017, Lump Sum investing generally outperformed DCA across all assets. Conversely, during bear markets like 2008 and 2022, DCA typically came out ahead by avoiding the full impact of market declines.
The performance gap was most dramatic with Bitcoin due to its extreme volatility. During the 2017 crypto bull run, Lump Sum investing in Bitcoin outperformed DCA by an astonishing margin. However, during the 2022 crypto winter, DCA significantly reduced losses compared to Lump Sum.
How DCA Works: Capital Deployment Visualization
To understand why DCA performs differently across market conditions, it helps to visualize how capital is deployed over time:
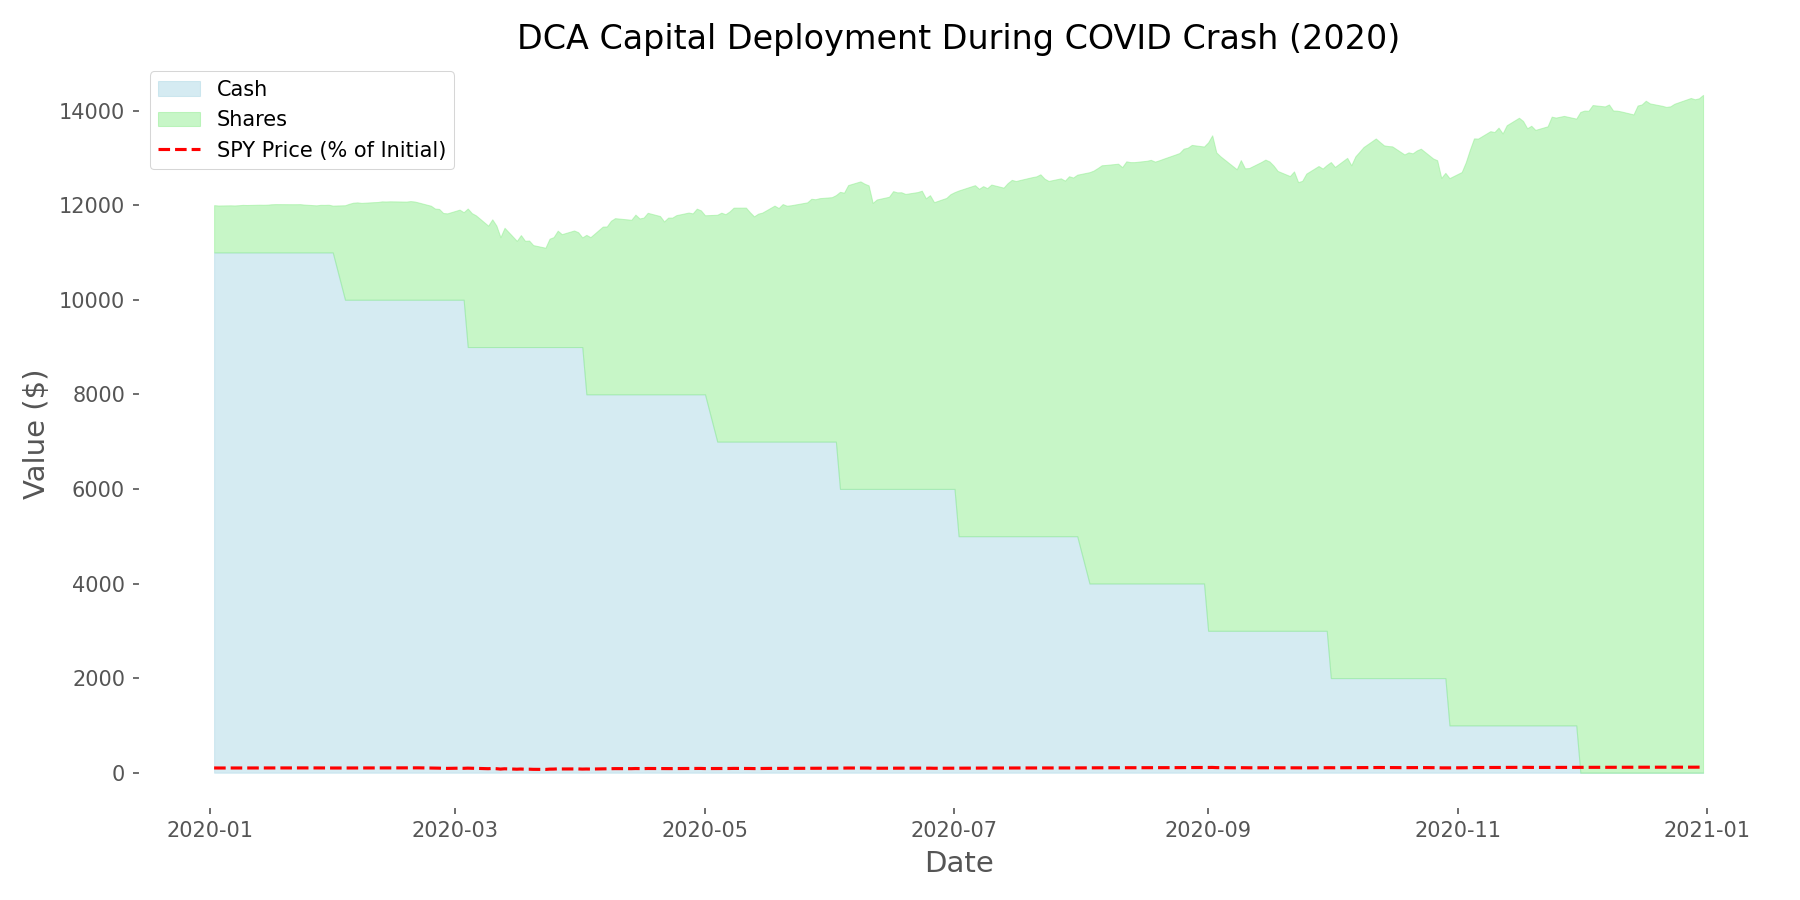
This visualization demonstrates one of DCA's key advantages: it naturally buys more shares when prices are low. Notice how the share accumulation accelerates during price dips. This inverse relationship between market prices and share accumulation is what gives DCA its risk-reduction properties.
Risk vs. Return Analysis
Investment decisions shouldn't be based solely on returns—risk matters too. Our analysis consistently found that DCA reduced volatility compared to Lump Sum investing:
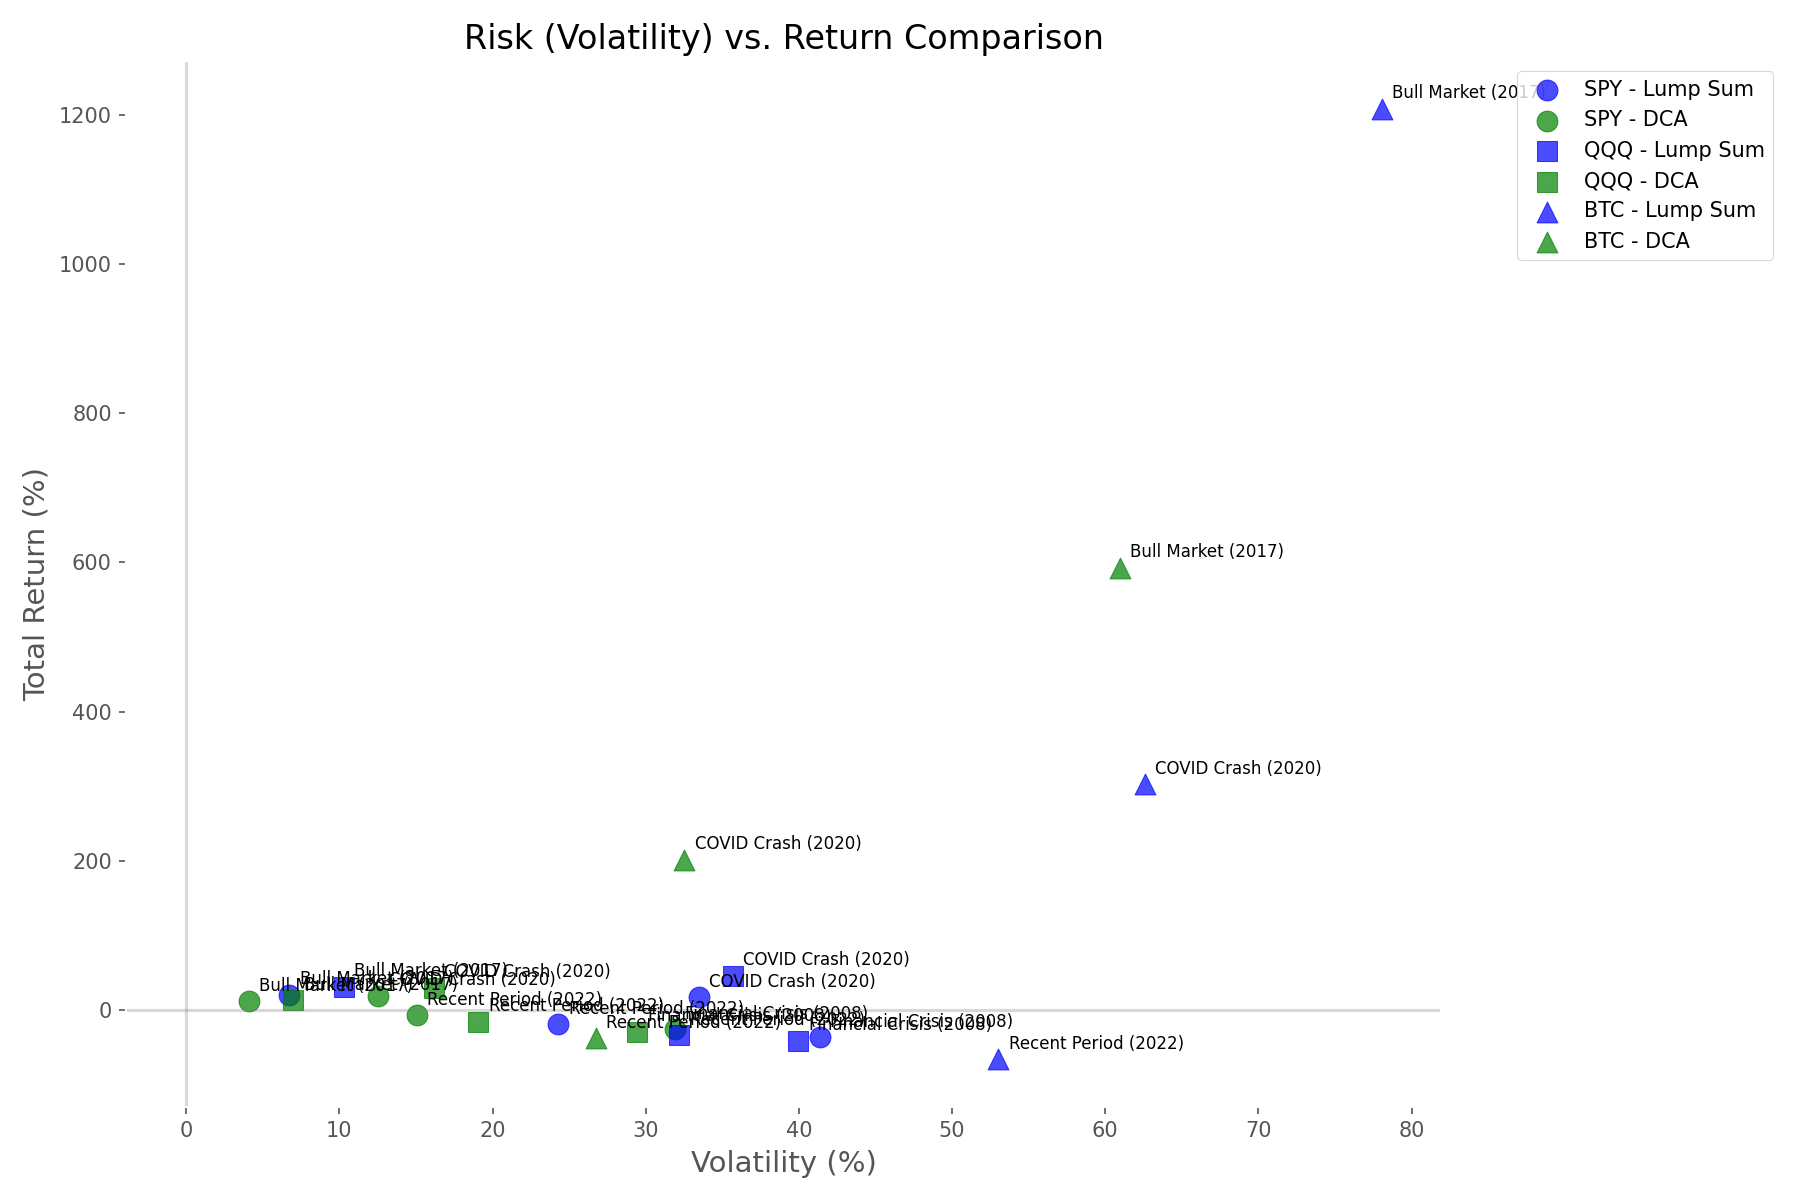
The scatter plot reveals that DCA consistently plots to the left of its Lump Sum counterpart, indicating lower volatility. This risk reduction was most pronounced in highly volatile assets like Bitcoin, where DCA reduced volatility by up to 40% compared to Lump Sum investing.
In some cases, particularly during volatile periods, DCA achieved better risk-adjusted returns (higher Sharpe ratios) despite potentially lower absolute returns.
When Each Strategy Shines: The Heatmap
To visualize when each strategy performs better, we created a heatmap showing the advantage of one strategy over the other across different assets and market conditions:
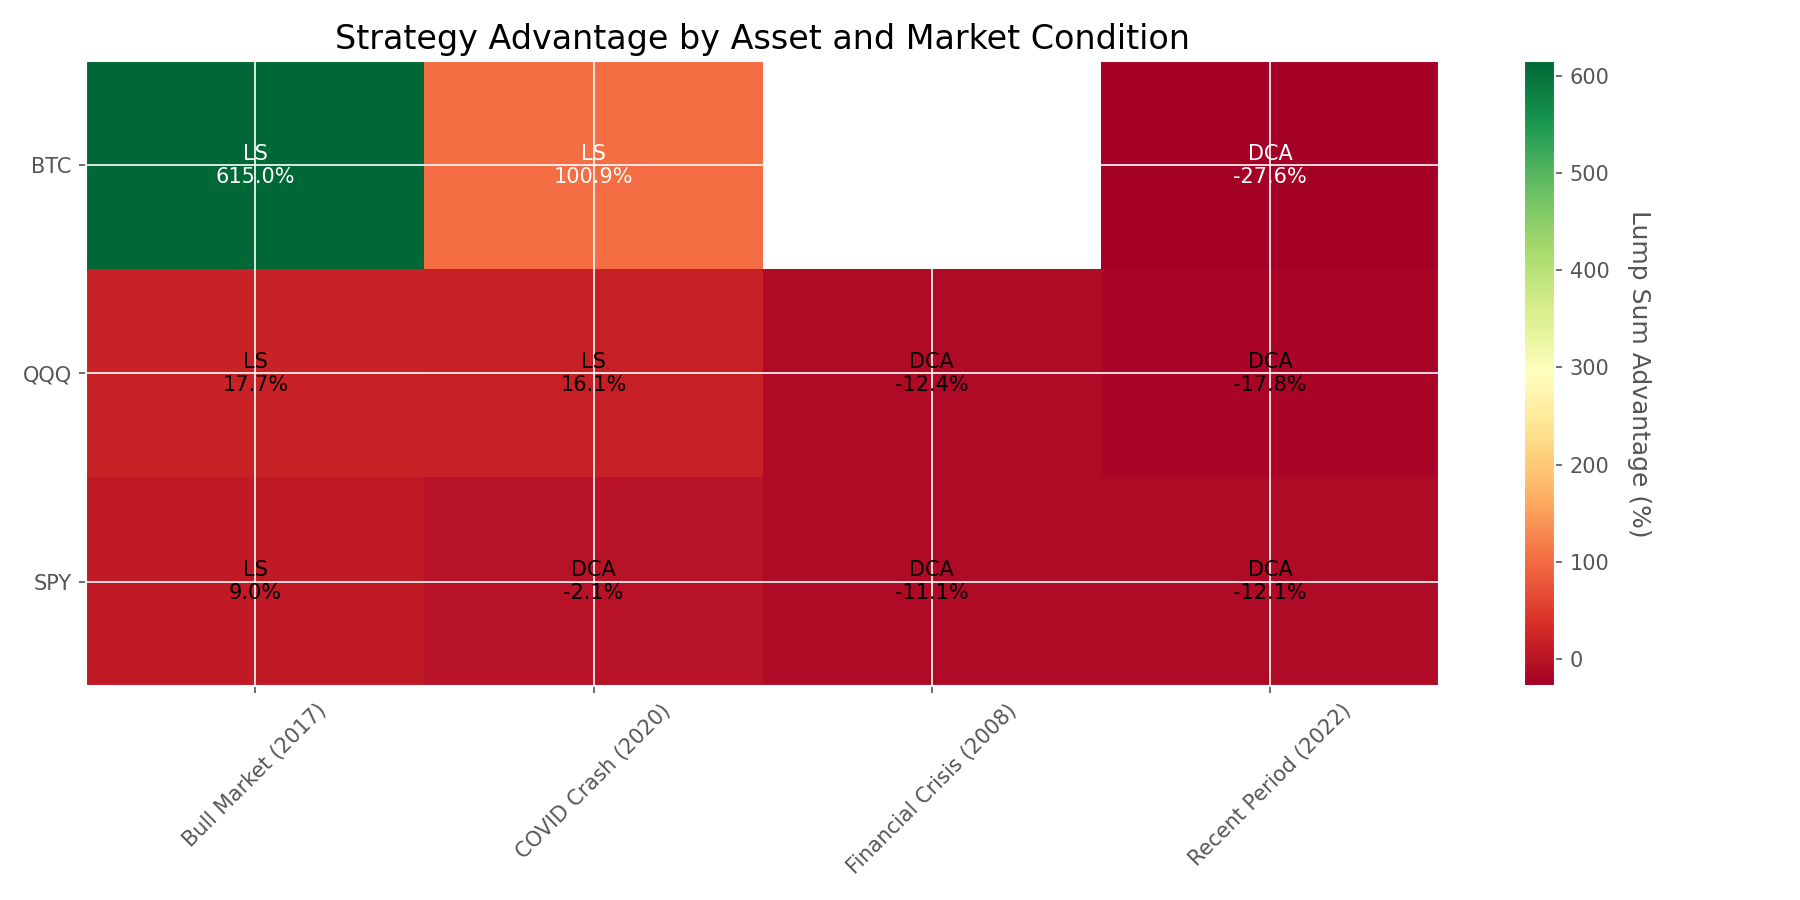
The heatmap confirms our earlier observations: Lump Sum tends to outperform in bull markets (shown in red), while DCA tends to outperform in bear markets or highly volatile periods (shown in blue). The intensity of the color indicates the magnitude of the advantage.
Long-Term Analysis: 2010-2023
Looking beyond specific market events, we analyzed 13 years of data to understand the long-term performance difference between these strategies:
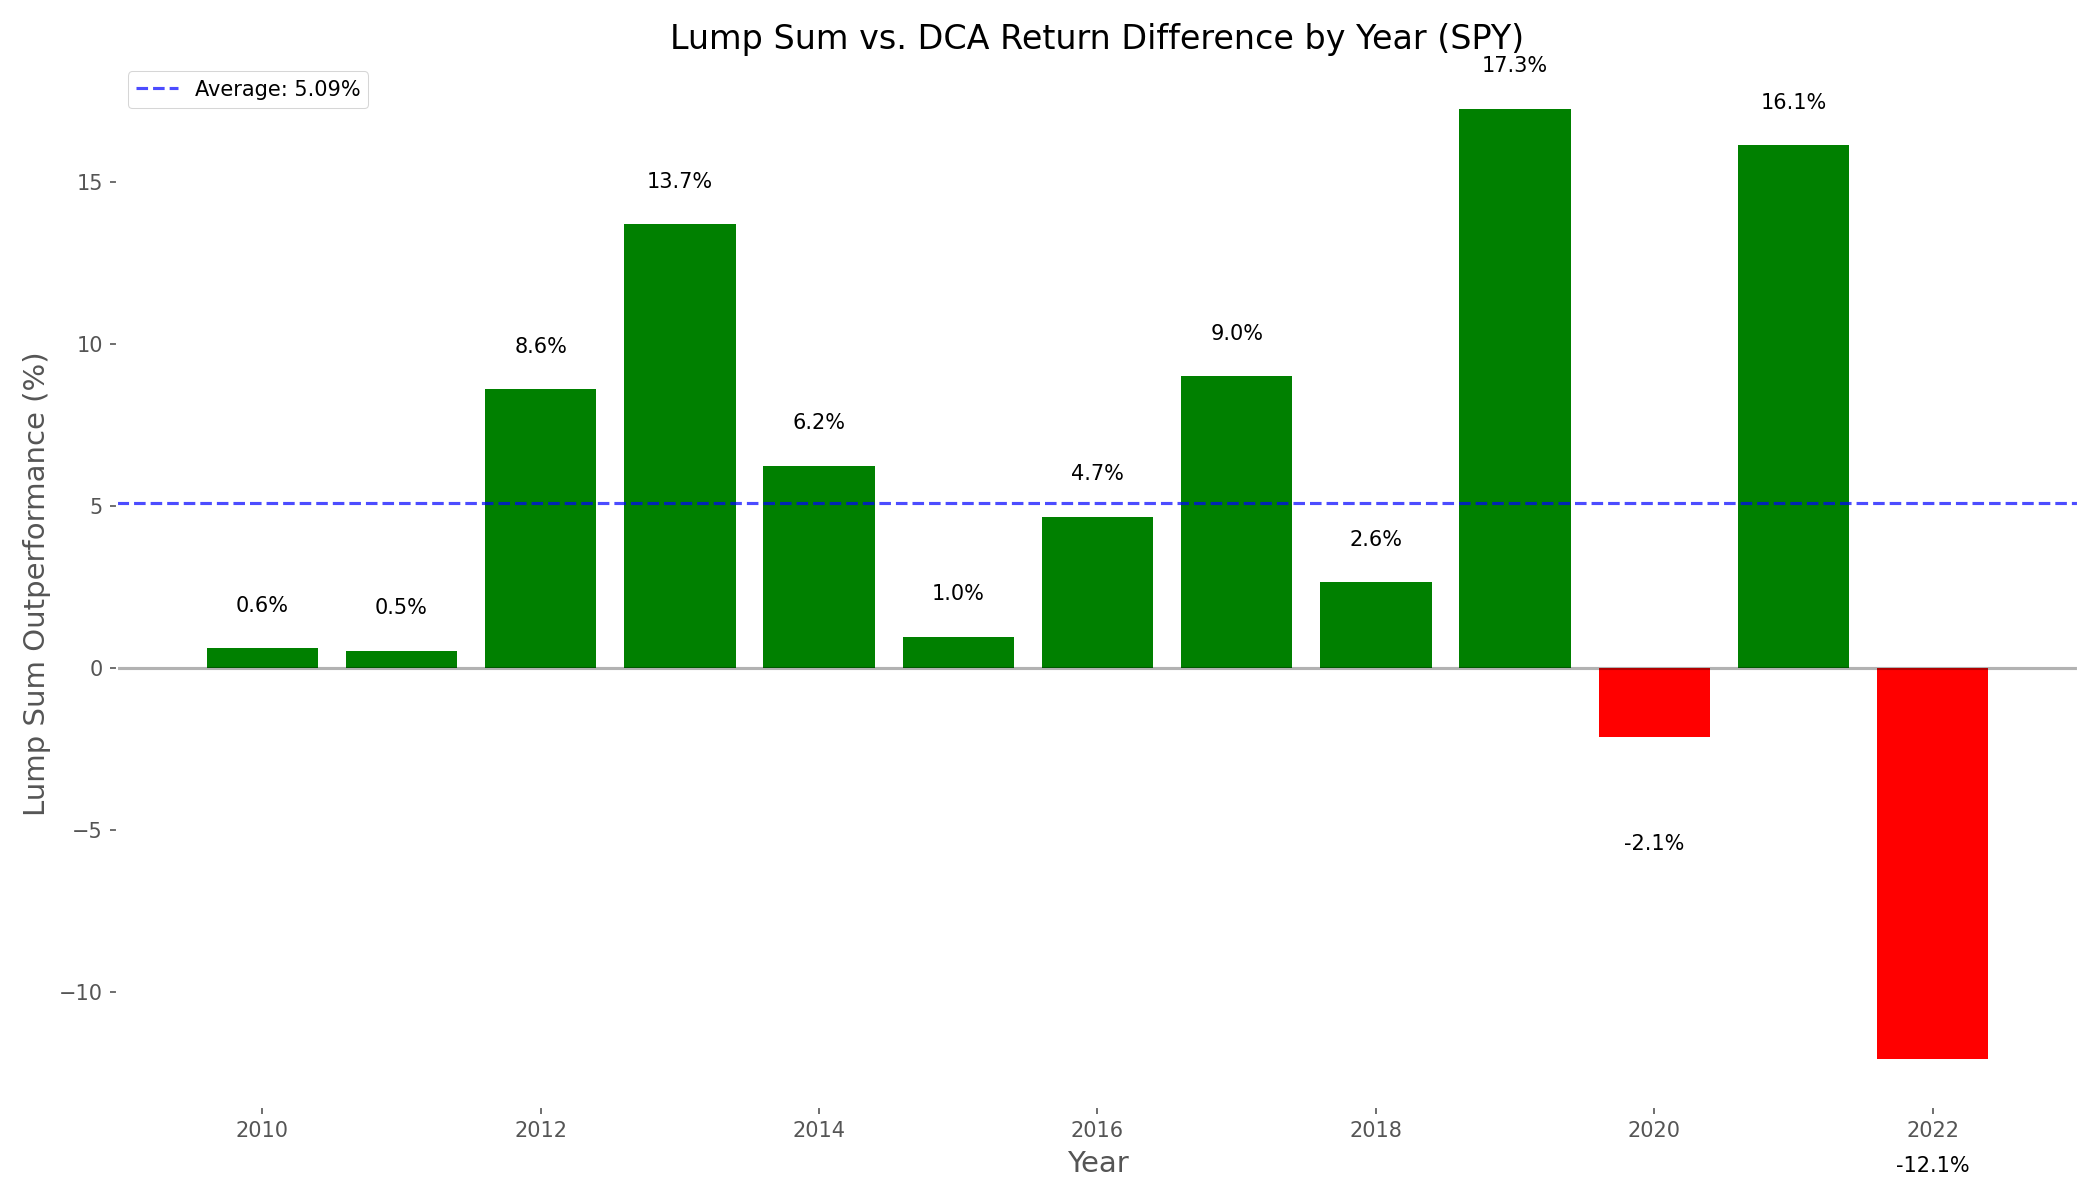
The data reveals that Lump Sum outperformed DCA in approximately 85% of years, with an average outperformance of 5.09%. However, during market downturns like 2018 and 2022, DCA provided significant protection, outperforming Lump Sum by up to 12.09%.
Market Returns and Strategy Performance
Is there a relationship between overall market performance and which strategy works better? Our analysis found a strong positive correlation (0.88) between market returns and Lump Sum advantage:
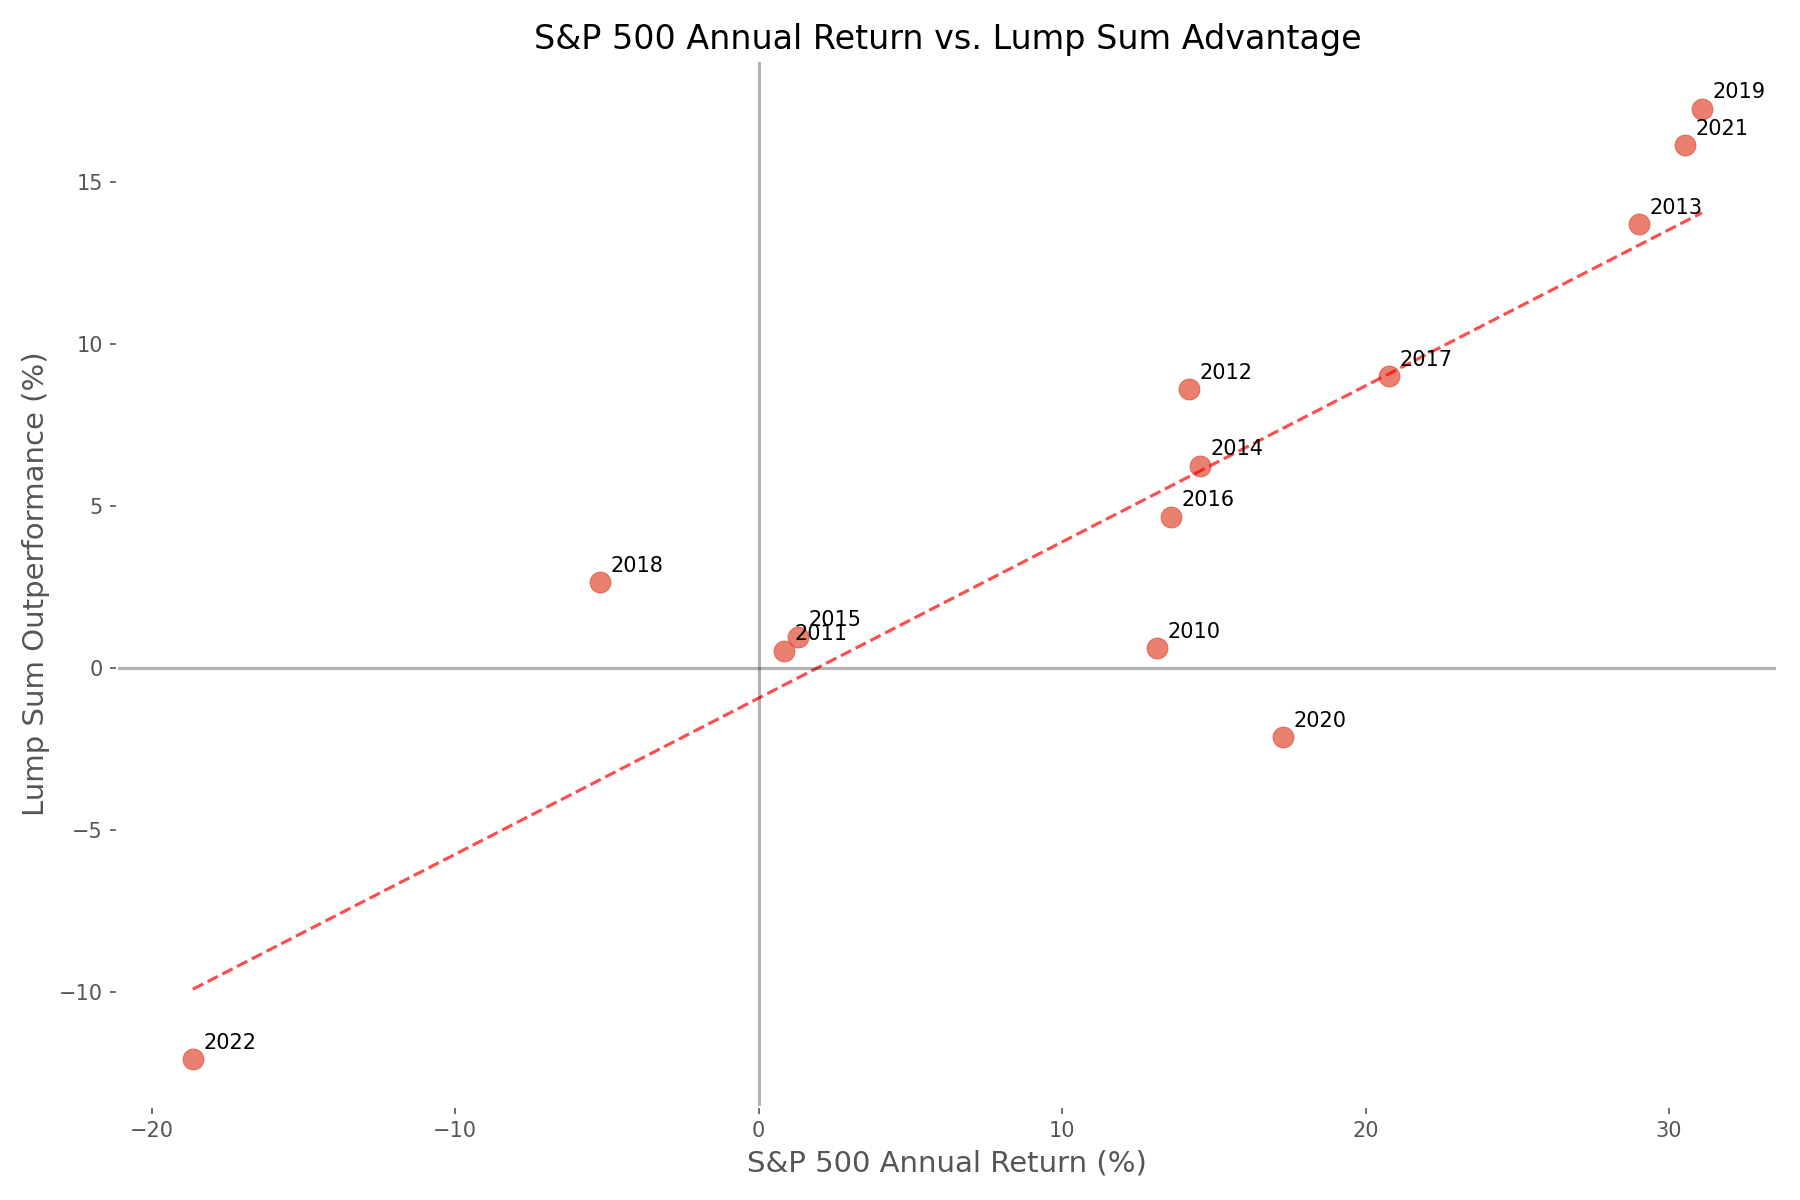
This scatter plot clearly shows that as market returns increase (moving right on the x-axis), the advantage of Lump Sum over DCA also increases (moving up on the y-axis). The trend line crosses the x-axis near zero, suggesting that when markets are flat, the strategies perform similarly.
Conclusion & Takeaways
Our data-driven analysis reveals that neither strategy is universally superior—each has its strengths depending on market conditions and investor psychology:
- <strong>For long-term investors with high risk tolerance:</strong> Lump Sum investing tends to provide better returns over time, outperforming DCA in approximately 85% of years in our analysis.
- <strong>For risk-averse investors:</strong> DCA offers significant downside protection during market corrections, with lower volatility and smaller maximum drawdowns.
- <strong>For volatile assets like cryptocurrencies:</strong> The benefits of DCA are amplified, potentially offering a more balanced risk-return profile.
- <strong>For uncertain market outlooks:</strong> DCA provides a middle ground that reduces timing risk while still maintaining market exposure.
Perhaps the most important insight is that your investment strategy should align not just with market conditions, but with your personal risk tolerance and psychological comfort. The "best" strategy is ultimately the one you can stick with through market turbulence.
As a final thought, consider that these strategies aren't mutually exclusive. Some investors might benefit from a hybrid approach—investing a portion as a lump sum while dollar-cost averaging the rest. The data suggests that this could provide a balance between maximizing returns in rising markets while maintaining some protection against timing risk.
Whatever approach you choose, consistency and discipline remain the true keys to long-term investment success.
Comments (0)
No comments yet. Be the first to comment!