The Evolving Business Model
Opendoor's core business revolves around its iBuying model—purchasing homes directly from sellers, making necessary improvements, and reselling them on the open market. This capital-intensive approach requires substantial financial resources and careful inventory management, making Opendoor's balance sheet particularly important for investors to understand. Since its inception in 2014, Opendoor has weathered significant market volatility, from the pandemic housing boom to subsequent interest rate hikes that impacted the entire real estate sector. The company's financial trajectory reveals an organization actively restructuring its operations to achieve sustainable profitability.
Revenue Trends and Operational Efficiency
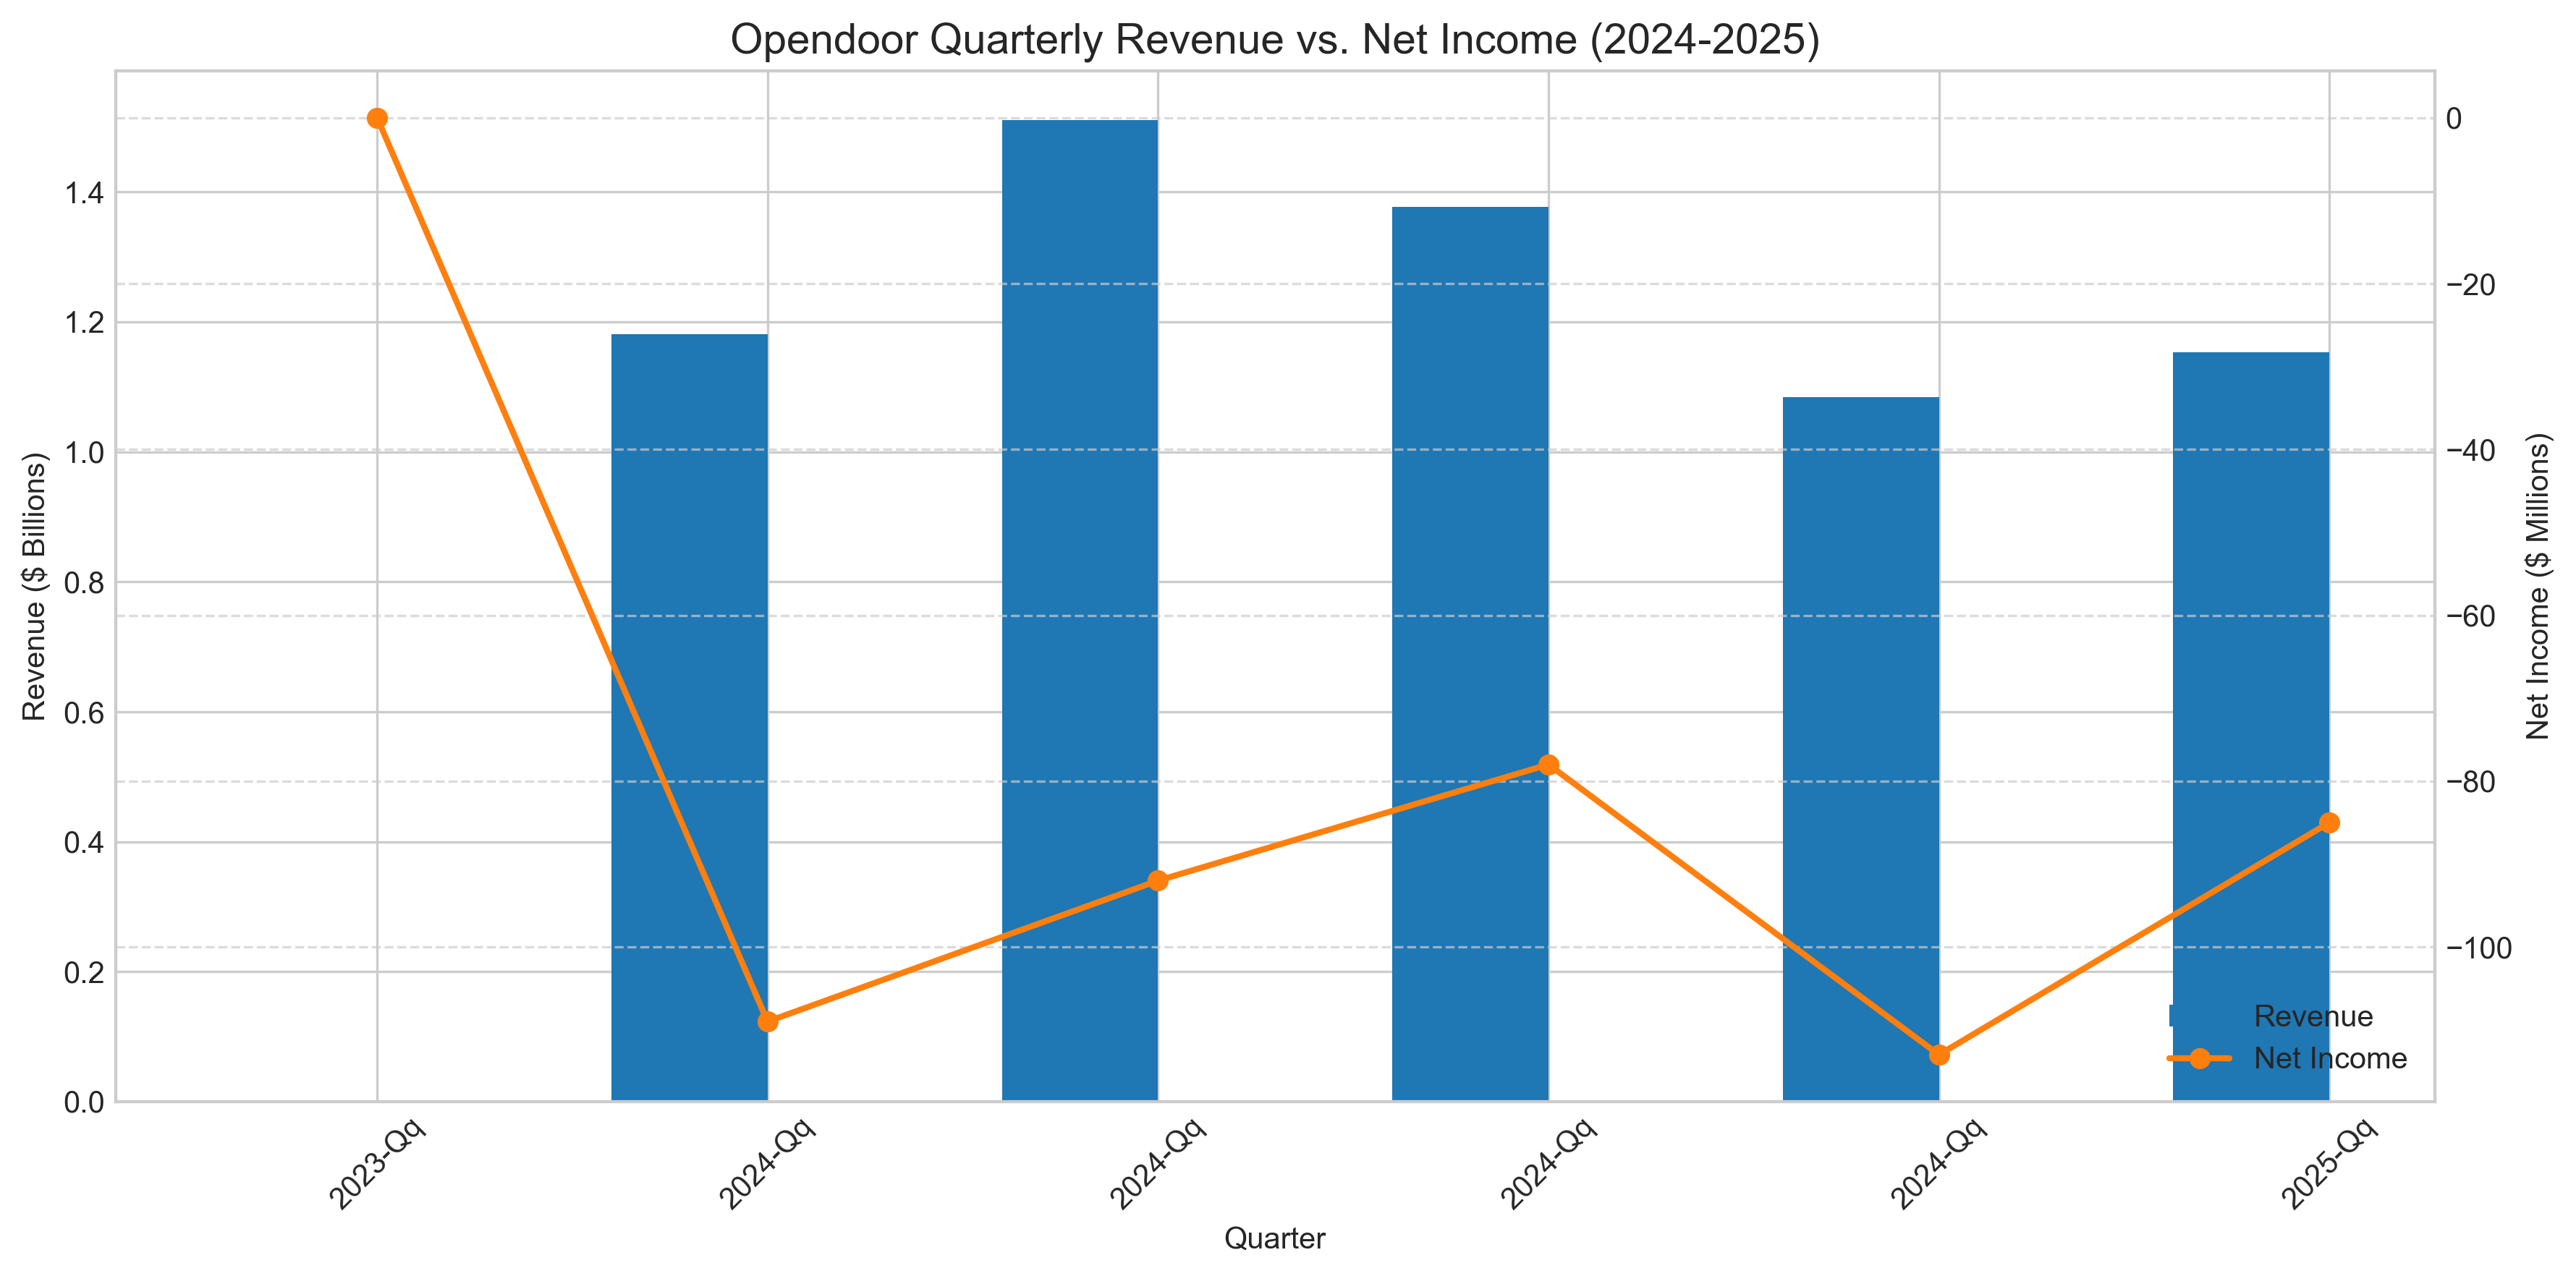
Opendoor's recent performance shows a company in transition. In Q1 2025, the company reported revenue of $1.15 billion, representing a 6.4% increase from the previous quarter, though still below the peaks seen in mid-2024. This revenue fluctuation reflects the company's strategic adjustment to market conditions, focusing more on profitability than pure volume growth.
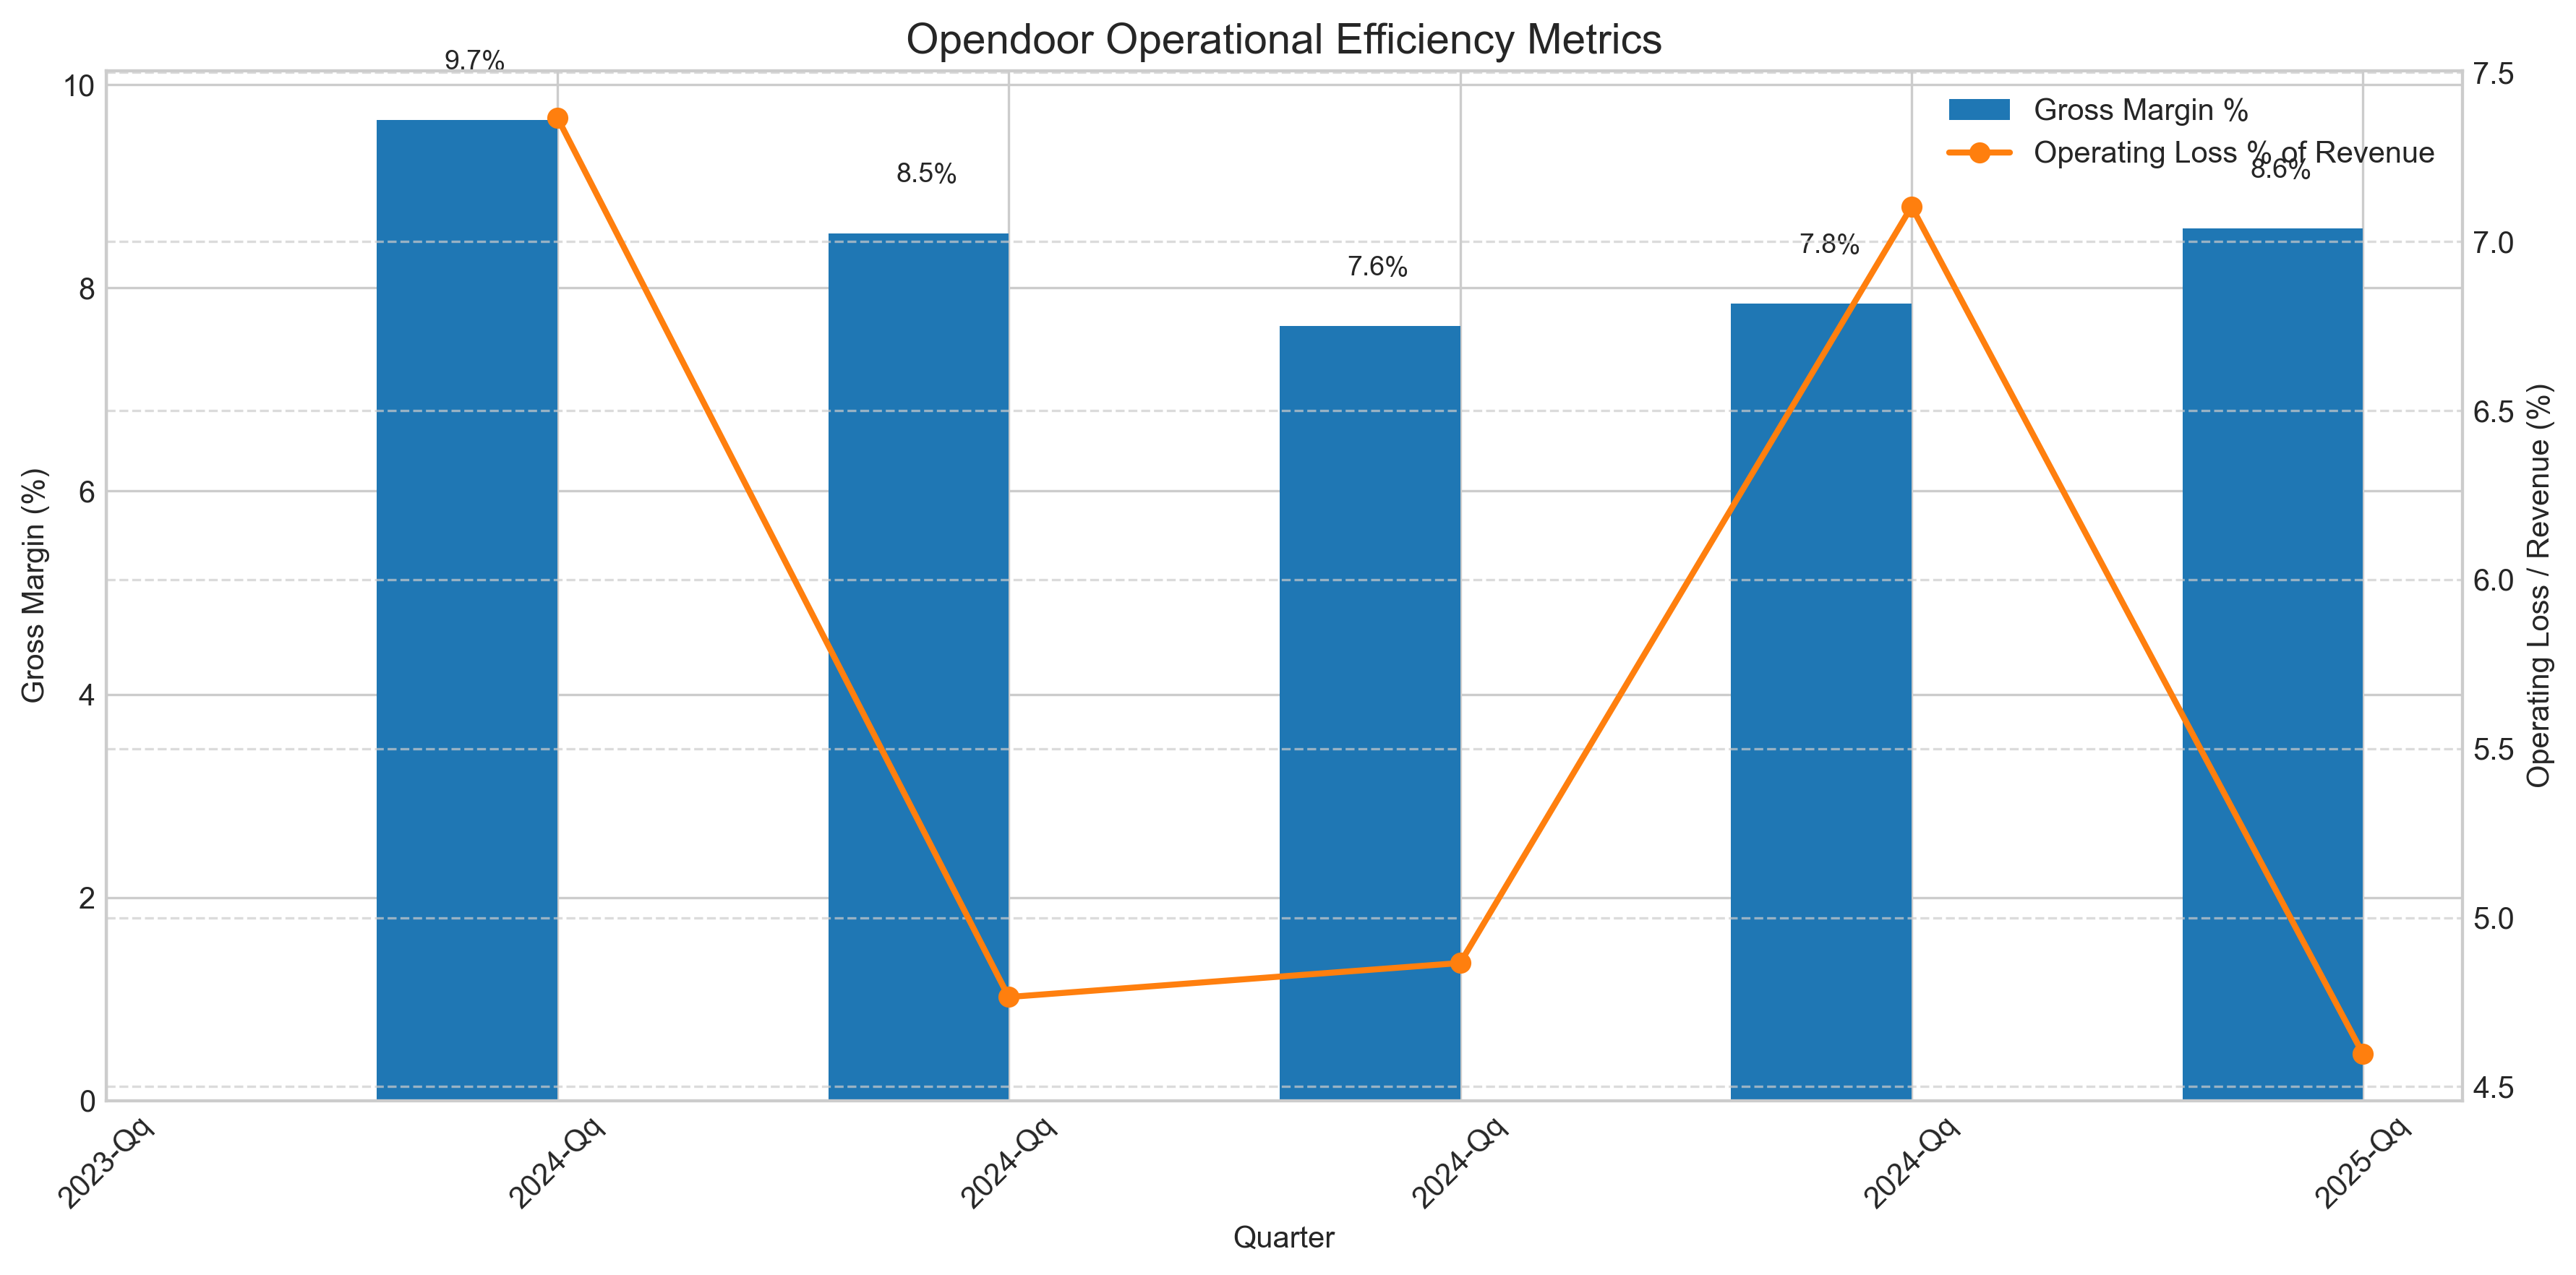
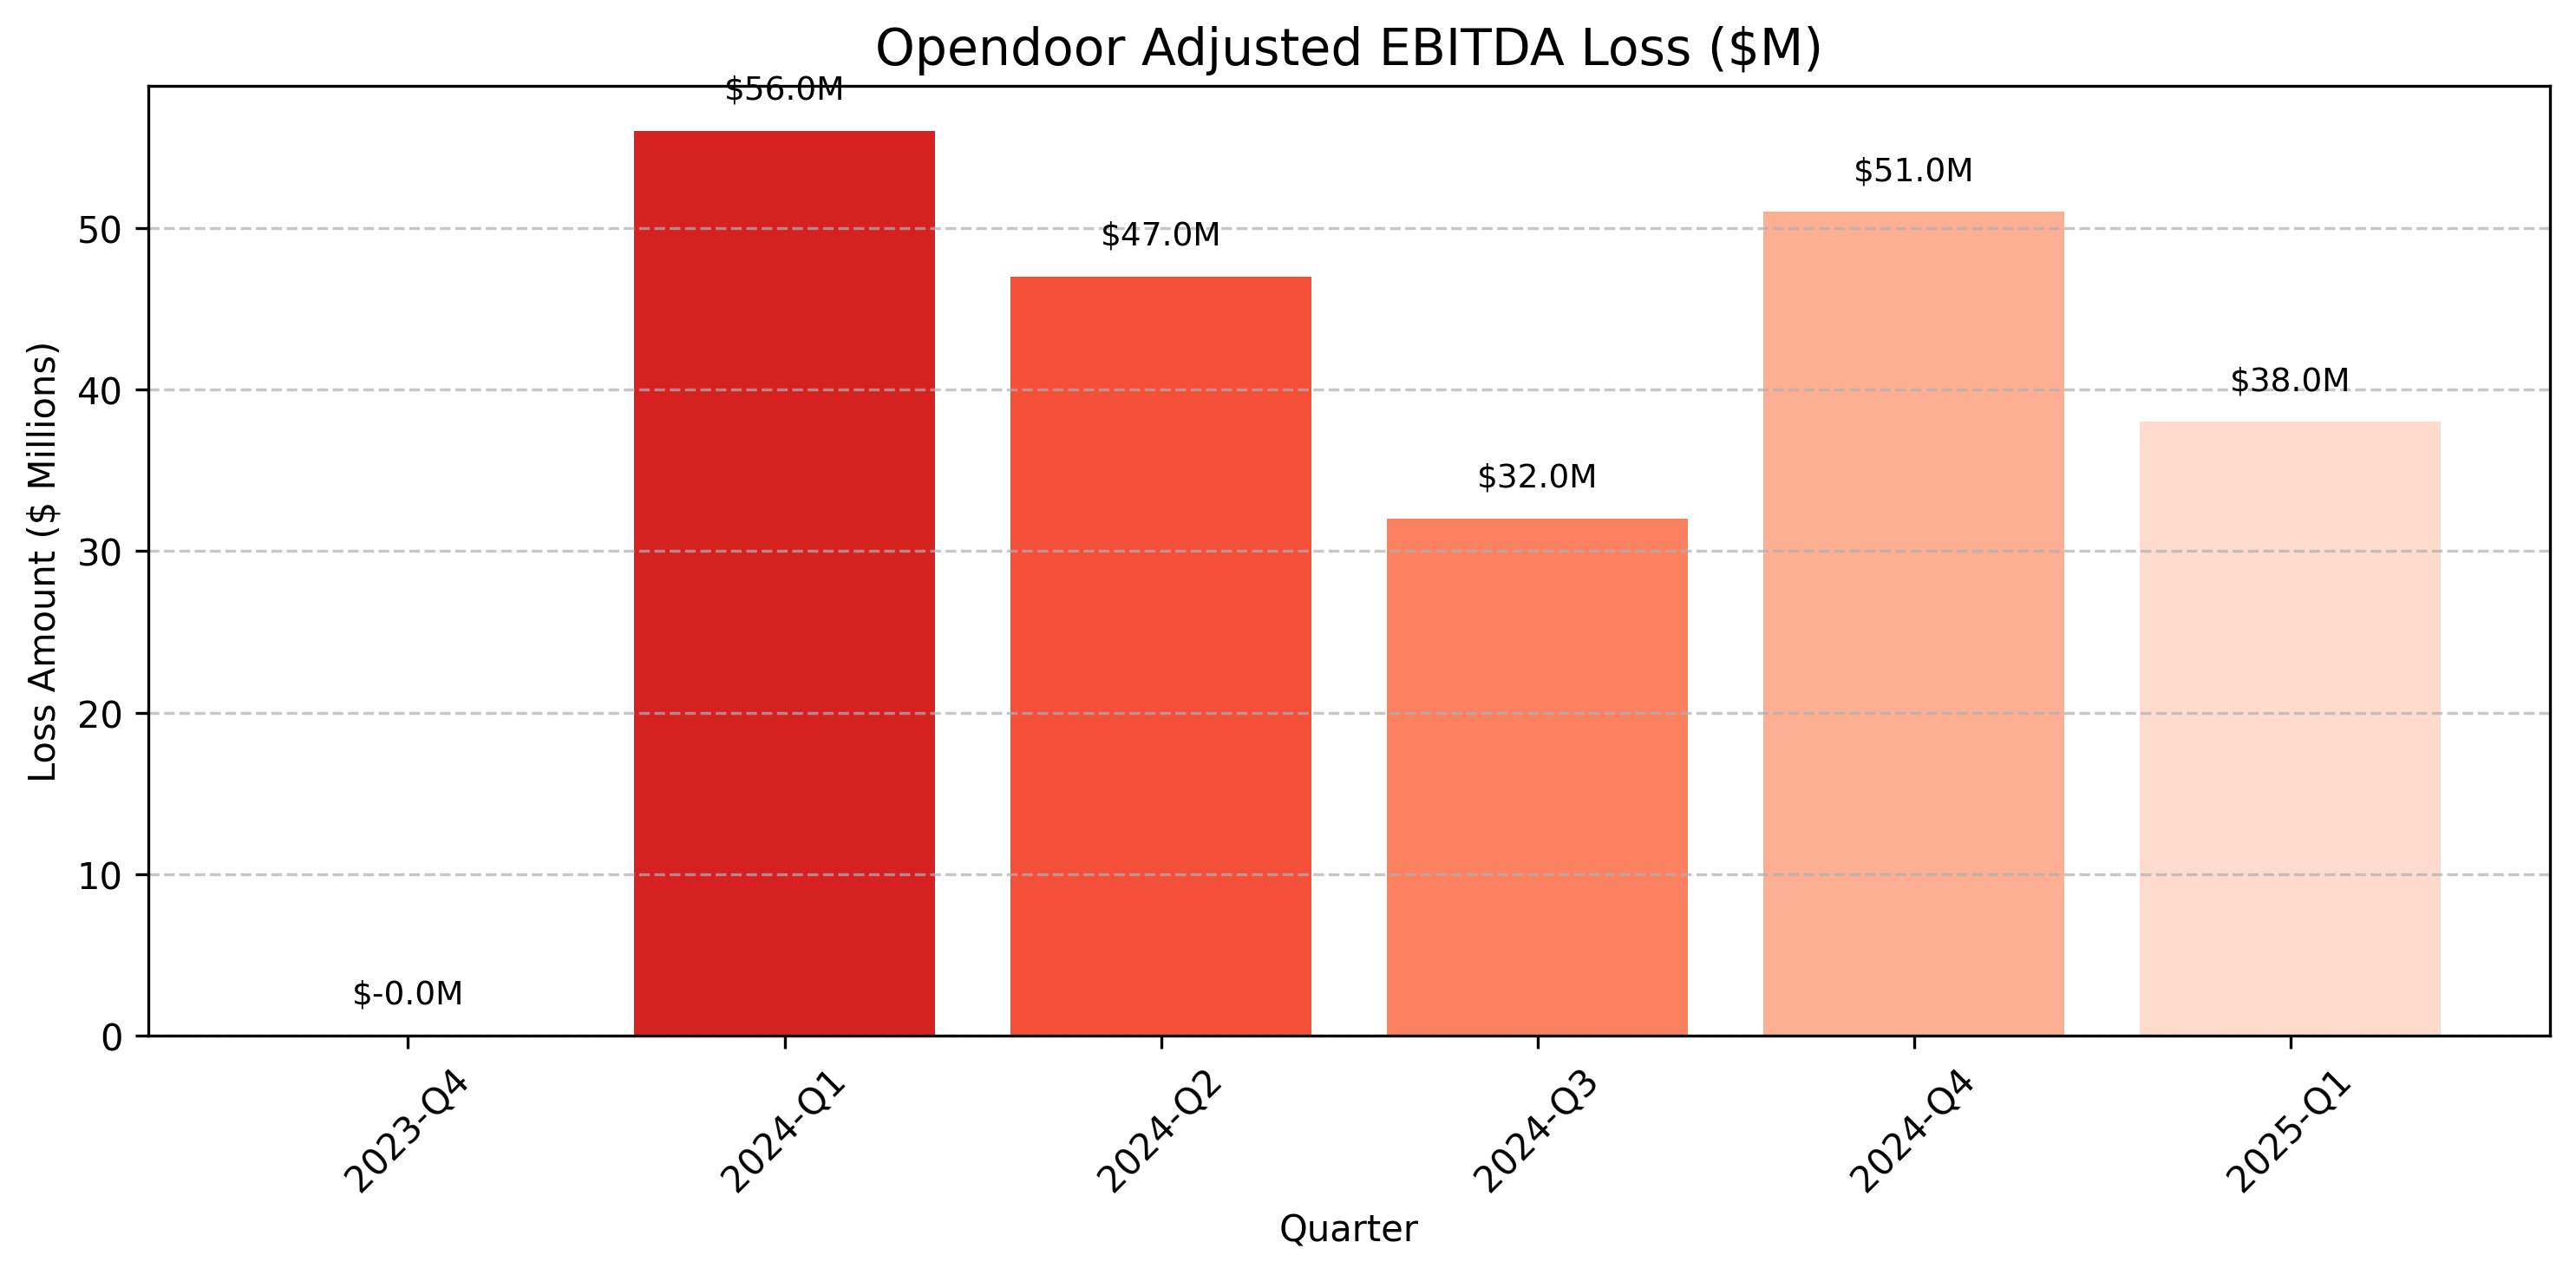
More telling than revenue figures alone has been Opendoor's progressive improvement in operational efficiency. The company has been steadily narrowing its losses, with adjusted EBITDA loss reduced to $38 million in Q1 2025 from $51 million in the previous quarter—a 25.5% improvement that signals potentially positive developments in its operational model. Year-over-year, the company has made significant strides in reducing its operating losses relative to revenue.
Balance Sheet Health Indicators
Opendoor's liquidity position remains a critical factor for its long-term viability. A current ratio of approximately 3.0 in Q1 2025 suggests strong short-term financial health, though this represents a decrease from the 5.7 ratio seen in Q4 2024. This change reflects a strategic redeployment of capital into inventory acquisition, preparing for anticipated market opportunities.
| Metric | Latest Quarter (Q1 2025) | Previous Quarter (Q4 2024) | Year-Ago Quarter (Q1 2024) |
|---|---|---|---|
| Revenue ($M) | 1,153.0 | 1,084.0 | 1,181.0 |
| Net Income ($M) | -85.0 | -113.0 | -109.0 |
| EPS ($) | -0.12 | -0.16 | -0.15 |
| Gross Margin (%) | 8.6% | 7.8% | 8.5% |
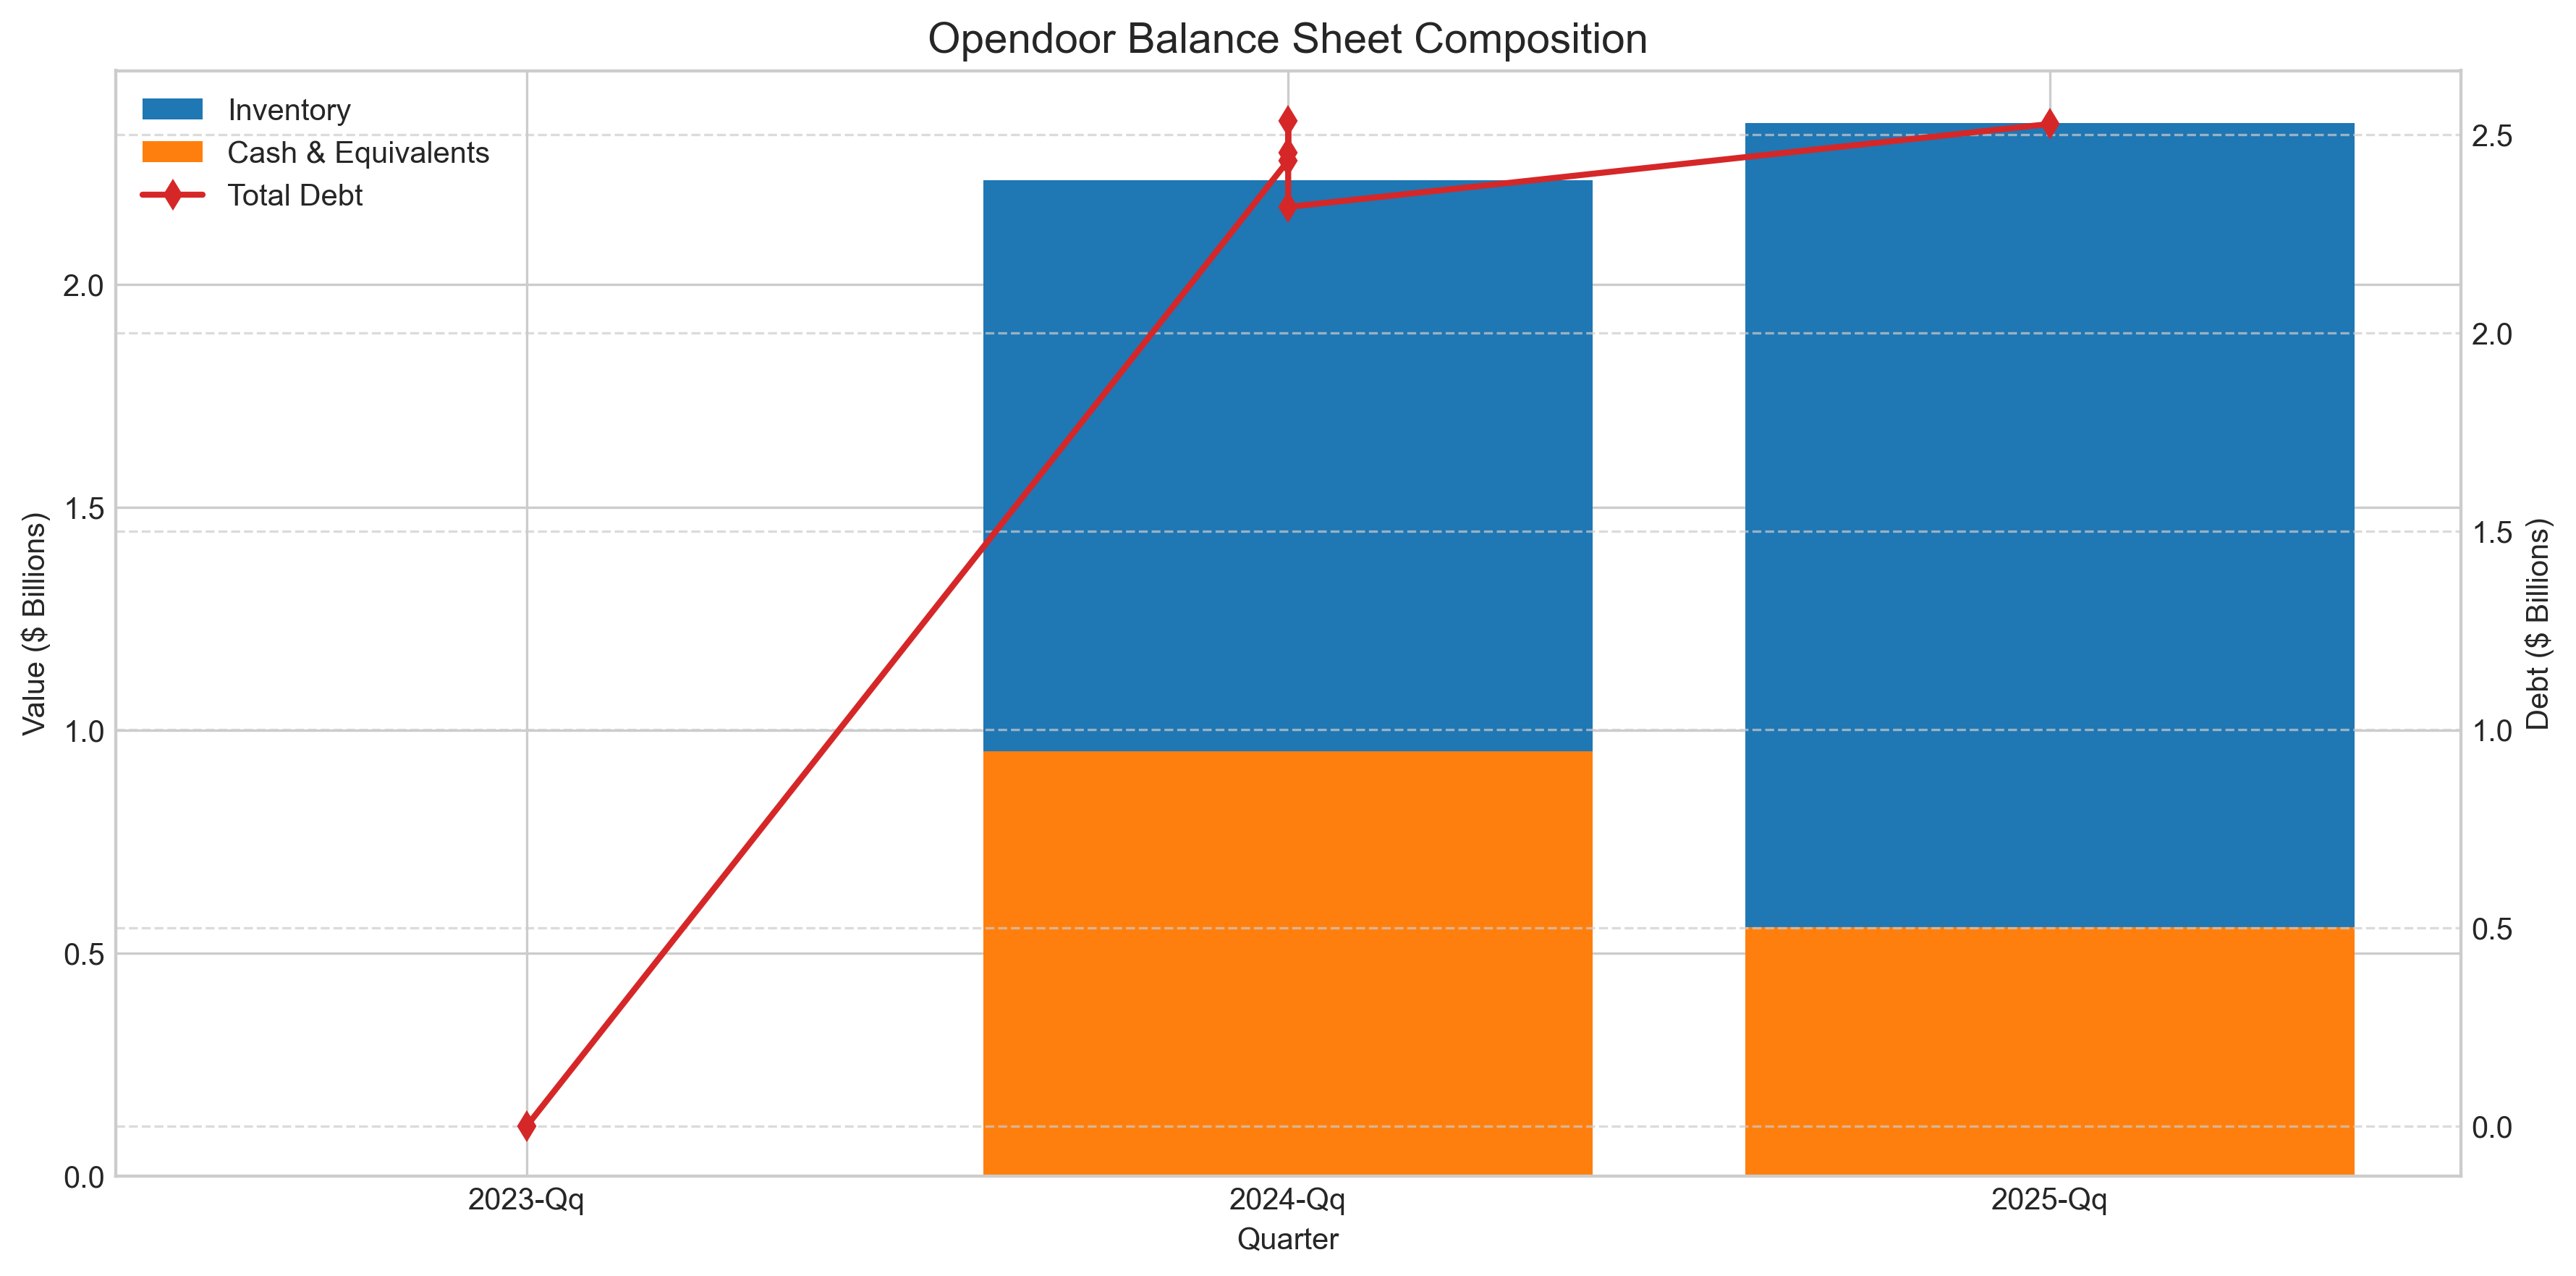
| Inventory ($B) | 2.36 | 2.16 | 1.44 |
| Cash ($M) | 559.0 | 671.0 | 560.0 |
| Debt ($B) | 2.53 | 2.32 | 2.11 |
| Current Ratio | 2.99 | 5.67 | 3.01 |
The company's inventory management strategy deserves particular attention, as housing inventory represents Opendoor's largest asset category and most significant risk exposure. At $2.36 billion in Q1 2025, inventory levels have increased 9.3% from the previous quarter and significantly from the year-ago period, indicating the company's confidence in near-term market conditions and its ability to efficiently cycle through properties.
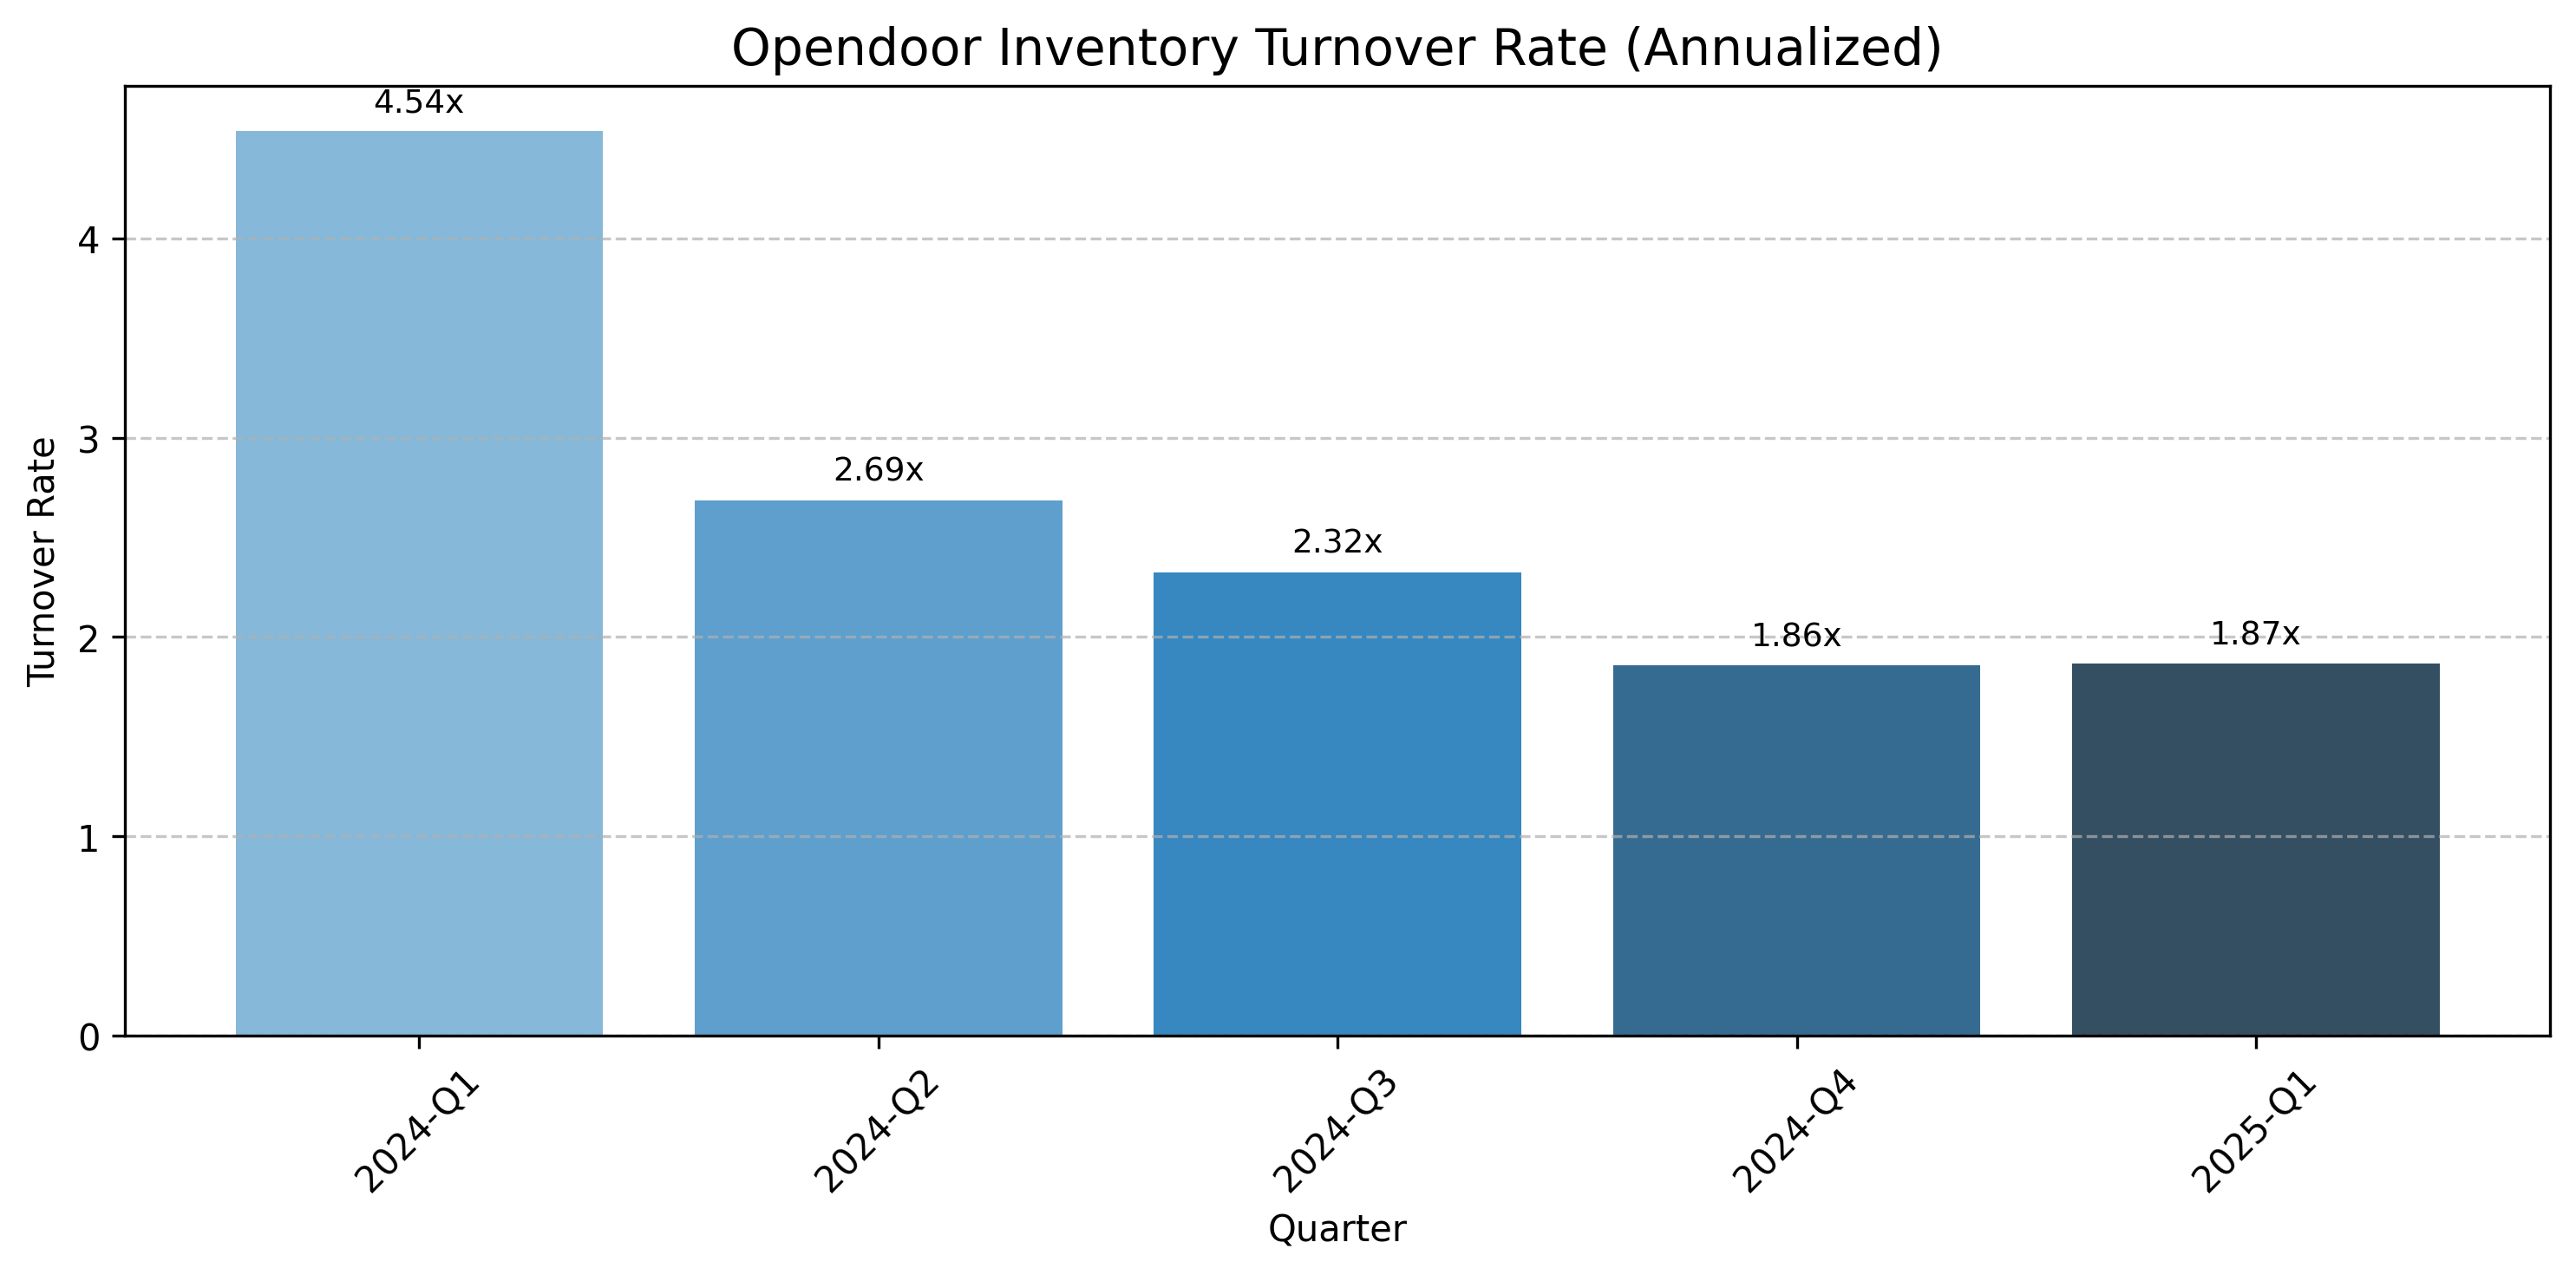
Opendoor's inventory turnover rates have stabilized around 1.9x (annualized) in recent quarters, down from the higher rates seen in early 2024. This reflects a strategic shift toward holding properties slightly longer to capture more value through targeted improvements and optimized selling strategies, rather than pursuing rapid turnover at the expense of margins.
Cash Flow Dynamics
Perhaps the most important metric for Opendoor's sustainability is its cash flow trajectory. The company's capital-intensive business model makes cash flow analysis essential for understanding its financial durability.
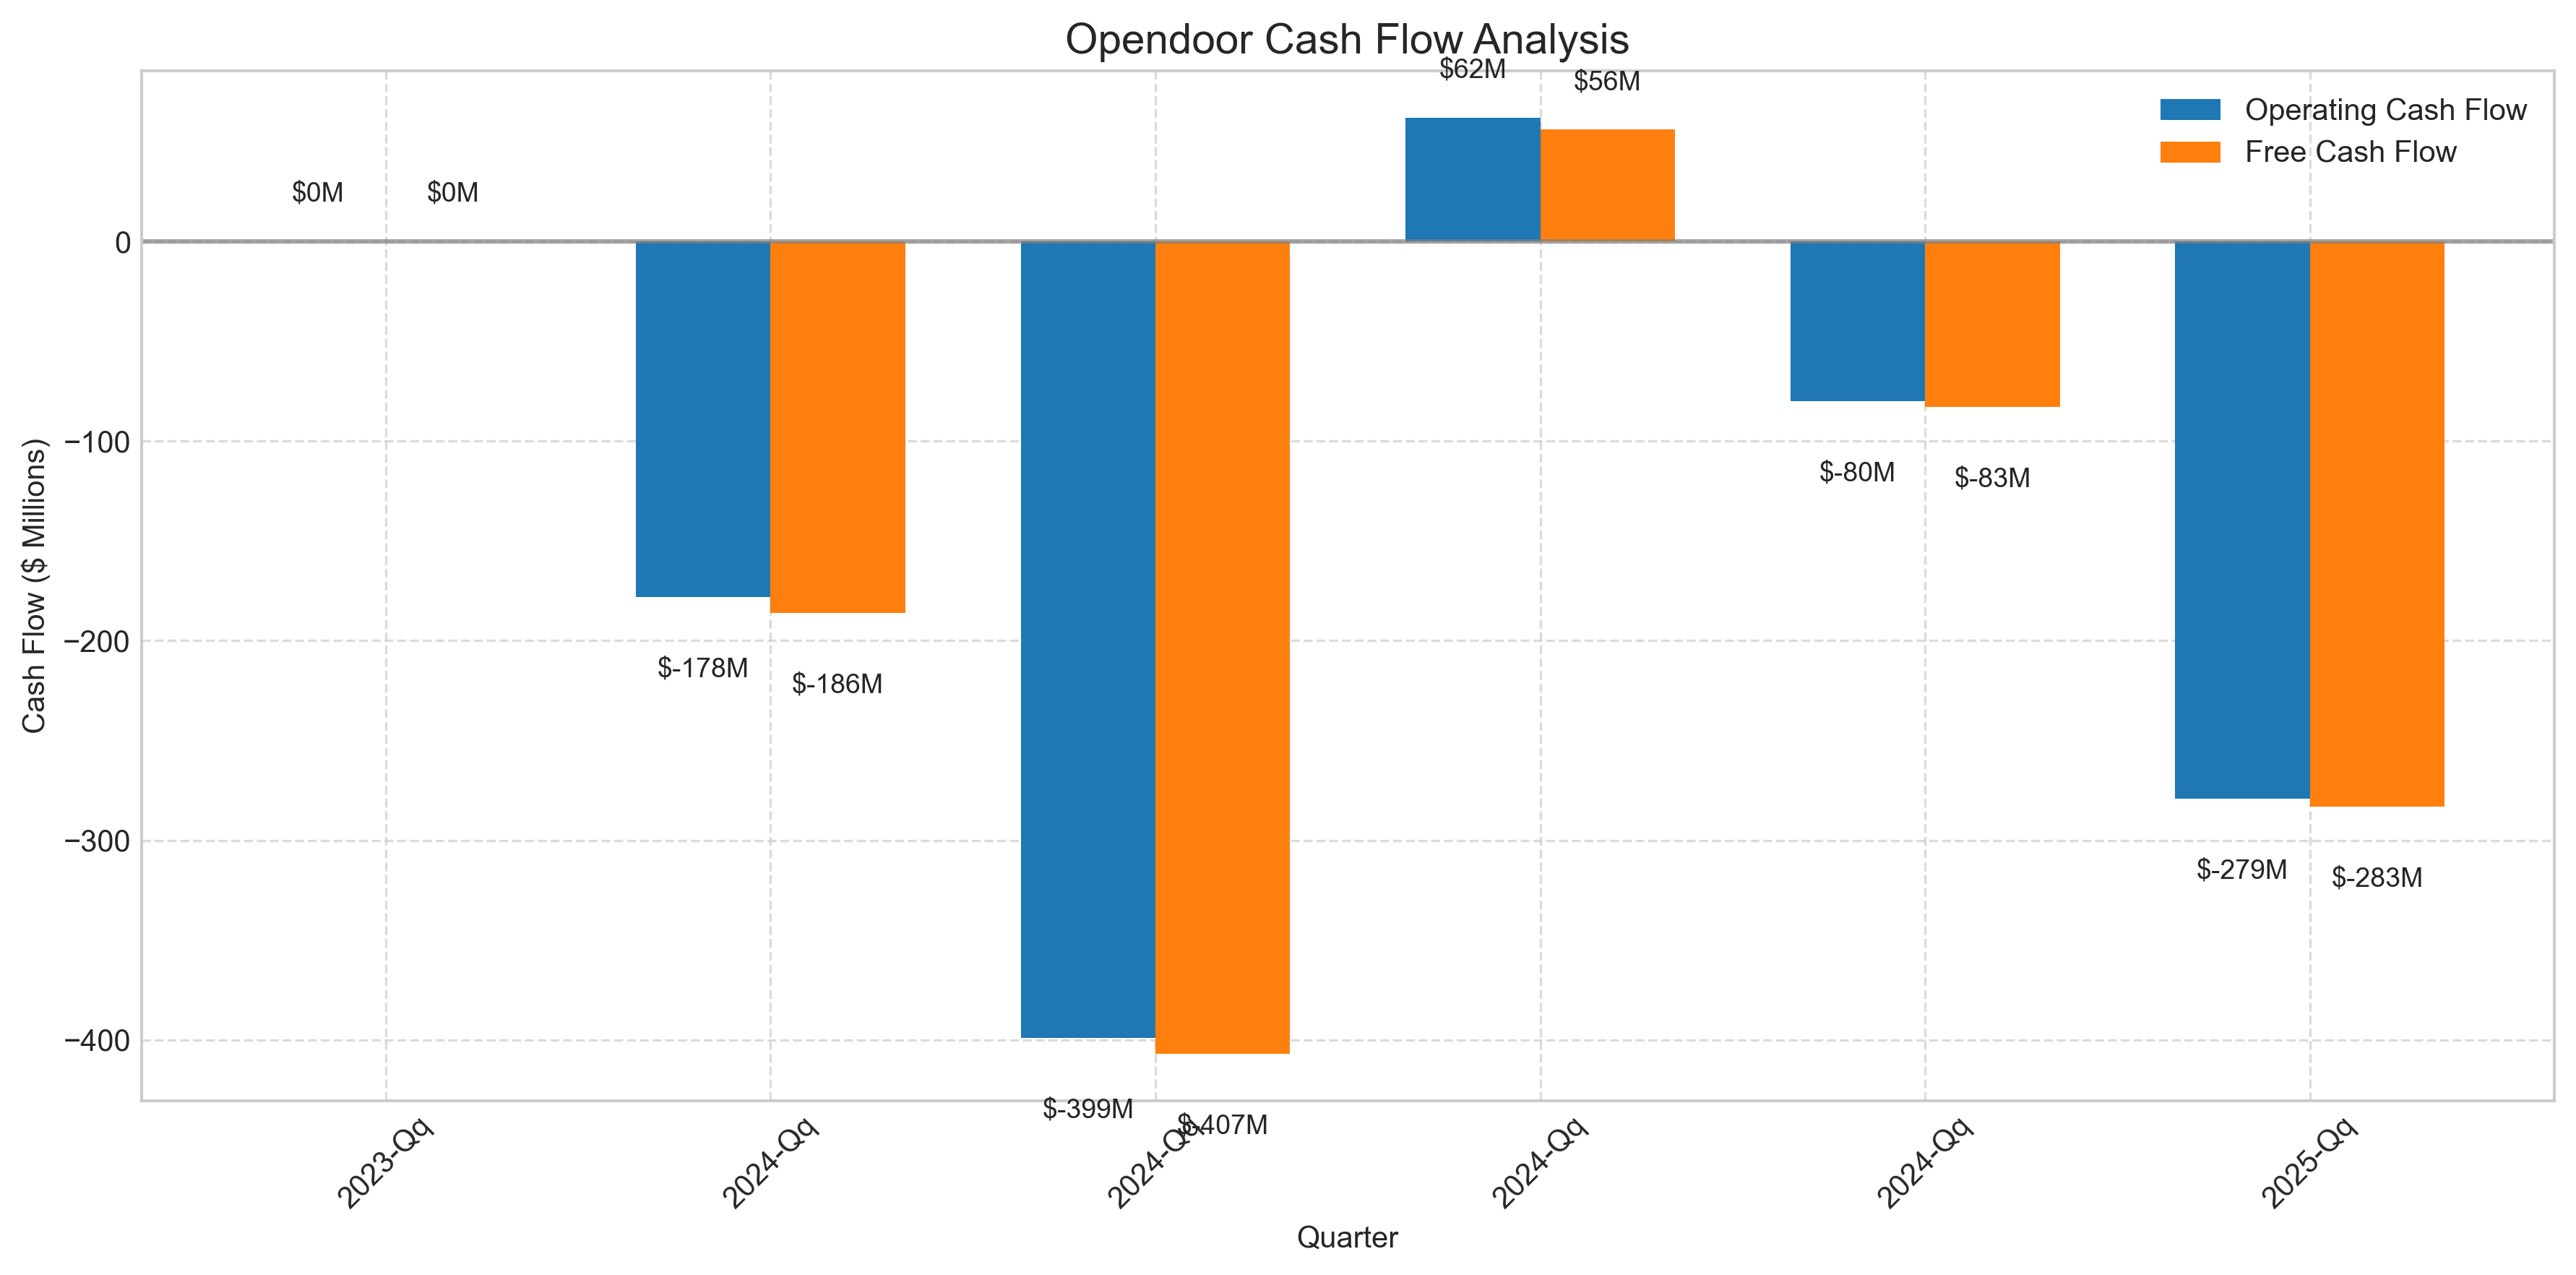
While still operating at negative cash flow in Q1 2025, the company's cash position remains substantial at $559 million, providing adequate runway for continued operations. Opendoor's strategic debt management, with $2.53 billion in total debt against $2.36 billion in inventory, suggests a well-calibrated balance sheet designed to support its capital-intensive business model through varying market conditions.
Looking Forward
As Opendoor prepares to announce its Q2 2025 results on August 5th, investors will be watching for continued improvement in operational efficiency and further progress toward profitability. The company's ability to manage its balance sheet while navigating housing market fluctuations will likely determine its long-term success in the competitive proptech landscape.
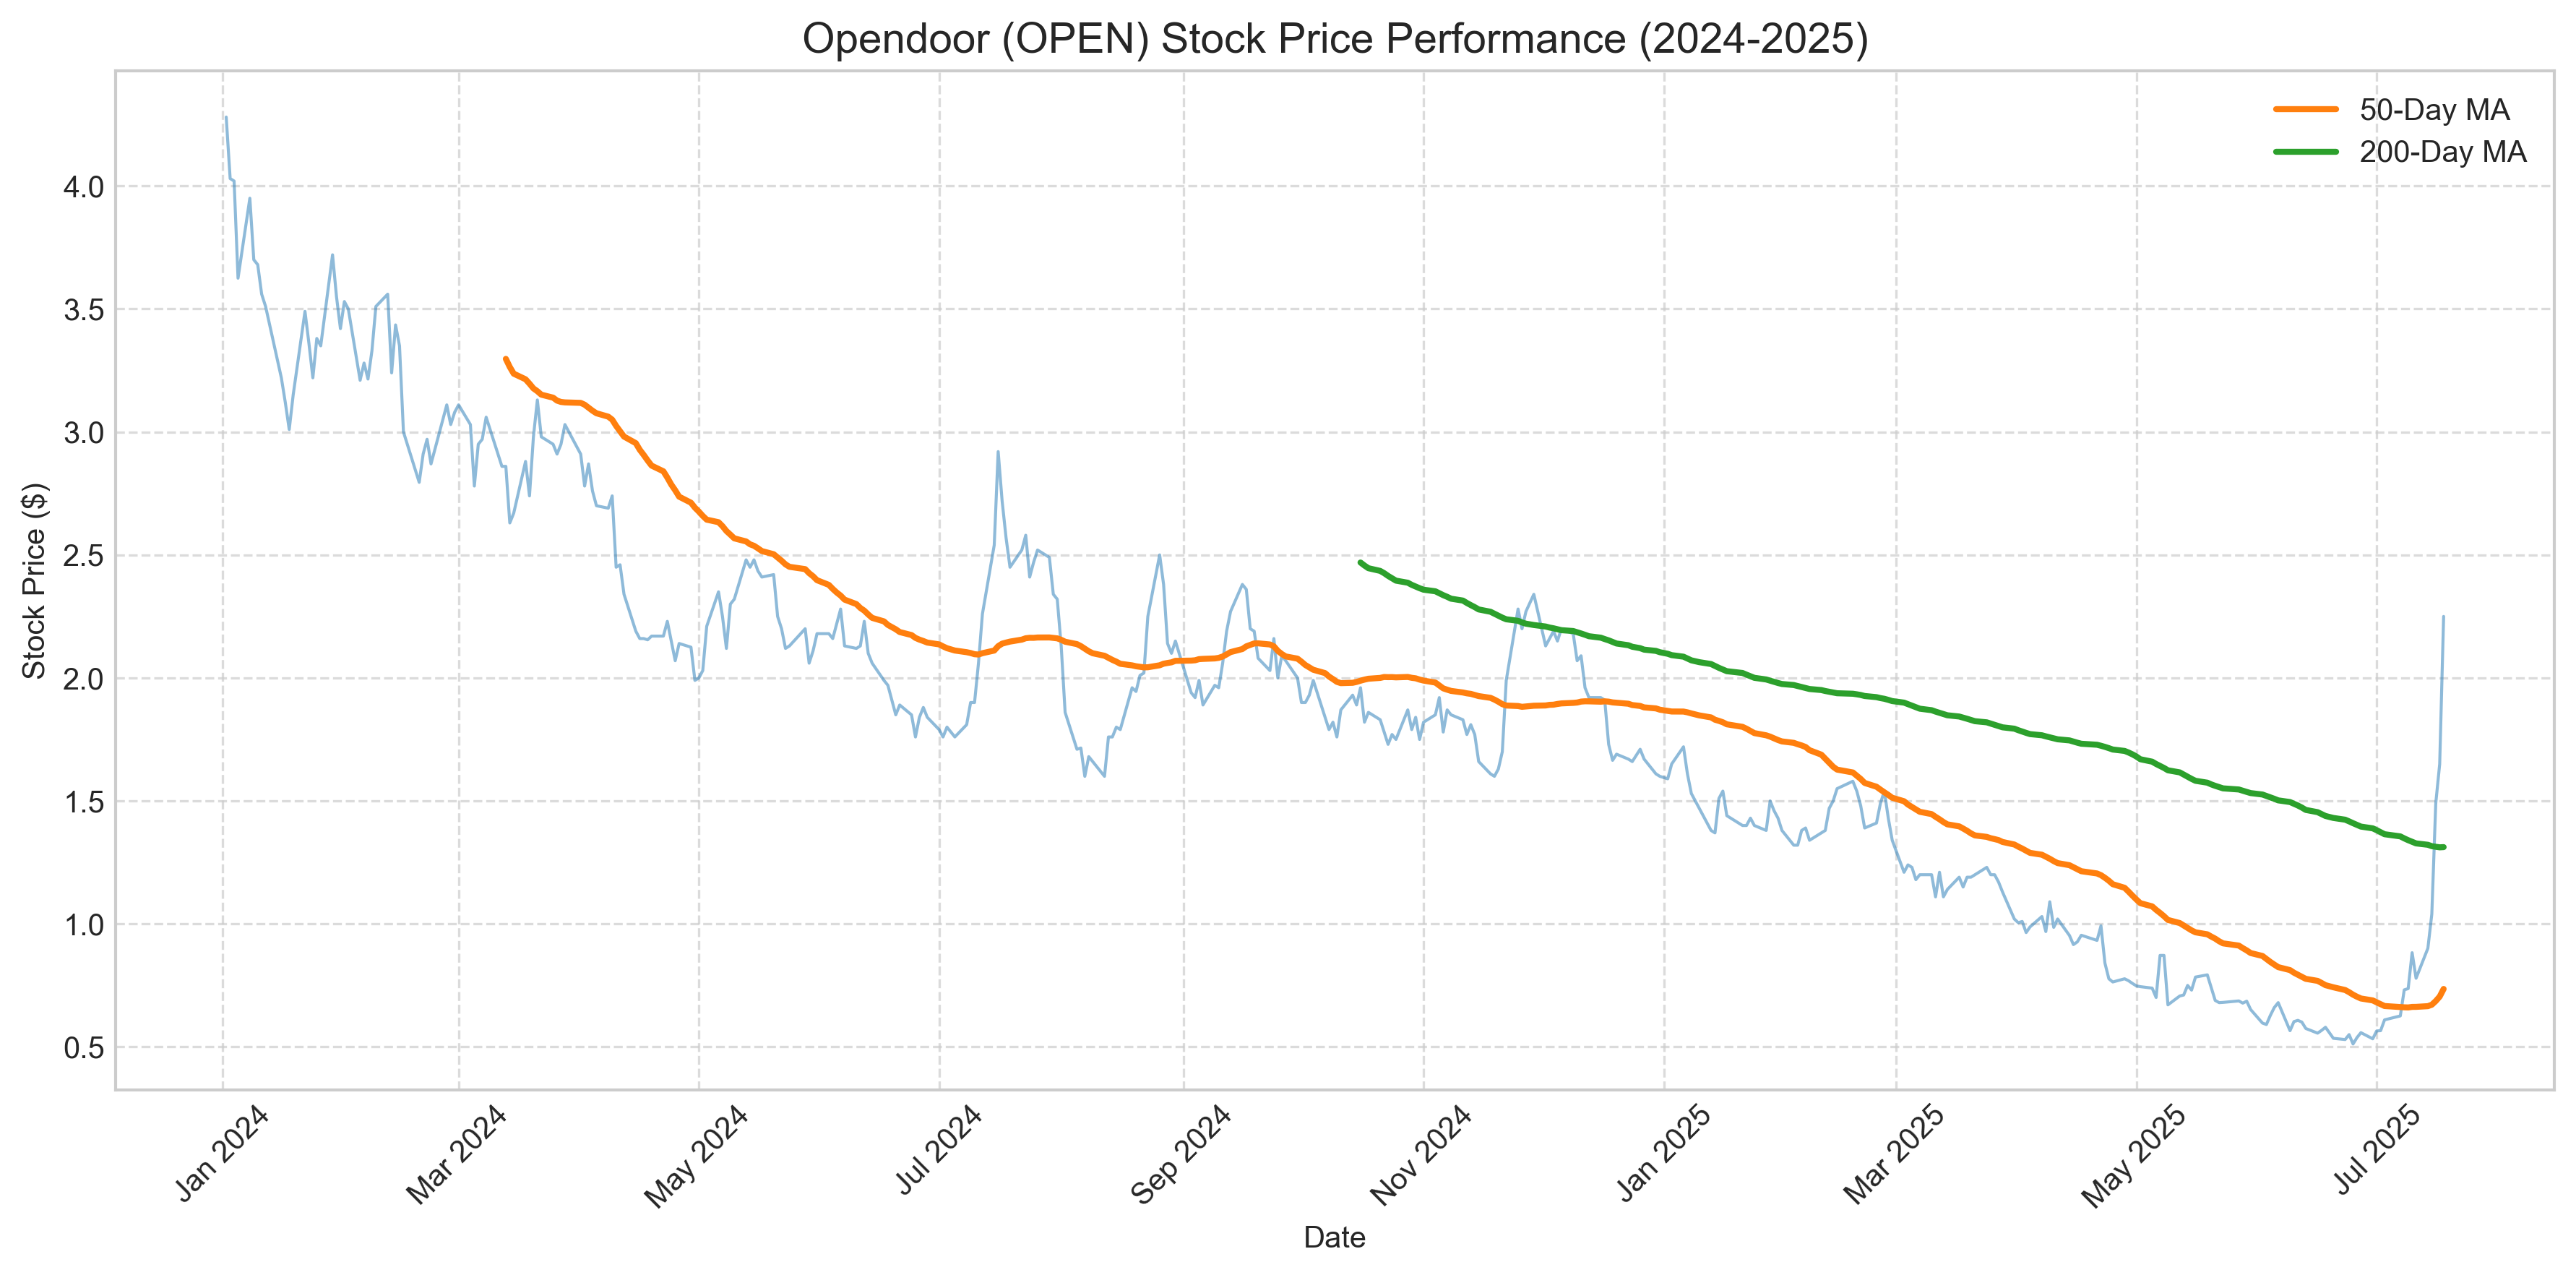
The stock's performance, while volatile, has shown signs of stabilization as the company's financial metrics improve. With the upcoming earnings release, market participants will gain fresh insights into whether Opendoor's financial transformation is gaining momentum or facing new headwinds in its quest for sustainable growth.
- Net losses have narrowed by 24.8% from Q1 2024 to Q1 2025, indicating progress toward breakeven operations
- Gross margins have improved to 8.6% in Q1 2025, up from 7.8% in the previous quarter
- Balance sheet optimization continues with strategic inventory growth and debt management
- Cash position remains strong at $559 million, providing operational runway
- Current ratio of 2.99 demonstrates solid short-term liquidity despite capital-intensive operations
Comments (0)
No comments yet. Be the first to comment!