Understanding the Operational Efficiency Champion Ranking
When companies grow, they don't always become more profitable. Some expand their sales while actually becoming less efficient. Our analysis identifies businesses that are achieving the impressive double-feat of growing while simultaneously becoming more efficient at turning revenue into earnings.
What Do These Metrics Mean? A Simple Explanation
Our ranking uses three key metrics that, when combined, tell a powerful story about a company's operational performance. Let's break them down in simple terms:
- <strong>EBITDA Margin</strong>: This is the percentage of revenue that turns into earnings before interest, taxes, depreciation, and amortization (EBITDA). Think of it as how many cents of profit a company keeps from each dollar of sales, before accounting for certain expenses. A higher margin means greater efficiency.
- <strong>EBITDA Margin Change</strong>: This shows how much a company's efficiency has improved over time. A positive percentage means the company is keeping more profit from each dollar of sales than it used to.
- <strong>Revenue Growth</strong>: This measures how much a company's sales have increased, showing if the business is expanding.
- <strong>EBITDA Growth</strong>: This shows how much a company's earnings (before certain expenses) have grown, indicating if profits are increasing faster, slower, or in line with sales.
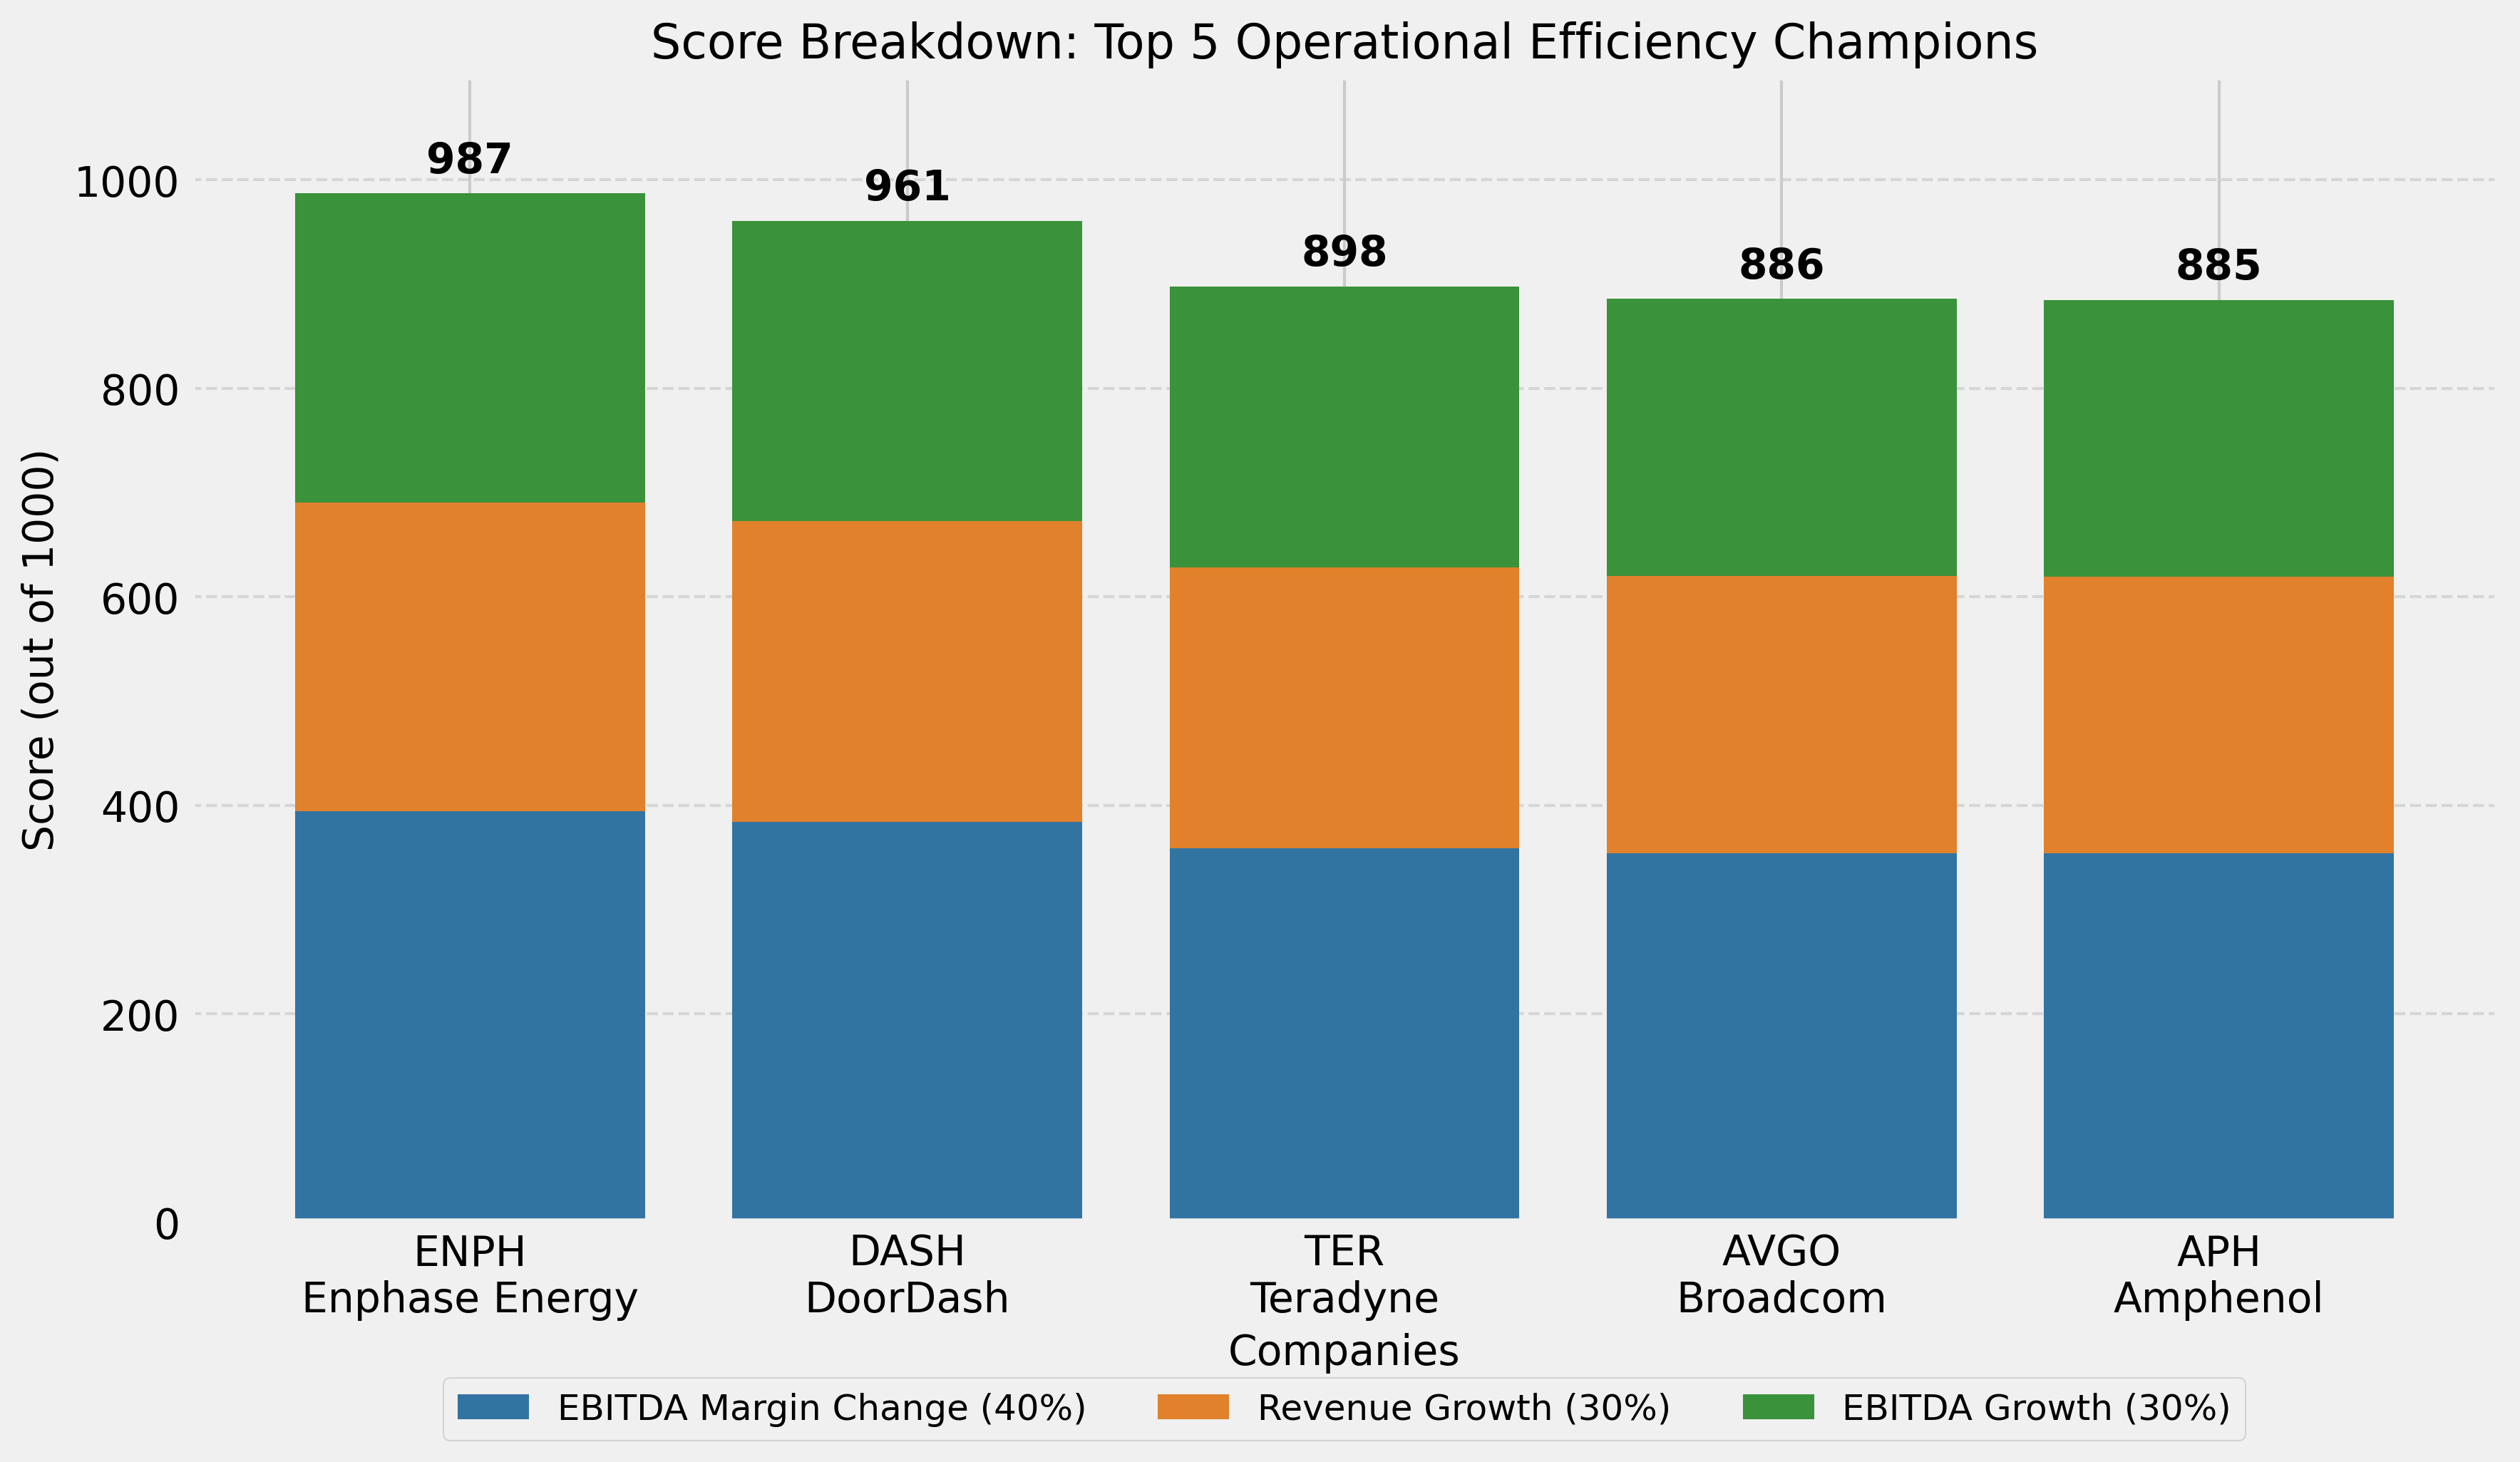
The total score (out of 1000 points) combines these metrics, with 40% weight given to margin improvement and 30% each to revenue and EBITDA growth. This rewards companies that are becoming more efficient while continuing to grow.
How Are These Numbers Calculated?
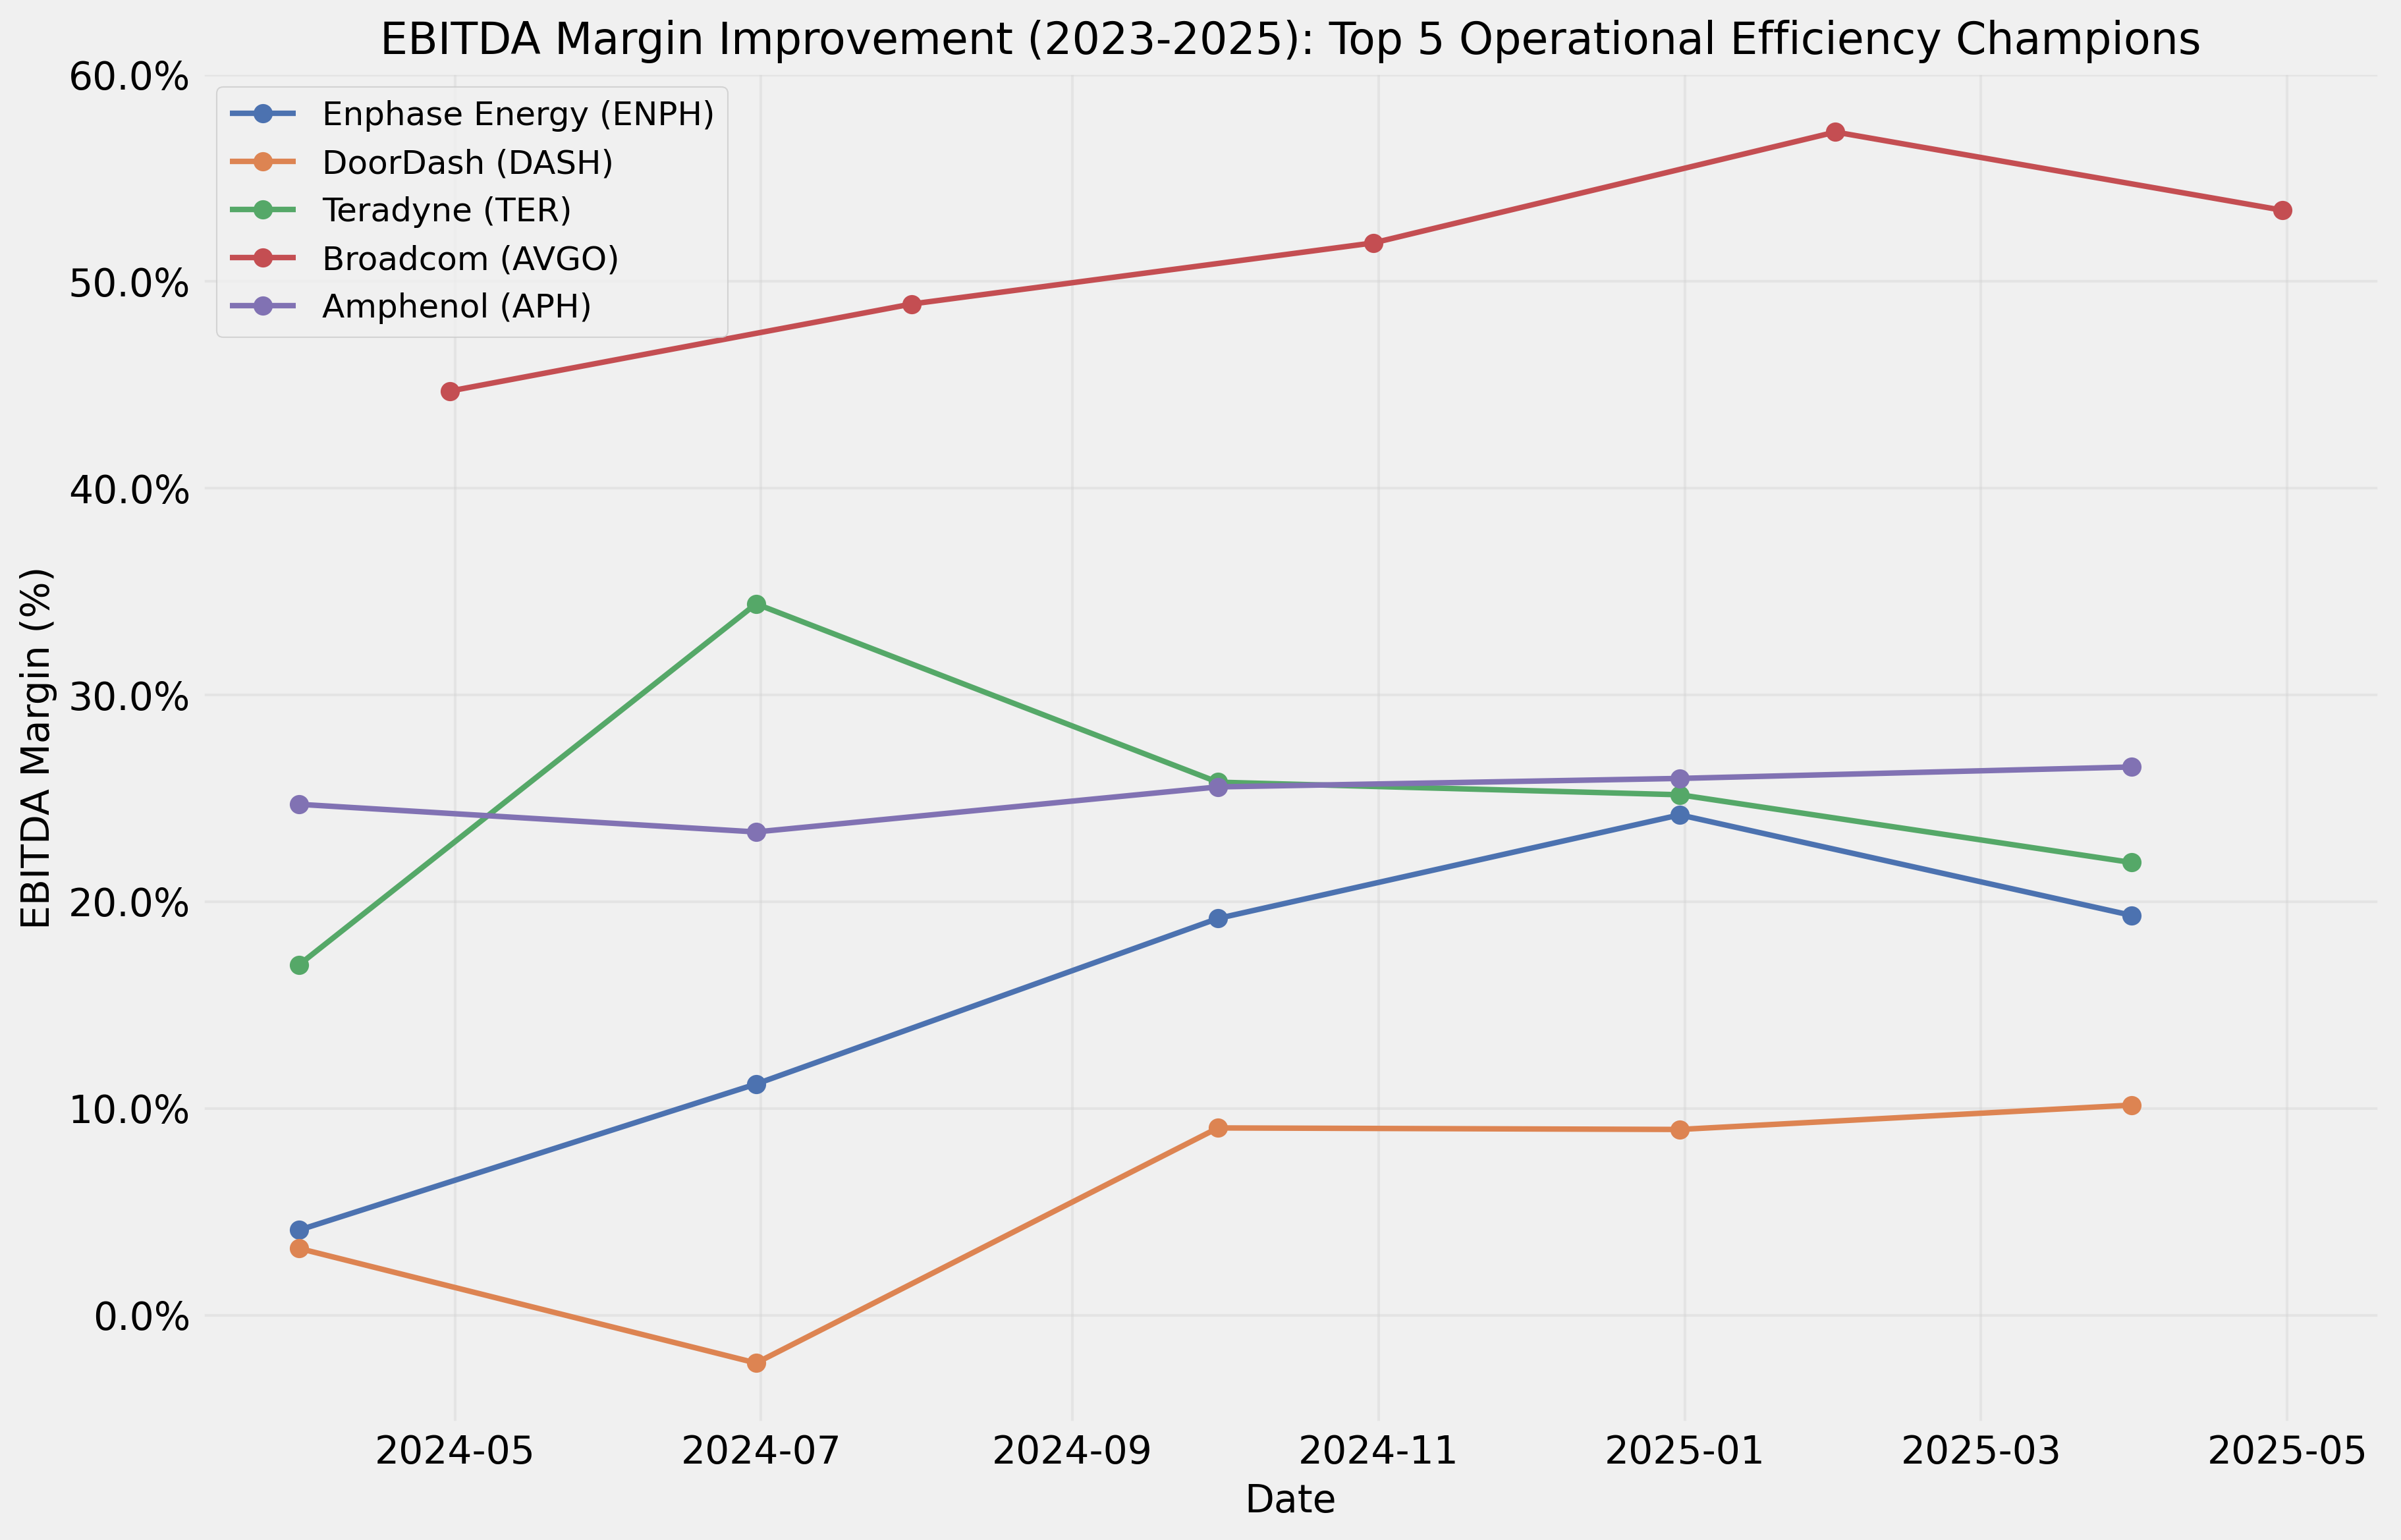
Let's use the top performer, Enphase Energy (ENPH), as an example to show exactly how these calculations work:
- <strong>Starting point</strong> (March 31, 2024): Revenue was $263.3 million, EBITDA was $10.8 million, giving an EBITDA margin of 4.11%.
- <strong>Ending point</strong> (March 31, 2025): Revenue grew to $356.1 million, EBITDA jumped to $68.9 million, resulting in an EBITDA margin of 19.34%.
- <strong>EBITDA Margin Change</strong>: ((19.34% - 4.11%) ÷ 4.11%) × 100 = 370.01% improvement
- <strong>Revenue Growth</strong>: ((356.1 - 263.3) ÷ 263.3) × 100 = 35.22% increase
- <strong>EBITDA Growth</strong>: ((68.9 - 10.8) ÷ 10.8) × 100 = 535.55% increase
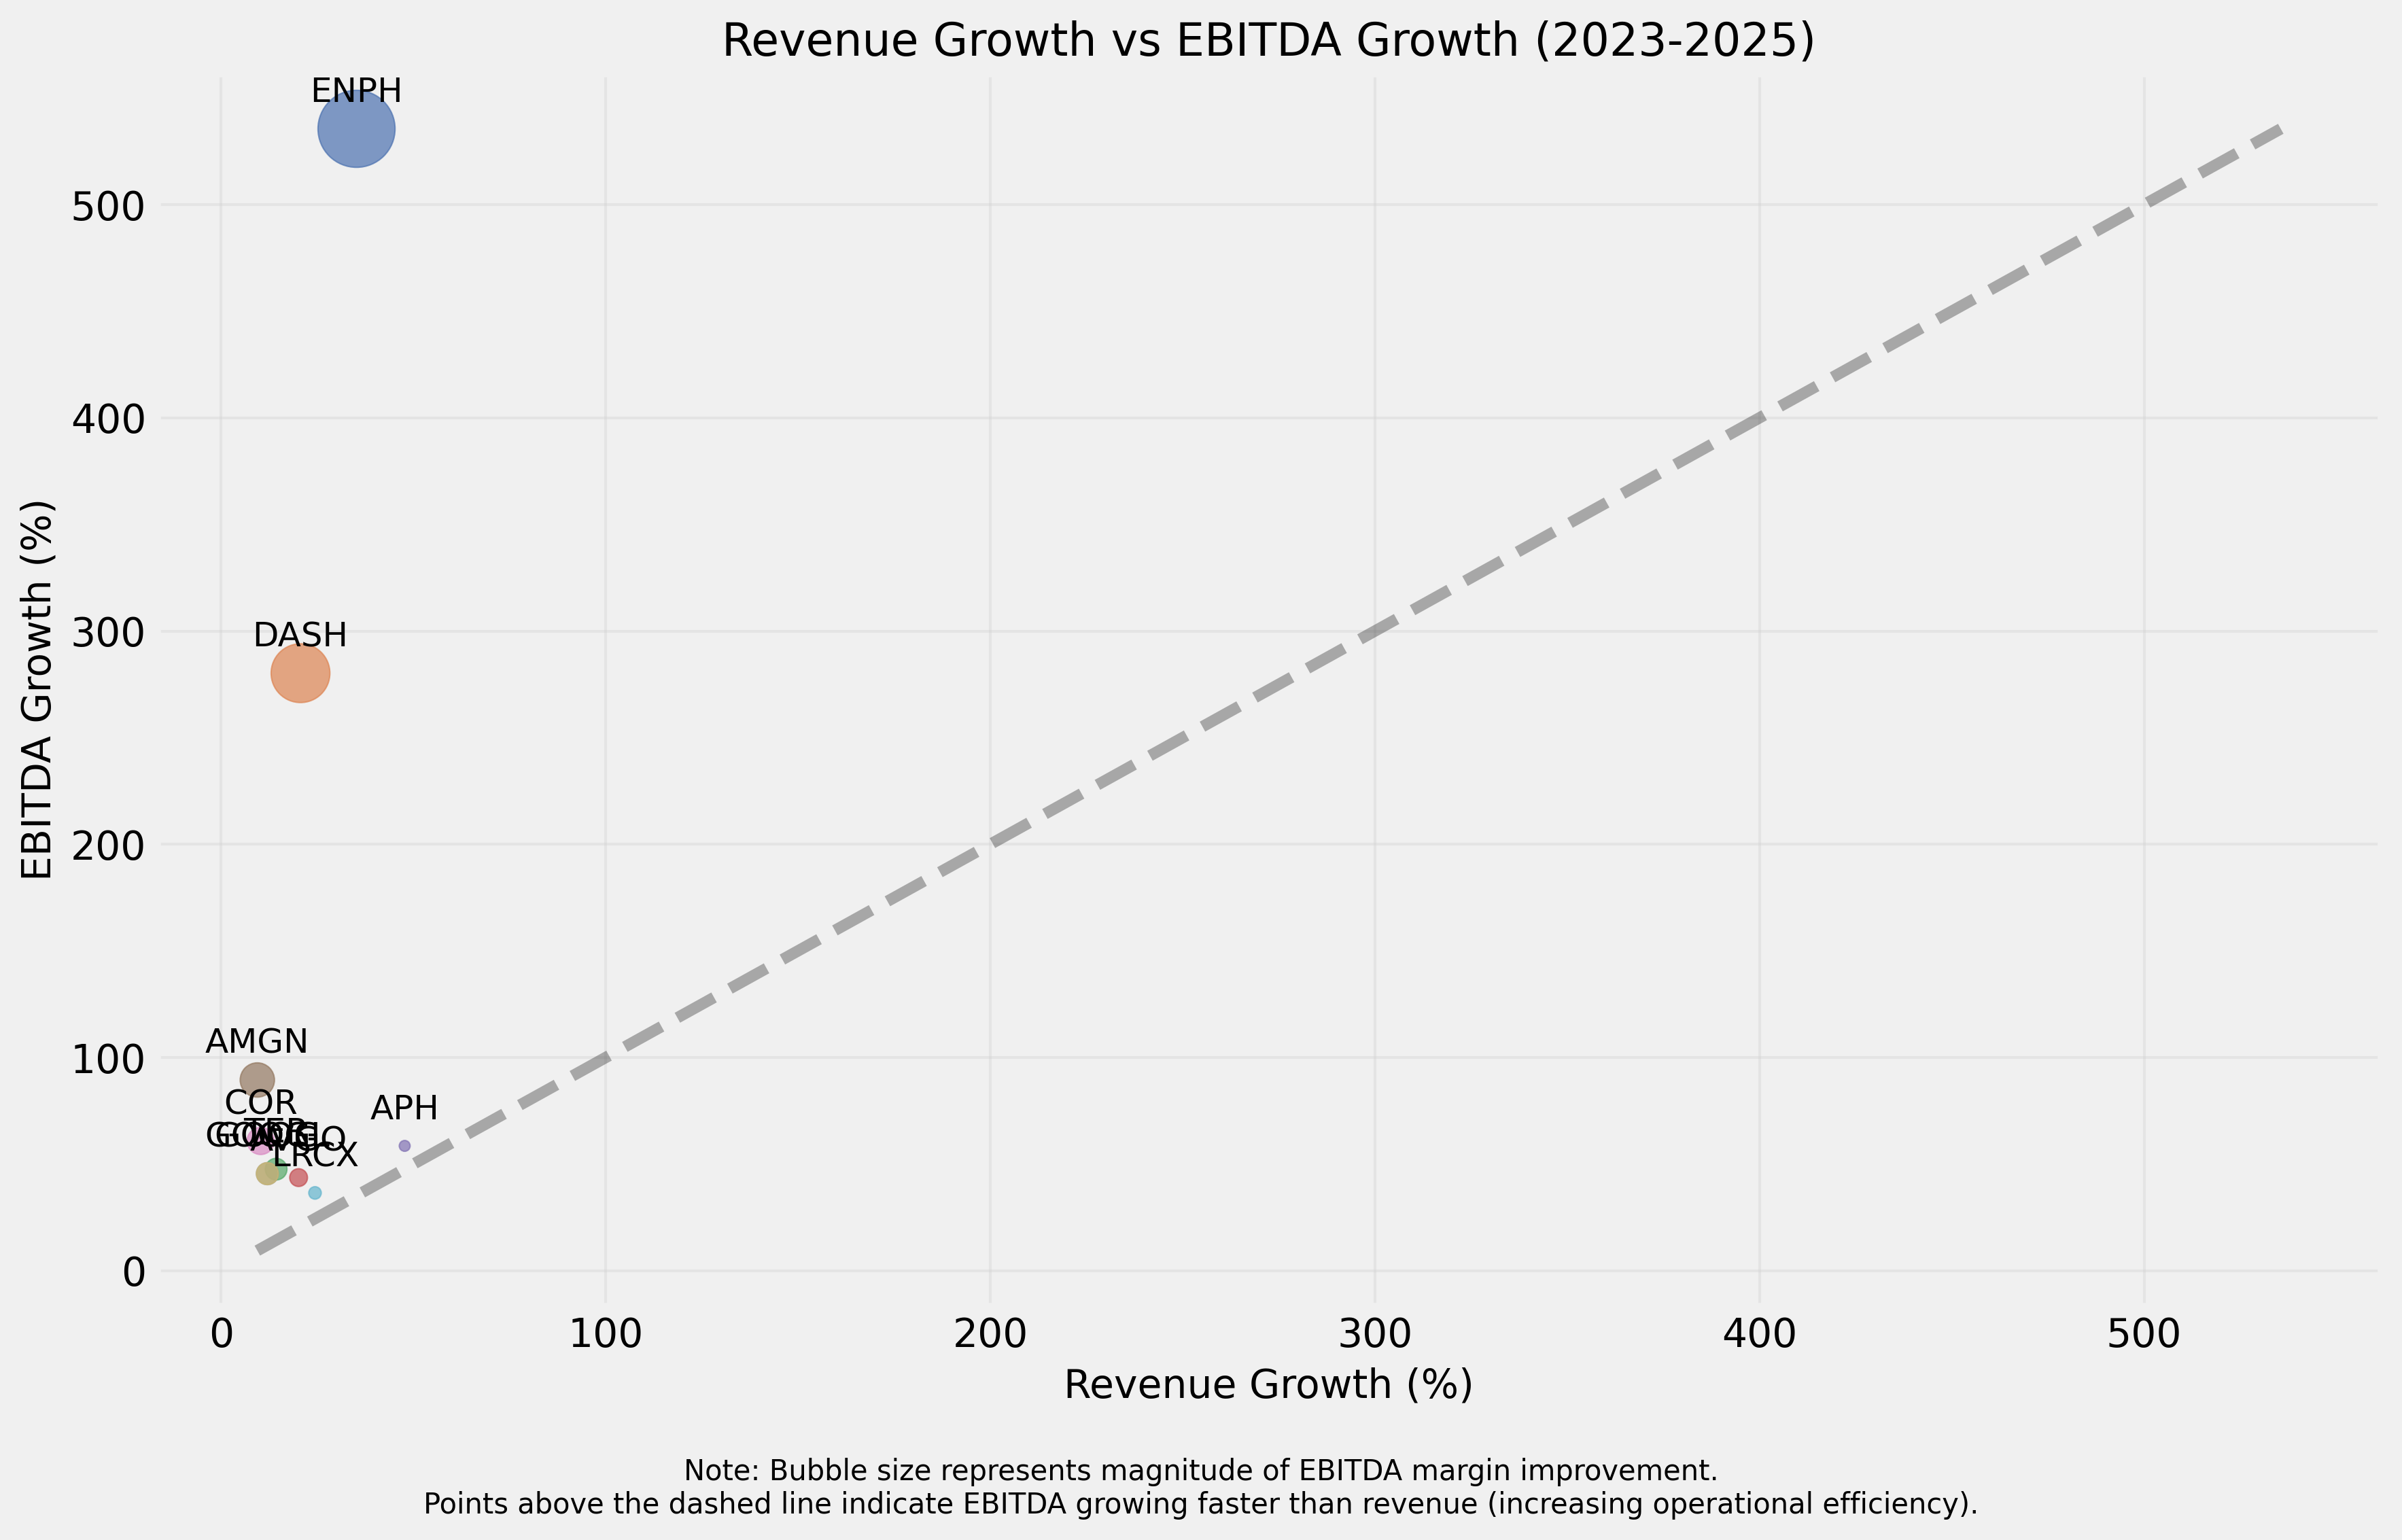
Notice that Enphase's EBITDA (earnings) grew much faster than its revenue. This means the company isn't just selling more—it's dramatically improving how efficiently it converts sales into profits.
The Top Performers: What Makes Them Special?
The companies at the top of our ranking aren't just growing—they're becoming significantly more efficient as they expand. Let's look at what makes our top three performers stand out:
- <strong>Enphase Energy (ENPH)</strong>: This clean energy technology company achieved an extraordinary 370% improvement in EBITDA margin while growing revenue by 35%. This means Enphase is converting much more of its sales into earnings now compared to a year ago, possibly through economies of scale, improved manufacturing processes, or higher-margin products.
- <strong>DoorDash (DASH)</strong>: The food delivery platform improved its EBITDA margin by 215% while growing revenue by about 21%. As a digital platform, DoorDash demonstrates how tech companies can achieve significant operational leverage as they scale.
- <strong>Teradyne (TER)</strong>: This semiconductor testing equipment company improved margins by 29% while growing revenue by 14%. Though less dramatic than our top two performers, this balanced growth with efficiency improvement is still impressive.
Breaking Down the Scoring System
Our ranking uses a 1000-point system that rewards companies based on three factors. The chart below shows how the top 5 companies earned their scores:
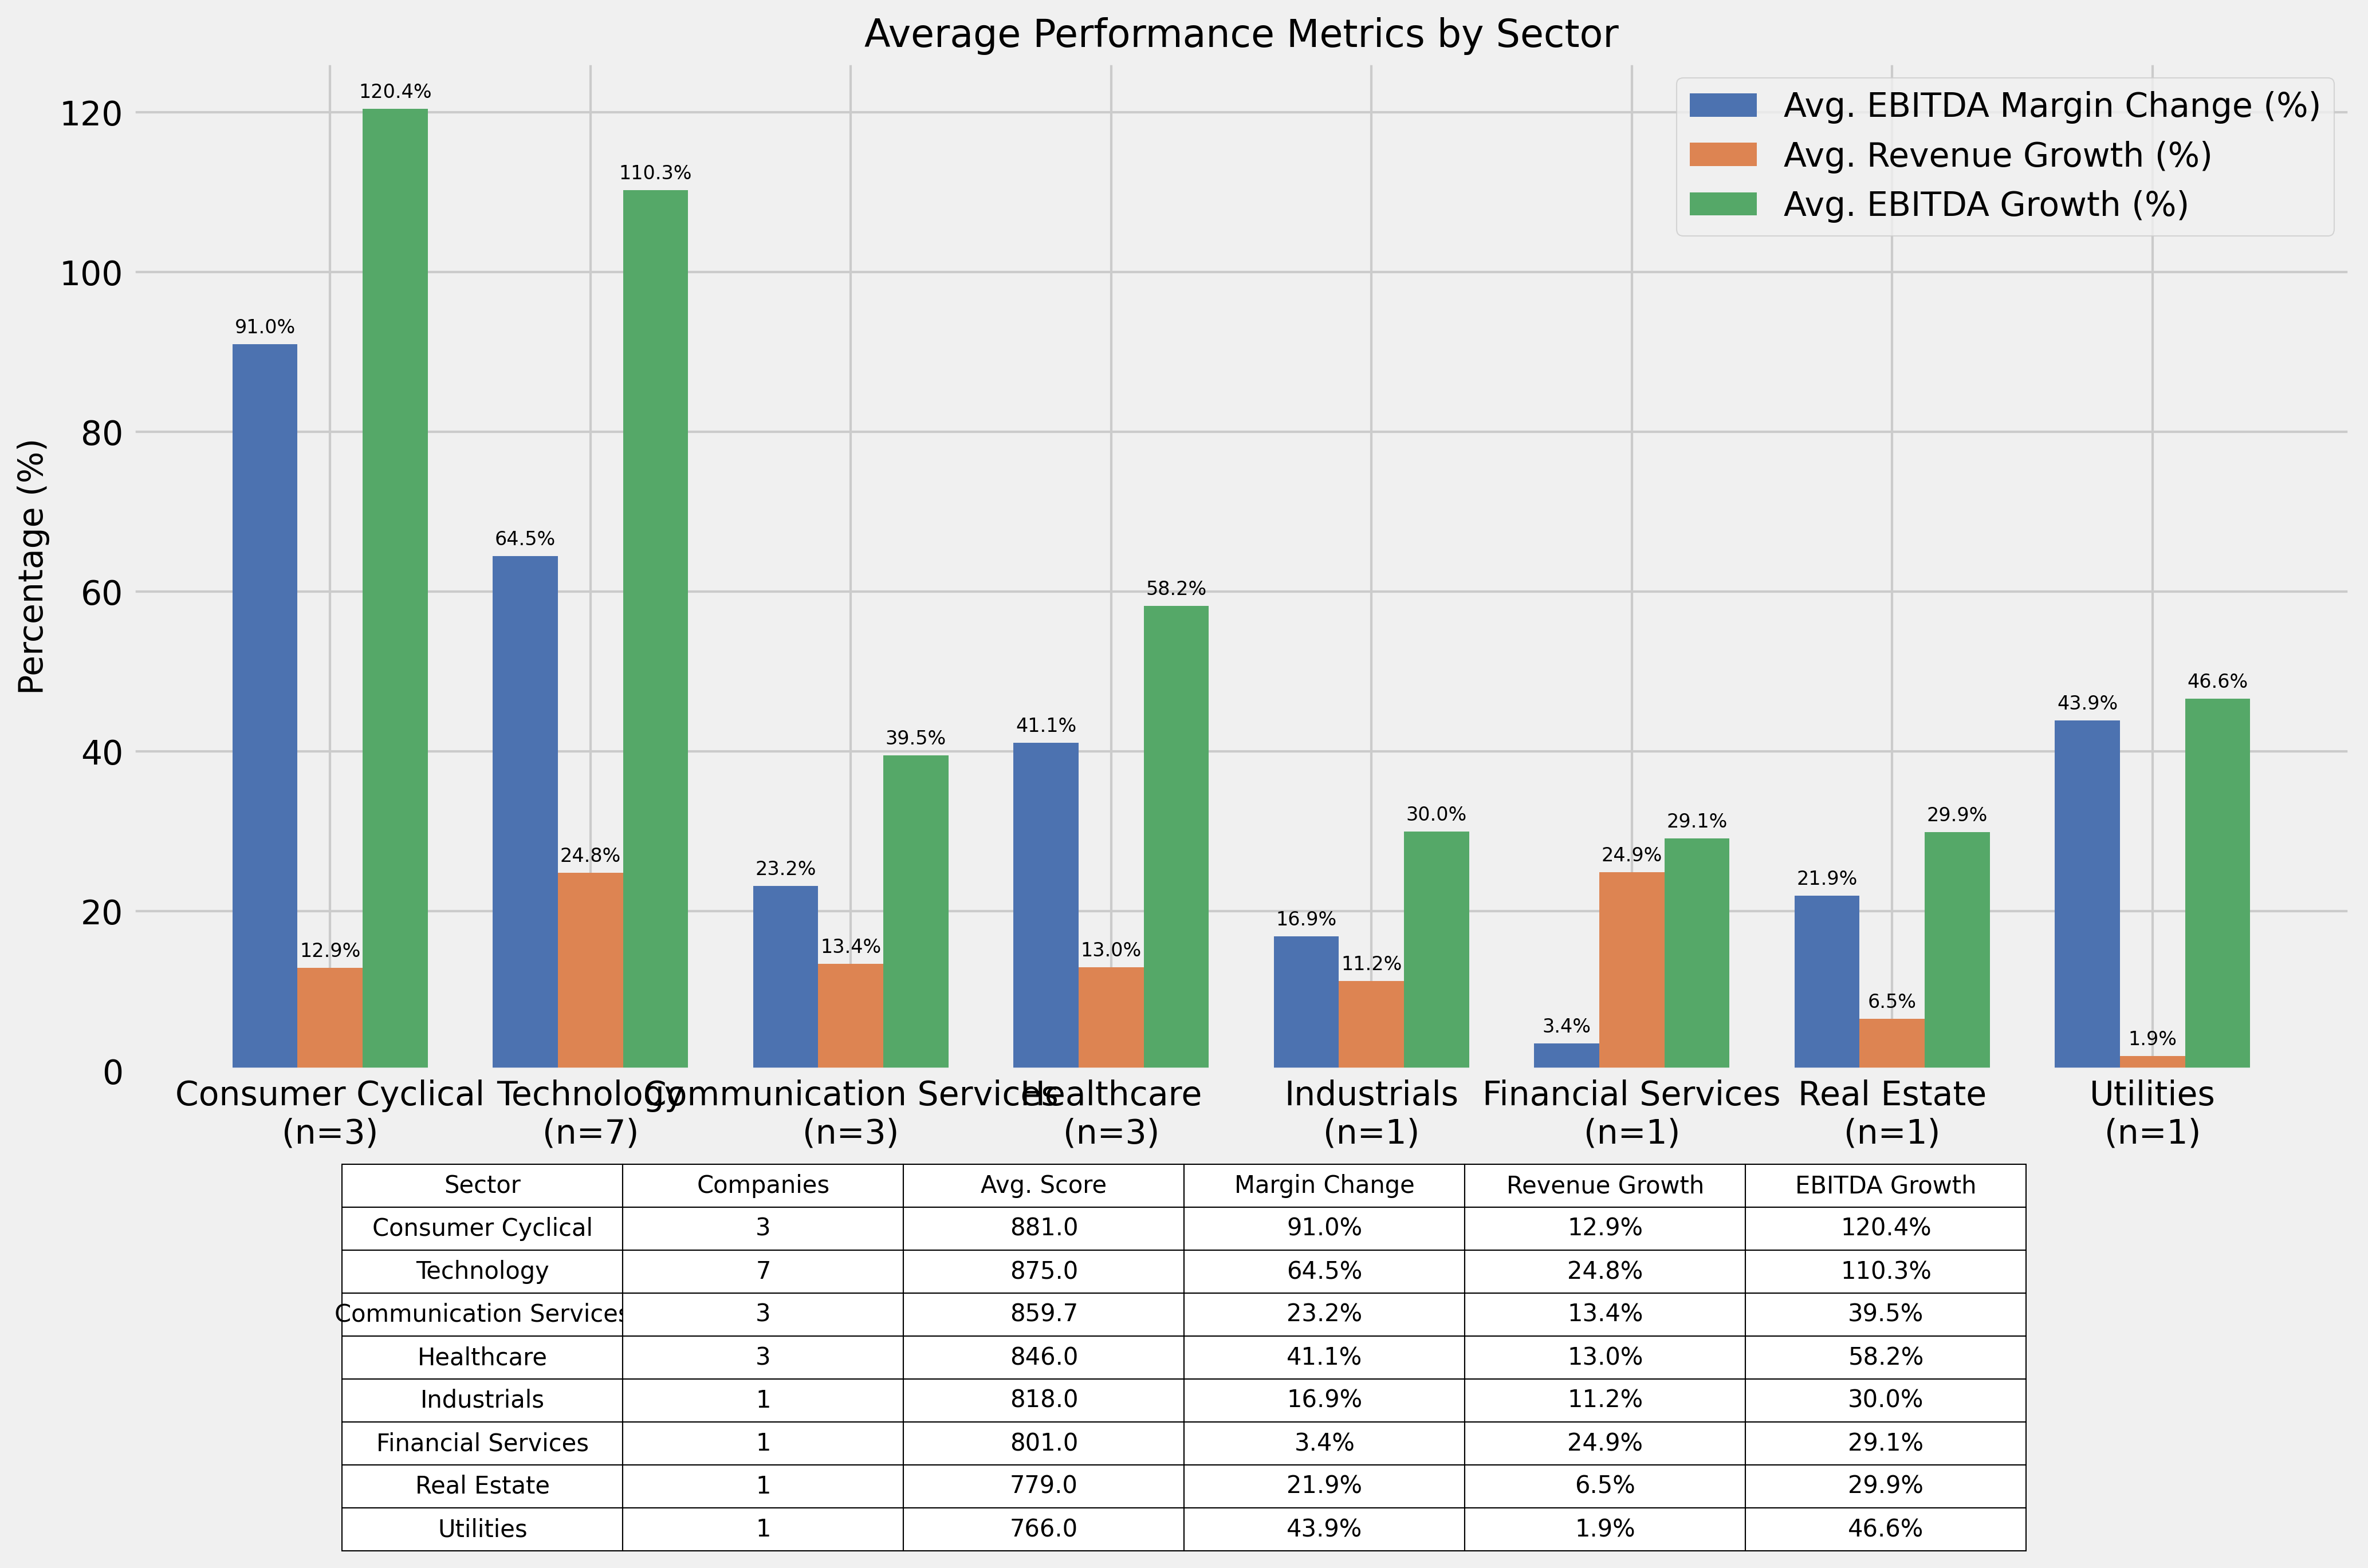
Which Sectors Lead in Operational Efficiency Improvement?
When we look at the sectors represented in our top 20 list, some interesting patterns emerge. Technology companies dominate, but we also see strong performers across Consumer Cyclical, Healthcare, and Communication Services sectors.
What Can We Learn From These Operational Champions?
The companies in our ranking demonstrate several key characteristics that contribute to their operational success:
- <strong>Scalable Business Models</strong>: Many top performers have business models that allow them to grow revenue without proportionally increasing costs.
- <strong>Digital Transformation</strong>: Companies like DoorDash and Amazon show how digital platforms can achieve improving margins at scale.
- <strong>Effective Cost Management</strong>: Several companies have likely implemented strategic cost controls while continuing to invest in growth.
- <strong>Pricing Power</strong>: Top performers may have the ability to increase prices or maintain margins despite market pressures.
For investors and business leaders, these metrics offer valuable insights into how companies are performing beyond just top-line growth. A company that can grow while becoming more efficient is demonstrating exceptional operational execution.
Understanding the Data Sources
Our analysis uses quarterly financial data from 2023 through 2025, focusing on reported EBITDA and revenue figures from company income statements. For each company, we compared the earliest available quarterly report from 2023 with the most recent report from 2025 to calculate our metrics.
This analysis helps identify companies that have demonstrated sustained operational improvement over approximately a two-year period, providing insight into their business execution rather than just short-term results.
Comments (0)
No comments yet. Be the first to comment!