What Makes a Top Operational Growth Leader?
In today's complex business environment, a company's true operational excellence goes beyond just stock price movements. Our 'Operational Growth Leaders' ranking examines how well companies have improved their fundamental business operations over the past three years (July 2022 to July 2025). We've created a comprehensive scoring system that evaluates companies based on three essential pillars of business performance.
Understanding the Three Pillars of Operational Excellence
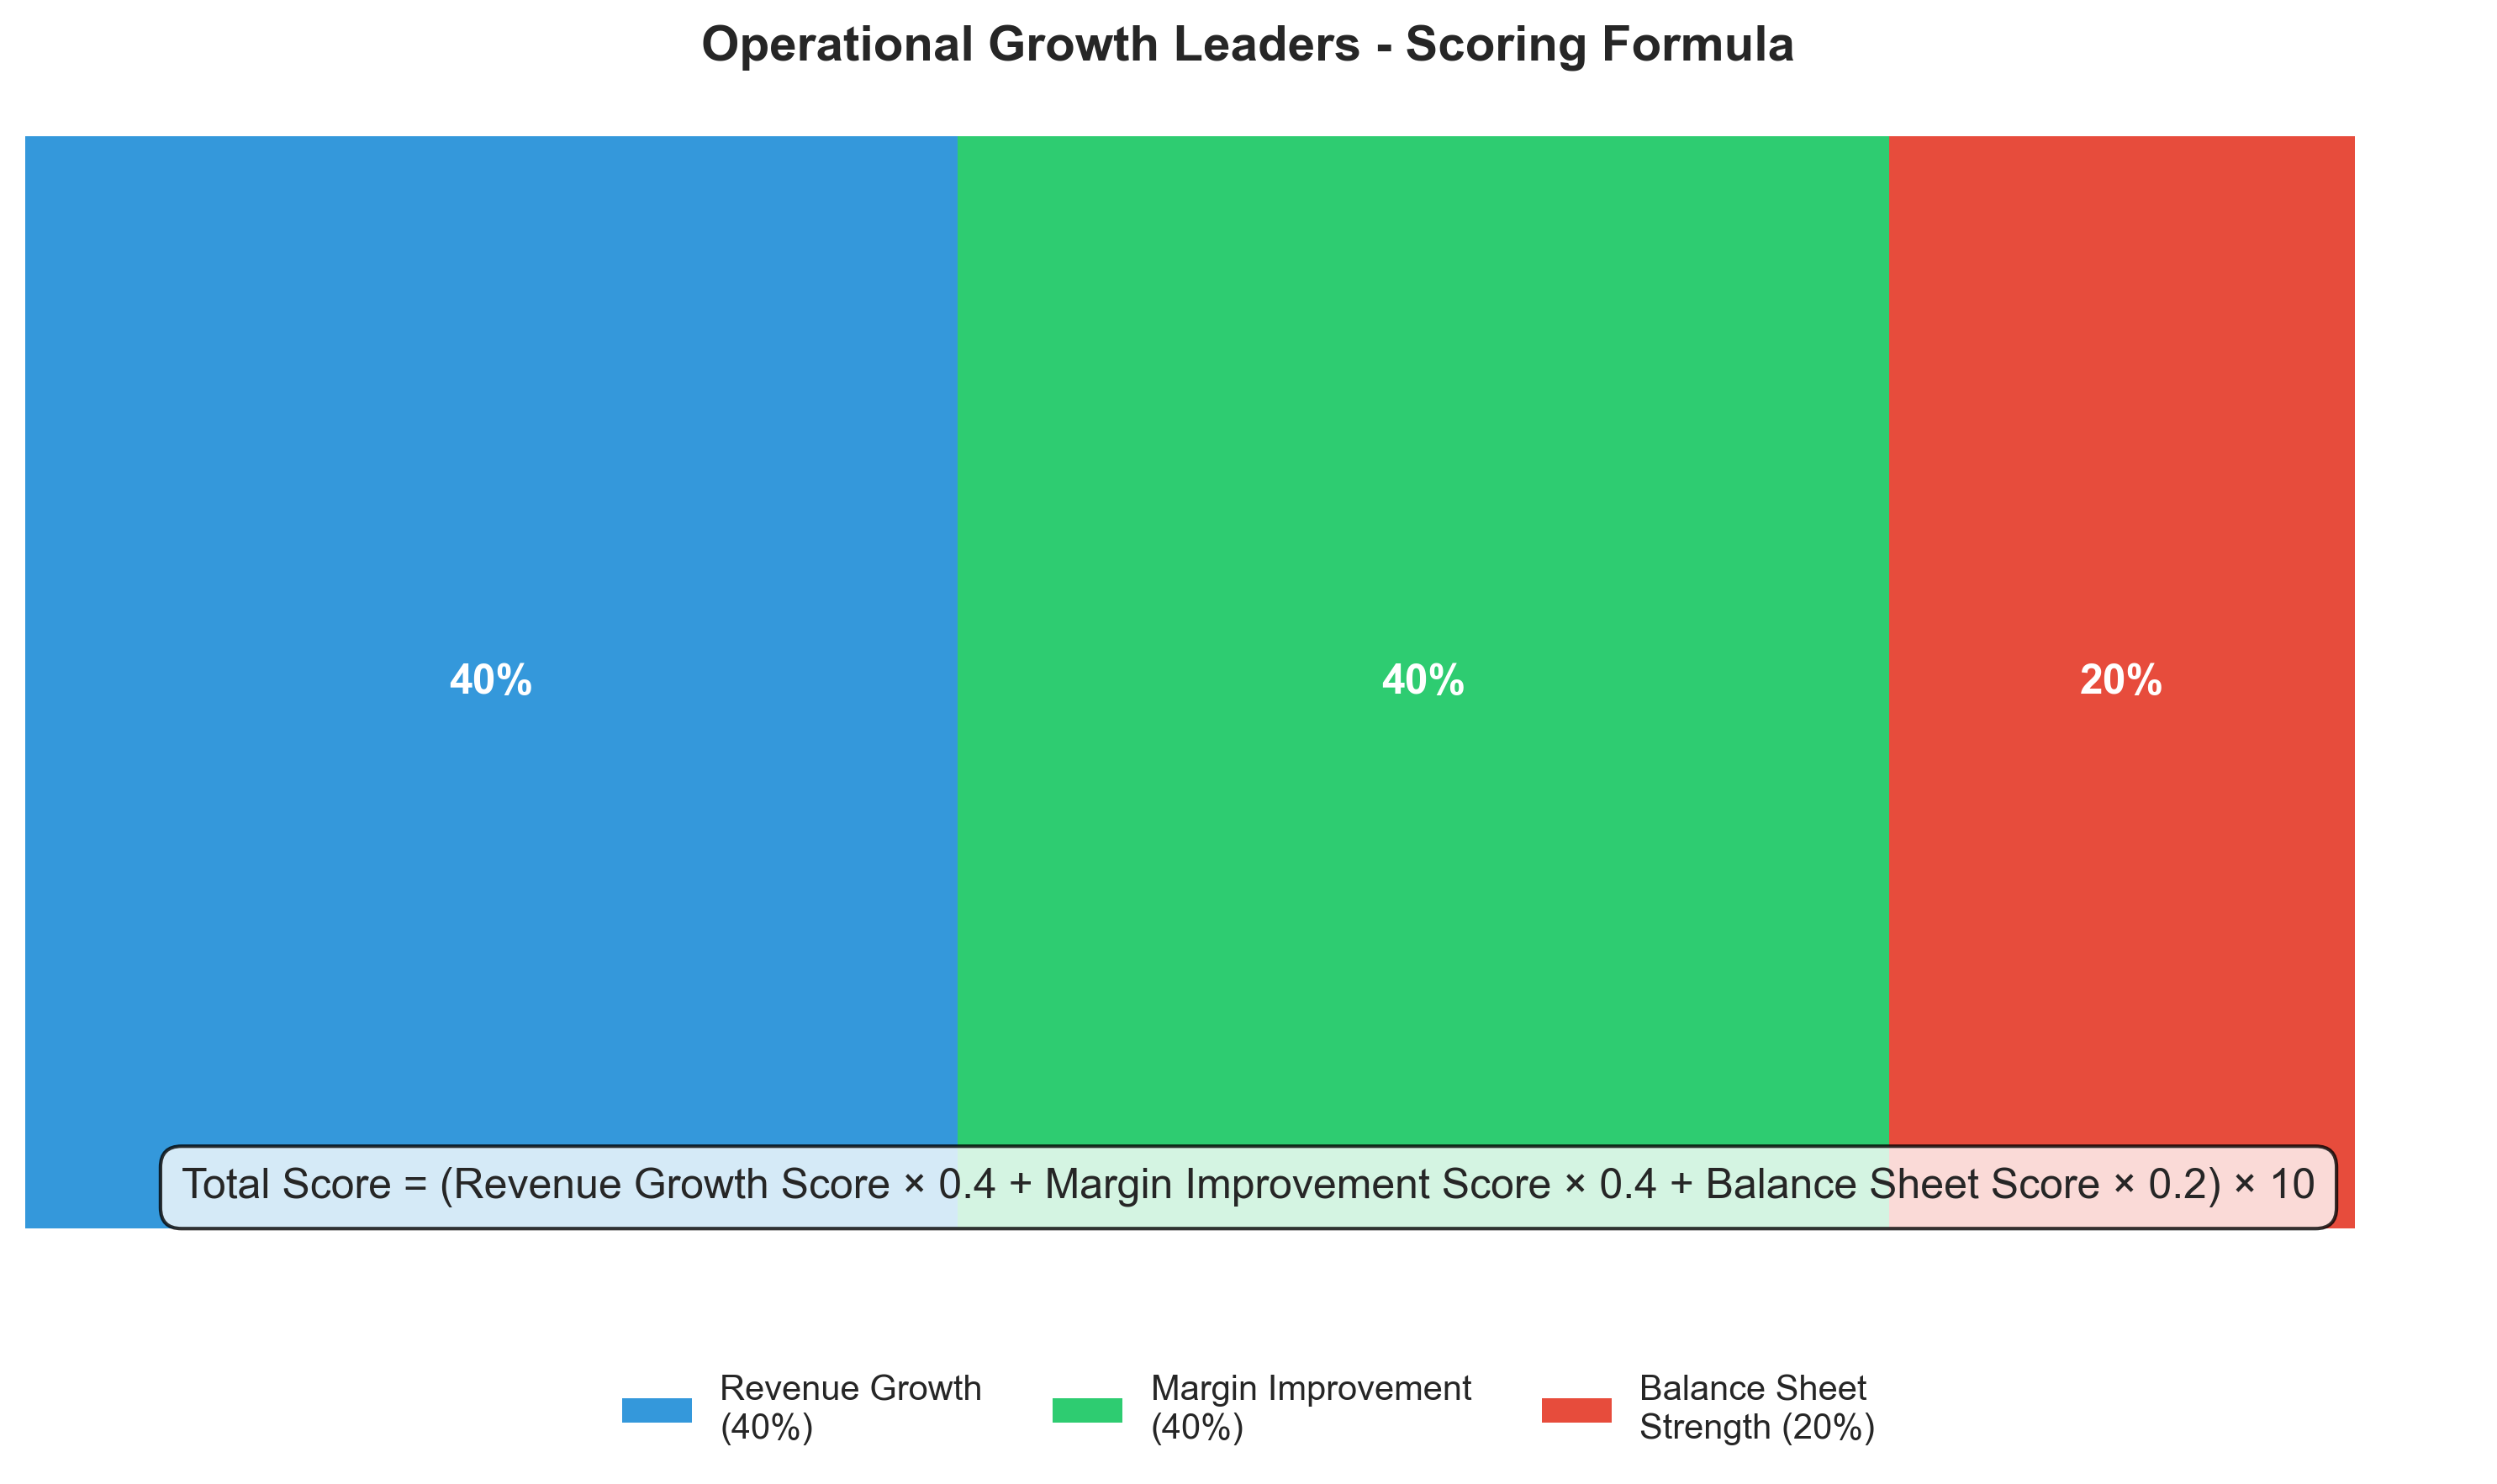
Let's break down what each component of our scoring system measures and why it matters to a company's overall performance:
- Revenue Growth (40%): This measures how much a company's total revenue has increased over the three-year period. Strong revenue growth indicates that a company is successfully expanding its business, gaining market share, or developing new products and services that customers value. We calculate this as: ((End Revenue - Start Revenue) / Start Revenue) × 100.
- Operating Margin Improvement (40%): This tracks how much more profitable a company has become at its core operations. Operating margin is the percentage of revenue that turns into operating profit before interest and taxes. An improving margin means a company is becoming more efficient, charging higher prices, or reducing costs. We calculate this as: End Operating Margin % - Start Operating Margin %.
- Balance Sheet Strengthening (20%): This examines how a company has improved its debt-to-equity ratio, which shows the proportion of company financing that comes from debt versus shareholders' equity. A reduction in this ratio generally indicates improved financial health and reduced financial risk. We calculate this as: -(End D/E Ratio - Start D/E Ratio), so a positive number means improvement.
For each of these metrics, companies are ranked against all other S&P 500 companies, with scores ranging from 0-100. The final score combines these three components using the weights shown above, then multiplies by 10 for a total possible score of 1,000.
The Leaders: Who's Excelling at Operational Growth?
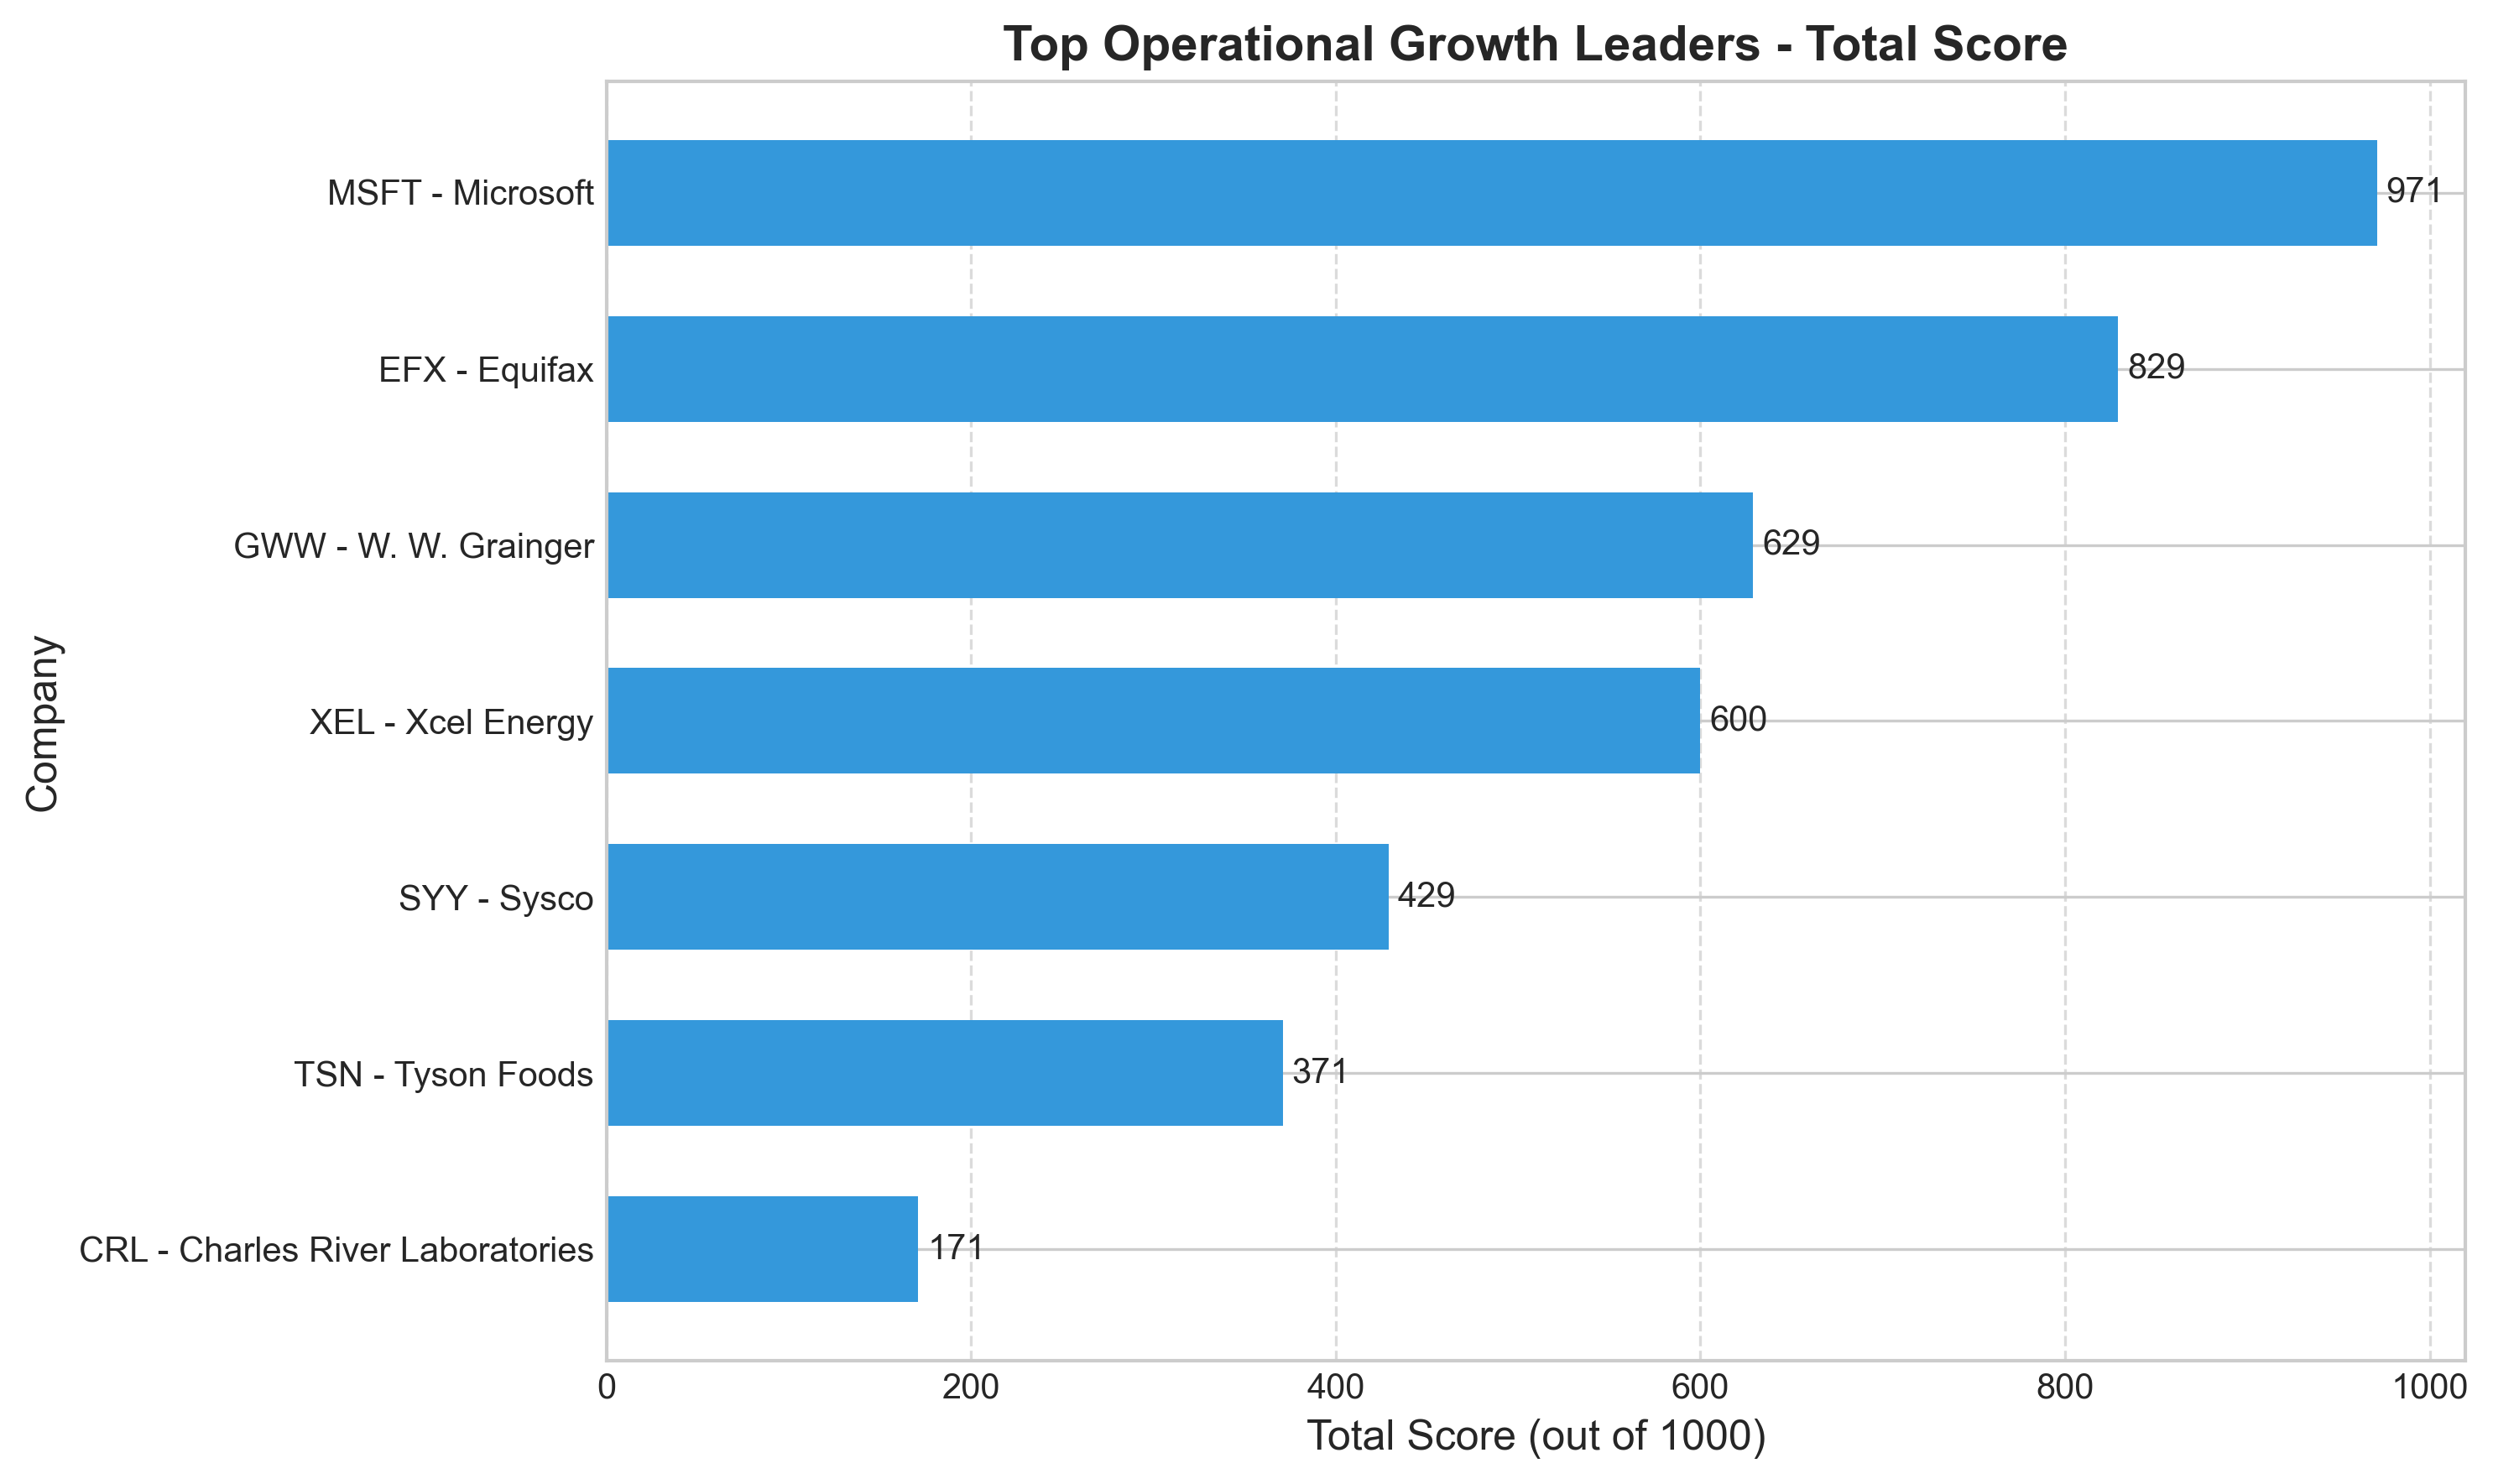
Our analysis revealed Microsoft (MSFT) as the standout performer with an exceptional score of 971 out of 1000. Equifax (EFX) and W. W. Grainger (GWW) round out the top three with scores of 829 and 629 respectively. What makes these companies special is their ability to improve across multiple dimensions simultaneously—growing revenue while also becoming more efficient and maintaining financial discipline.
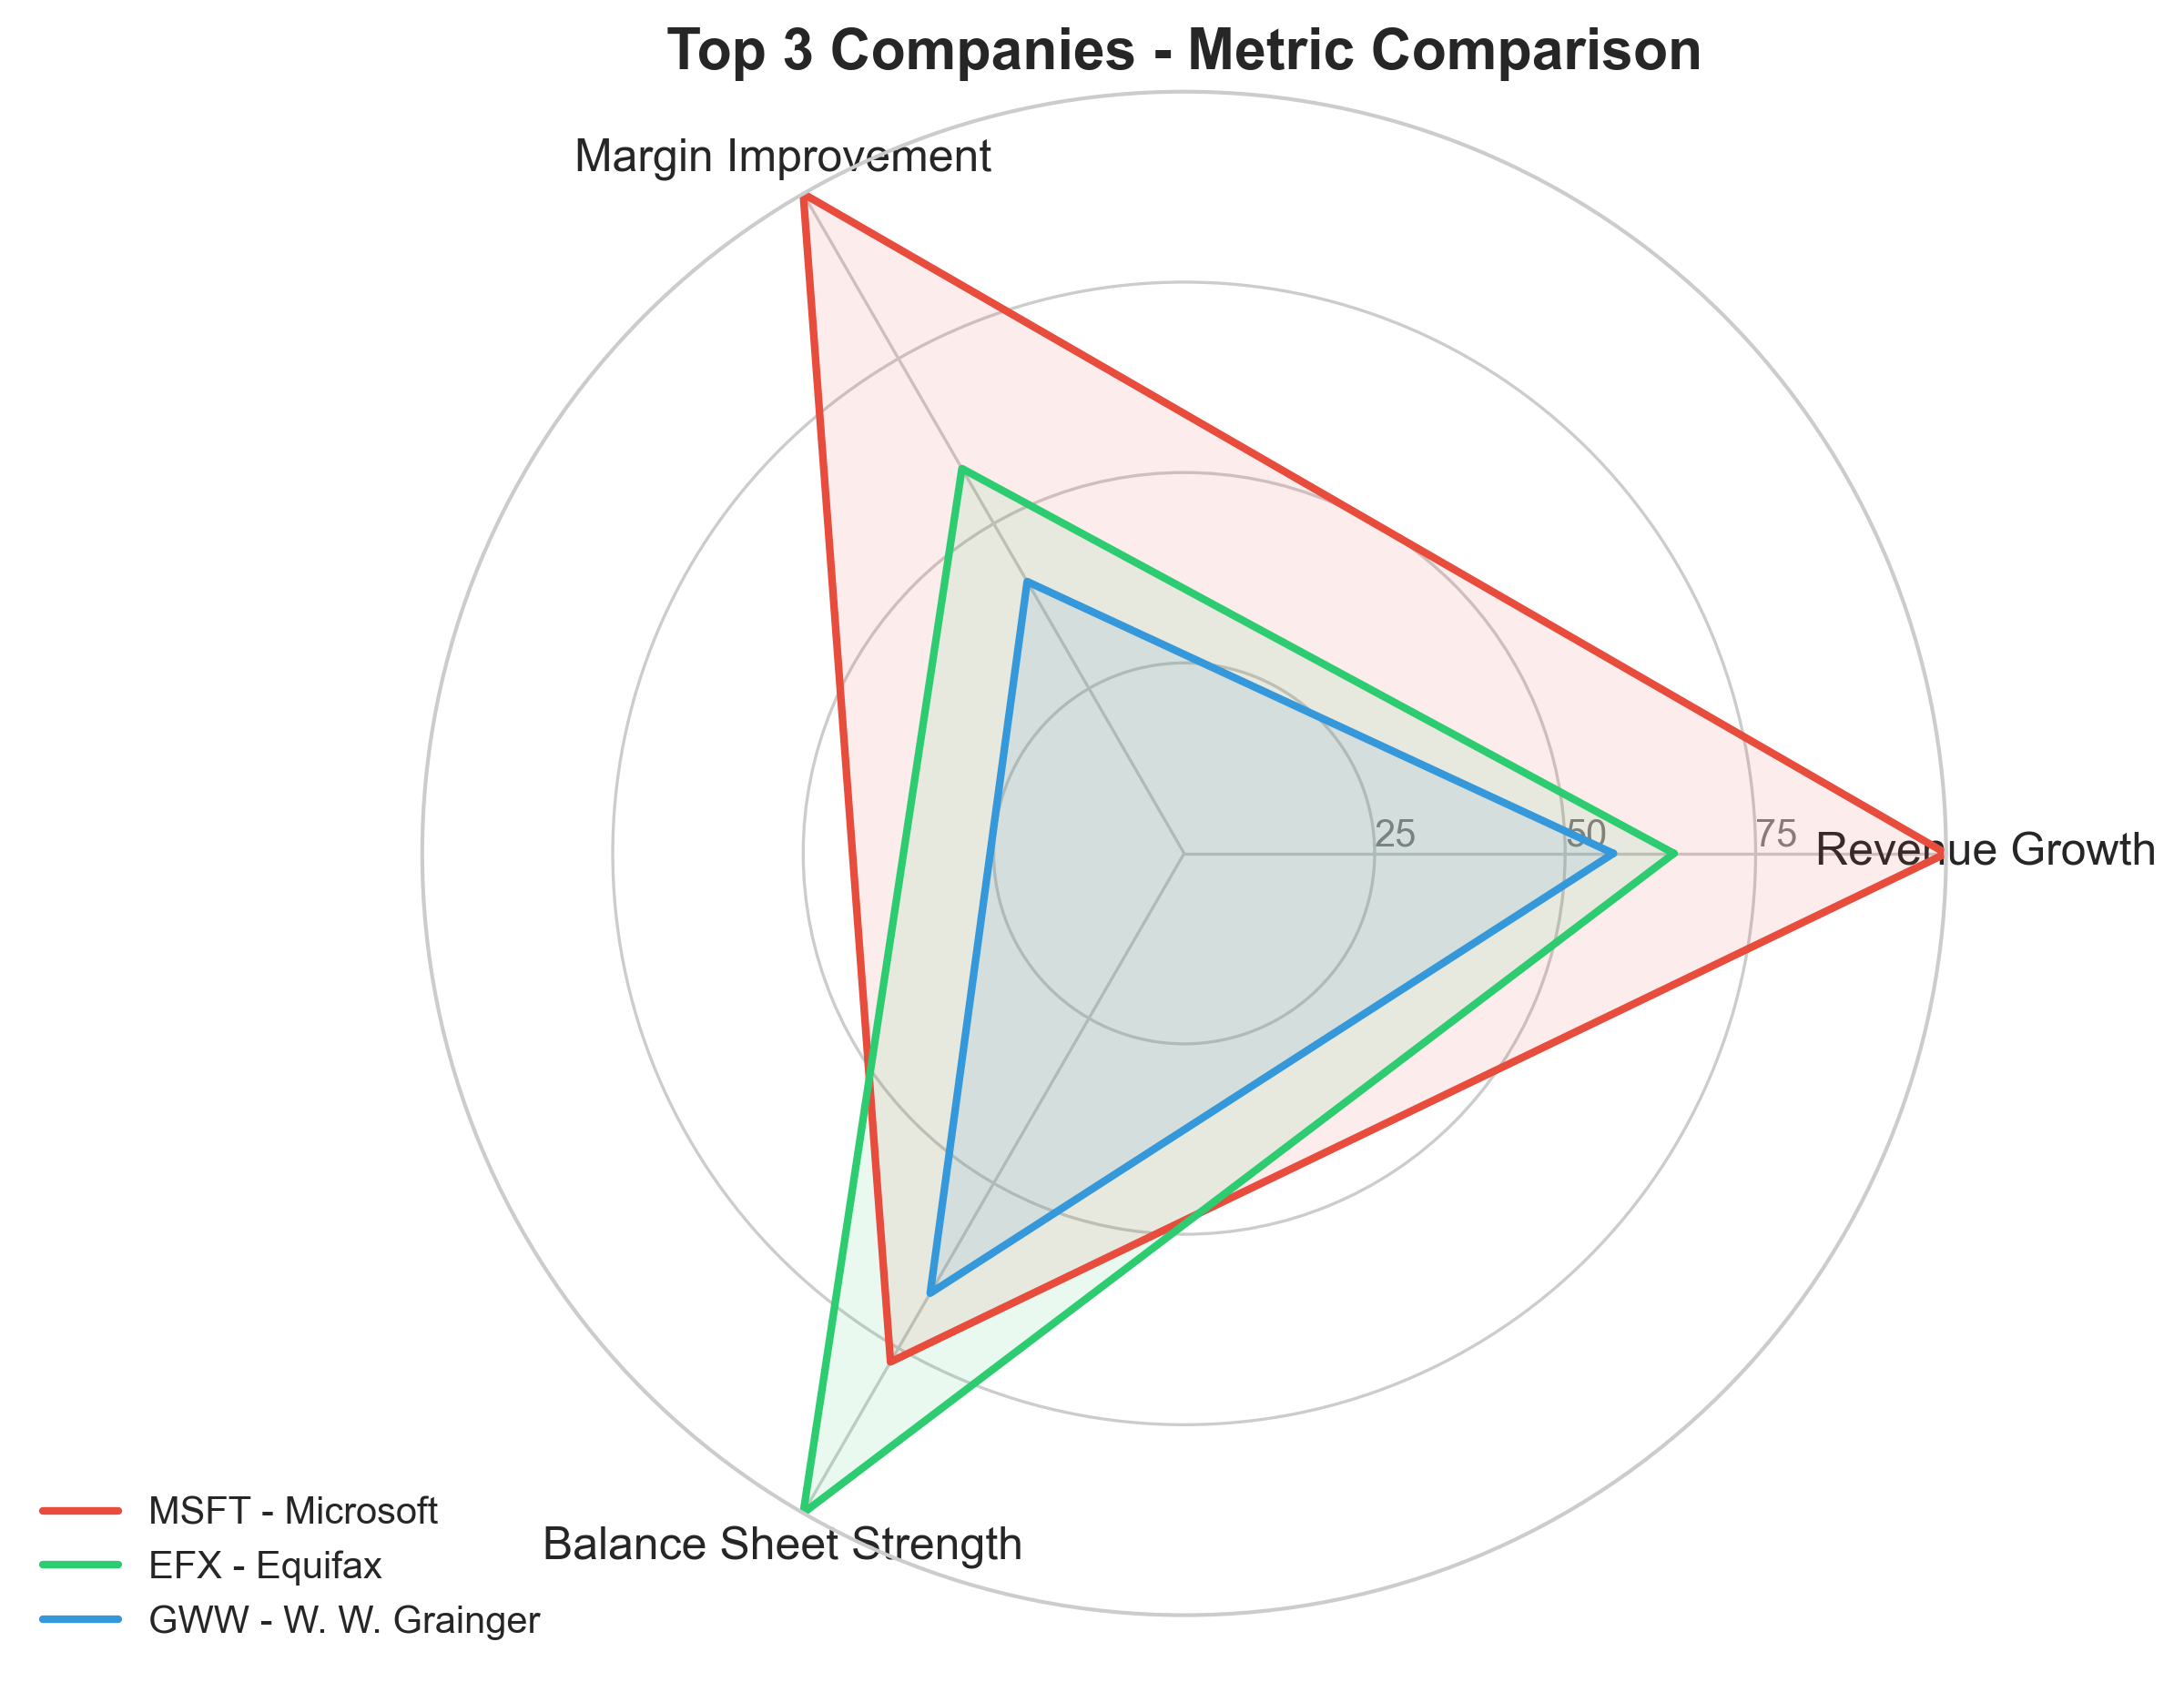
Comparing the Top Performers
When we examine the top three companies more closely, we see different paths to operational excellence. Microsoft (MSFT) shows remarkable balance across all three metrics, with particularly strong revenue growth of 13.27%. Equifax (EFX) demonstrates solid revenue growth at 3.79% combined with positive margin improvement and excellent debt reduction. W. W. Grainger (GWW) shows more modest revenue growth but maintains solid balance sheet improvements.
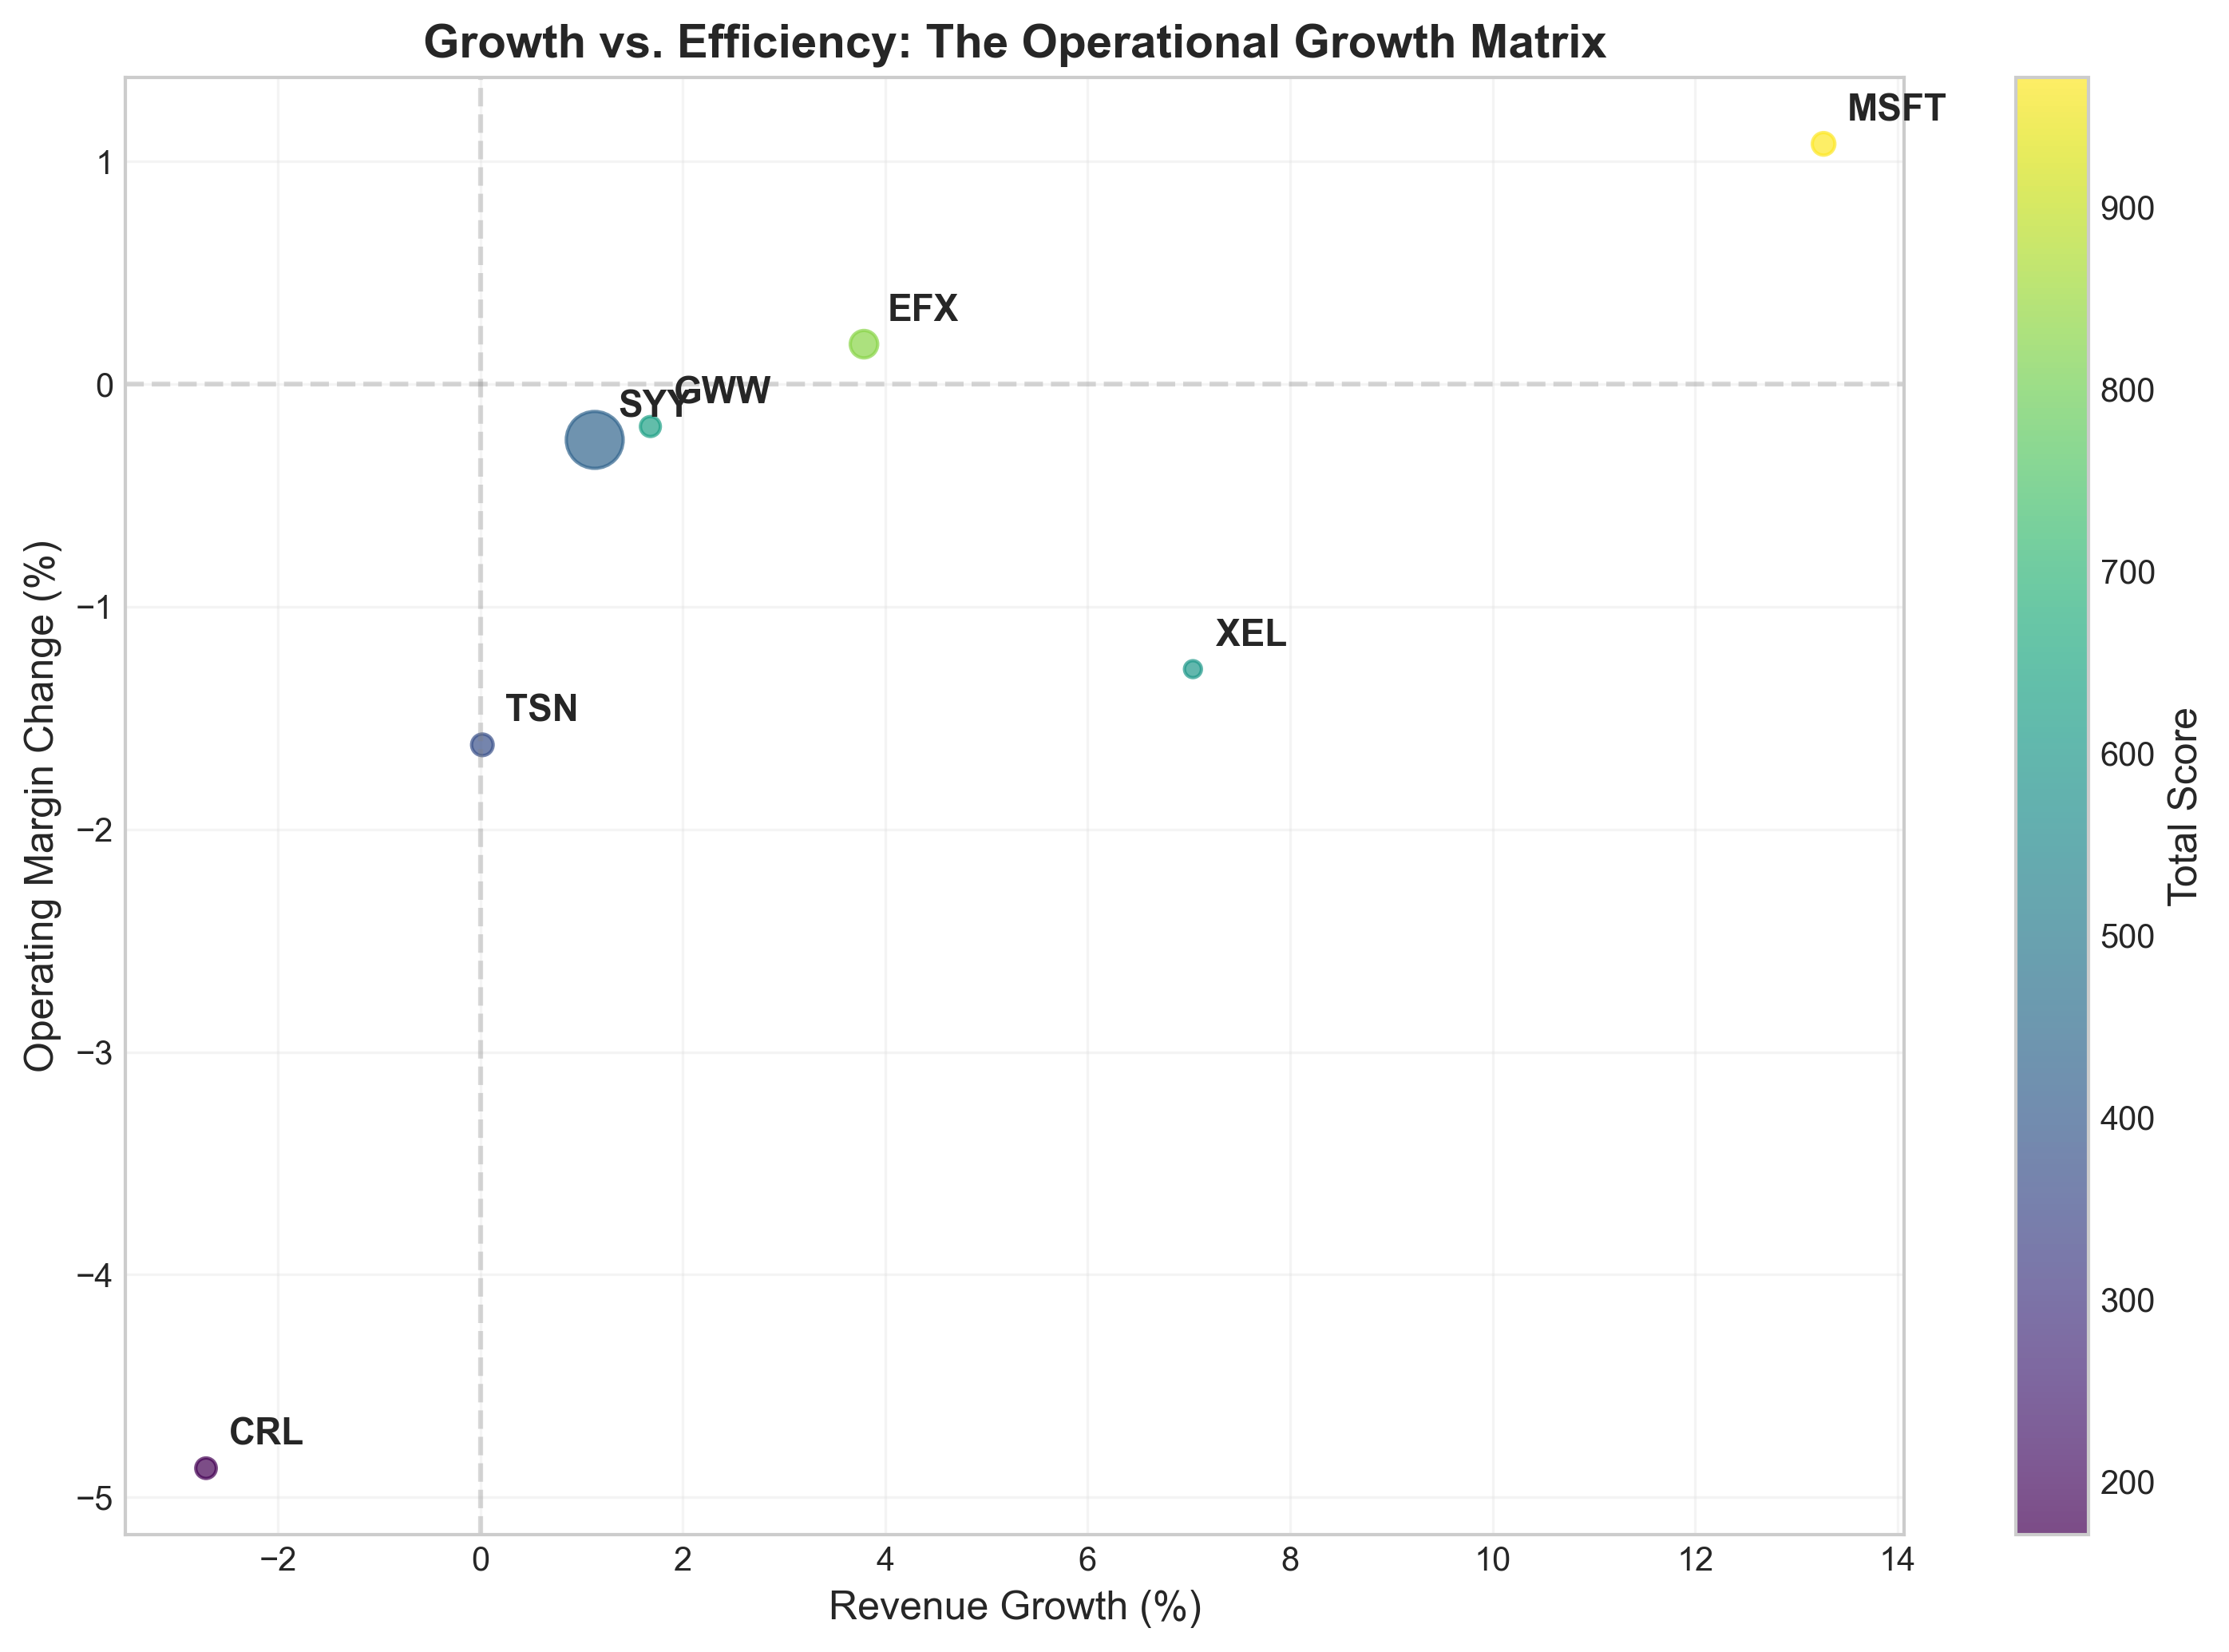
The Growth-Efficiency Matrix: Visualizing Performance
One powerful way to understand how companies are performing is through our Growth-Efficiency Matrix. This visualization plots revenue growth against margin improvement, with bubble size representing balance sheet strength (D/E ratio improvement) and color intensity showing the total score.
Companies in the upper-right quadrant are achieving the rare feat of growing revenue while also improving margins—something that's typically challenging since growth often requires investment that can temporarily reduce margins. Microsoft's position far to the right highlights its exceptional revenue growth combined with margin improvement, while others like Tyson Foods (TSN) and Charles River Laboratories (CRL) face challenges with negative metrics in some dimensions.
Microsoft: A Case Study in Operational Excellence
Microsoft's outstanding performance deserves a closer look. Over the analyzed period (from March 2024 to March 2025), the company grew its quarterly revenue from $61.86 billion to $70.07 billion—a 13.27% increase. At the same time, Microsoft improved its operating margin from an already impressive 44.59% to 45.67%, gaining 1.08 percentage points. This combination of growth and efficiency is particularly remarkable for a company of Microsoft's size.
Adding to these achievements, Microsoft also strengthened its balance sheet by reducing its debt-to-equity ratio from 0.32 to 0.19, representing a 0.13 point improvement. This three-dimensional excellence demonstrates Microsoft's commitment to sustainable business practices and financial discipline while pursuing growth opportunities.
Key Takeaways for Investors and Business Observers
- Balanced excellence matters: The top-ranked companies demonstrate that it's possible to grow revenue, improve operational efficiency, and strengthen financial position simultaneously.
- Size is not a limitation: Microsoft shows that even massive companies can achieve impressive revenue growth while becoming more efficient.
- Financial discipline pays off: Companies that improved their debt-to-equity ratios while growing demonstrate superior financial management practices.
- Industry variations exist: Companies from diverse sectors made the list, showing that operational excellence is possible across different business models and market conditions.
- Context matters: The analysis covers a specific three-year window (2022-2025) that includes various economic conditions, and performance should be viewed within this timeframe.
The Operational Growth Leaders ranking provides a holistic view of financial performance beyond simple stock price movements. By focusing on fundamental operational improvements across multiple dimensions, this analysis highlights companies that have built strong foundations for potential long-term value creation through disciplined business execution.
Comments (0)
No comments yet. Be the first to comment!