Understanding the Financial Stress Index
The Financial Stress Index is a multi-dimensional analysis tool that identifies companies potentially facing operational and financial challenges. Unlike simple price-based rankings, this comprehensive approach examines four critical dimensions of financial health that, when combined, may indicate underlying stress that deserves closer attention.
The Four Key Metrics Explained
- **Operating Margin**: This profitability metric shows how efficiently a company converts revenue into operating profit. Calculated as (Operating Income ÷ Total Revenue) × 100, a low or negative margin suggests the company may be struggling with basic profitability. For example, Axon Enterprise's -1.46% margin indicates it's spending more on operations than it's generating in revenue.
- **Debt Change Percentage**: This tracks how much a company's debt has increased or decreased compared to the previous quarter. A substantial increase (like Axon's 183.61% surge) could indicate the company is borrowing heavily to fund operations or investments, potentially increasing financial risk.
- **Capital Expenditure (CapEx) Change**: This measures how much a company is investing in its future growth through equipment, facilities, and other long-term assets. A reduction might signal the company is conserving cash, possibly due to financial concerns. Several companies in our ranking, including CarMax (-7.15%) and J.B. Hunt (-9.60%), have reduced their capital investments.
- **Relative Strength Index (RSI)**: This technical indicator measures price momentum, with values under 45 considered potentially oversold. Lower RSI values may reflect negative market sentiment, as seen with CarMax (21.36) and Universal Health Services (19.34).
Each company receives a score between 0-250 on all four metrics, with the total normalized to a 1000-point scale. Higher scores indicate greater potential financial stress across multiple dimensions.
Key Insights from the Rankings
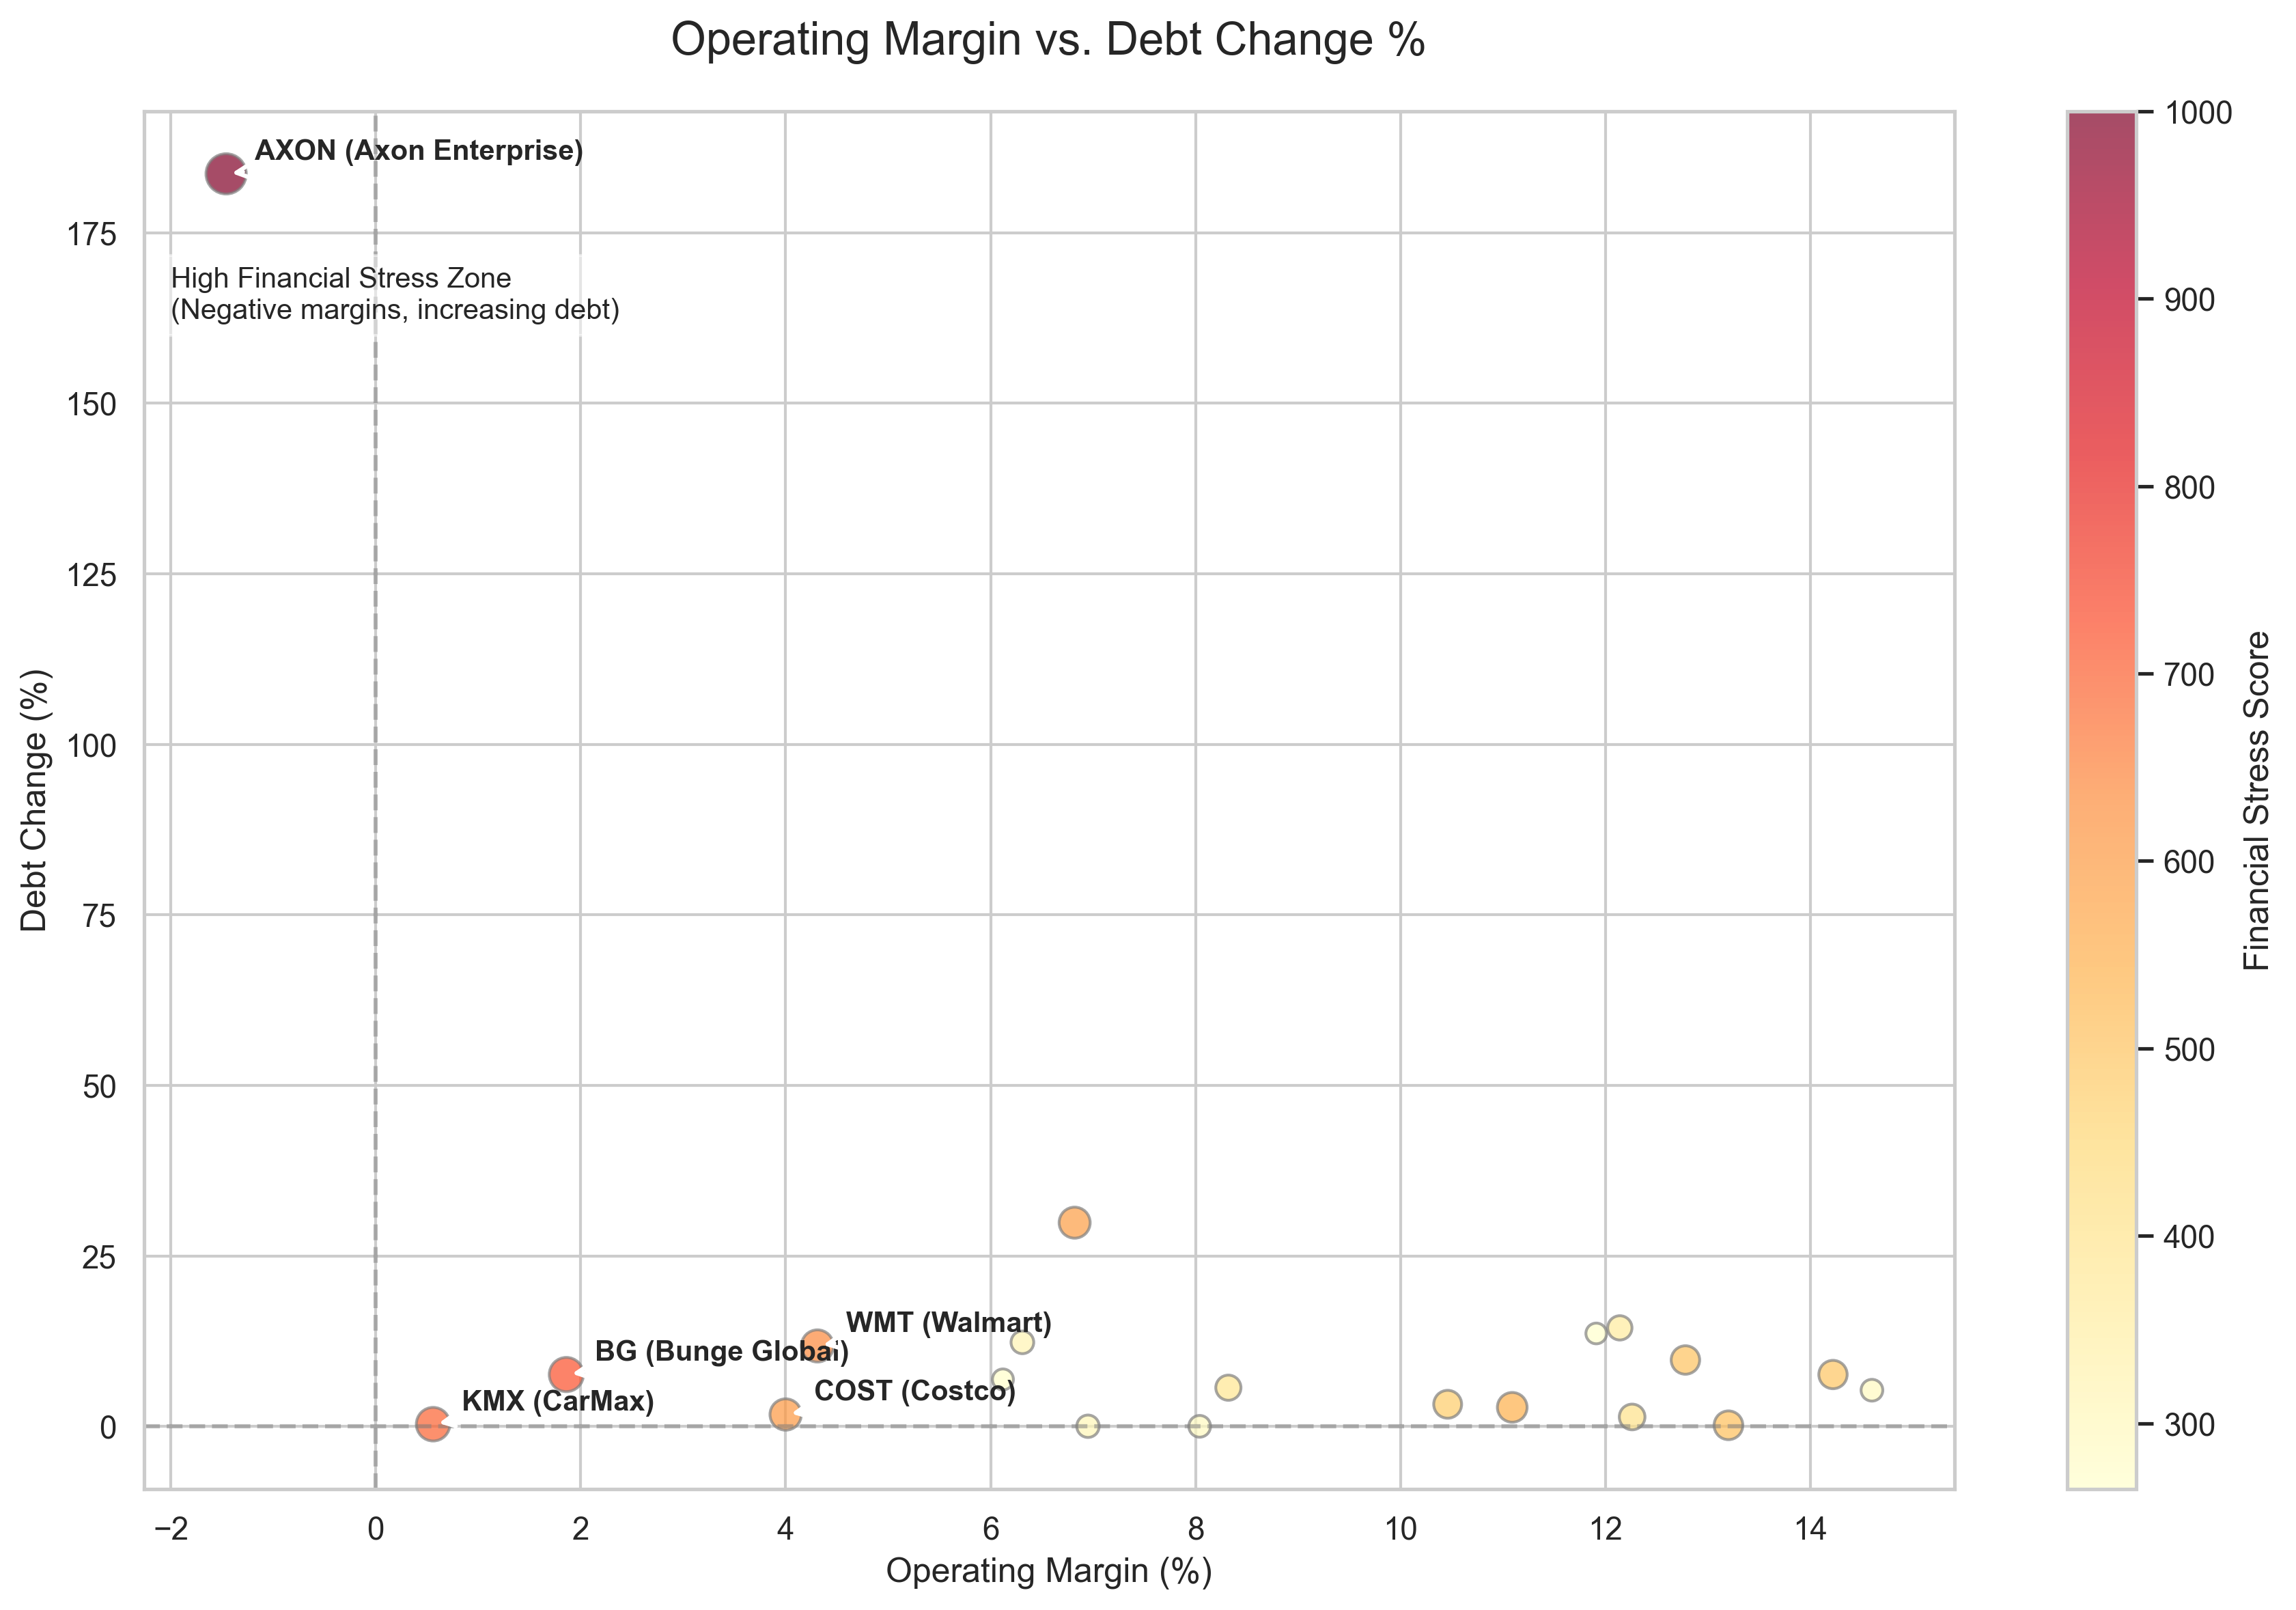
Our analysis identified Axon Enterprise (AXON) as the company with the highest stress score, a perfect 1000 out of 1000. As shown in the scatter plot above, Axon stands apart from other companies with its combination of negative operating margin (-1.46%) and extraordinary debt increase (183.61%). This suggests the company is both unprofitable at the operational level and rapidly increasing its financial leverage, a potentially concerning combination.
Major retailers feature prominently in the top stress rankings, with Bunge Global (BG), CarMax (KMX), Walmart (WMT), and Costco (COST) all scoring above 600. Retailers often operate on thin margins, but the combination with other stress factors places these companies higher on our index.
Breaking Down the Top 5 Companies' Scores
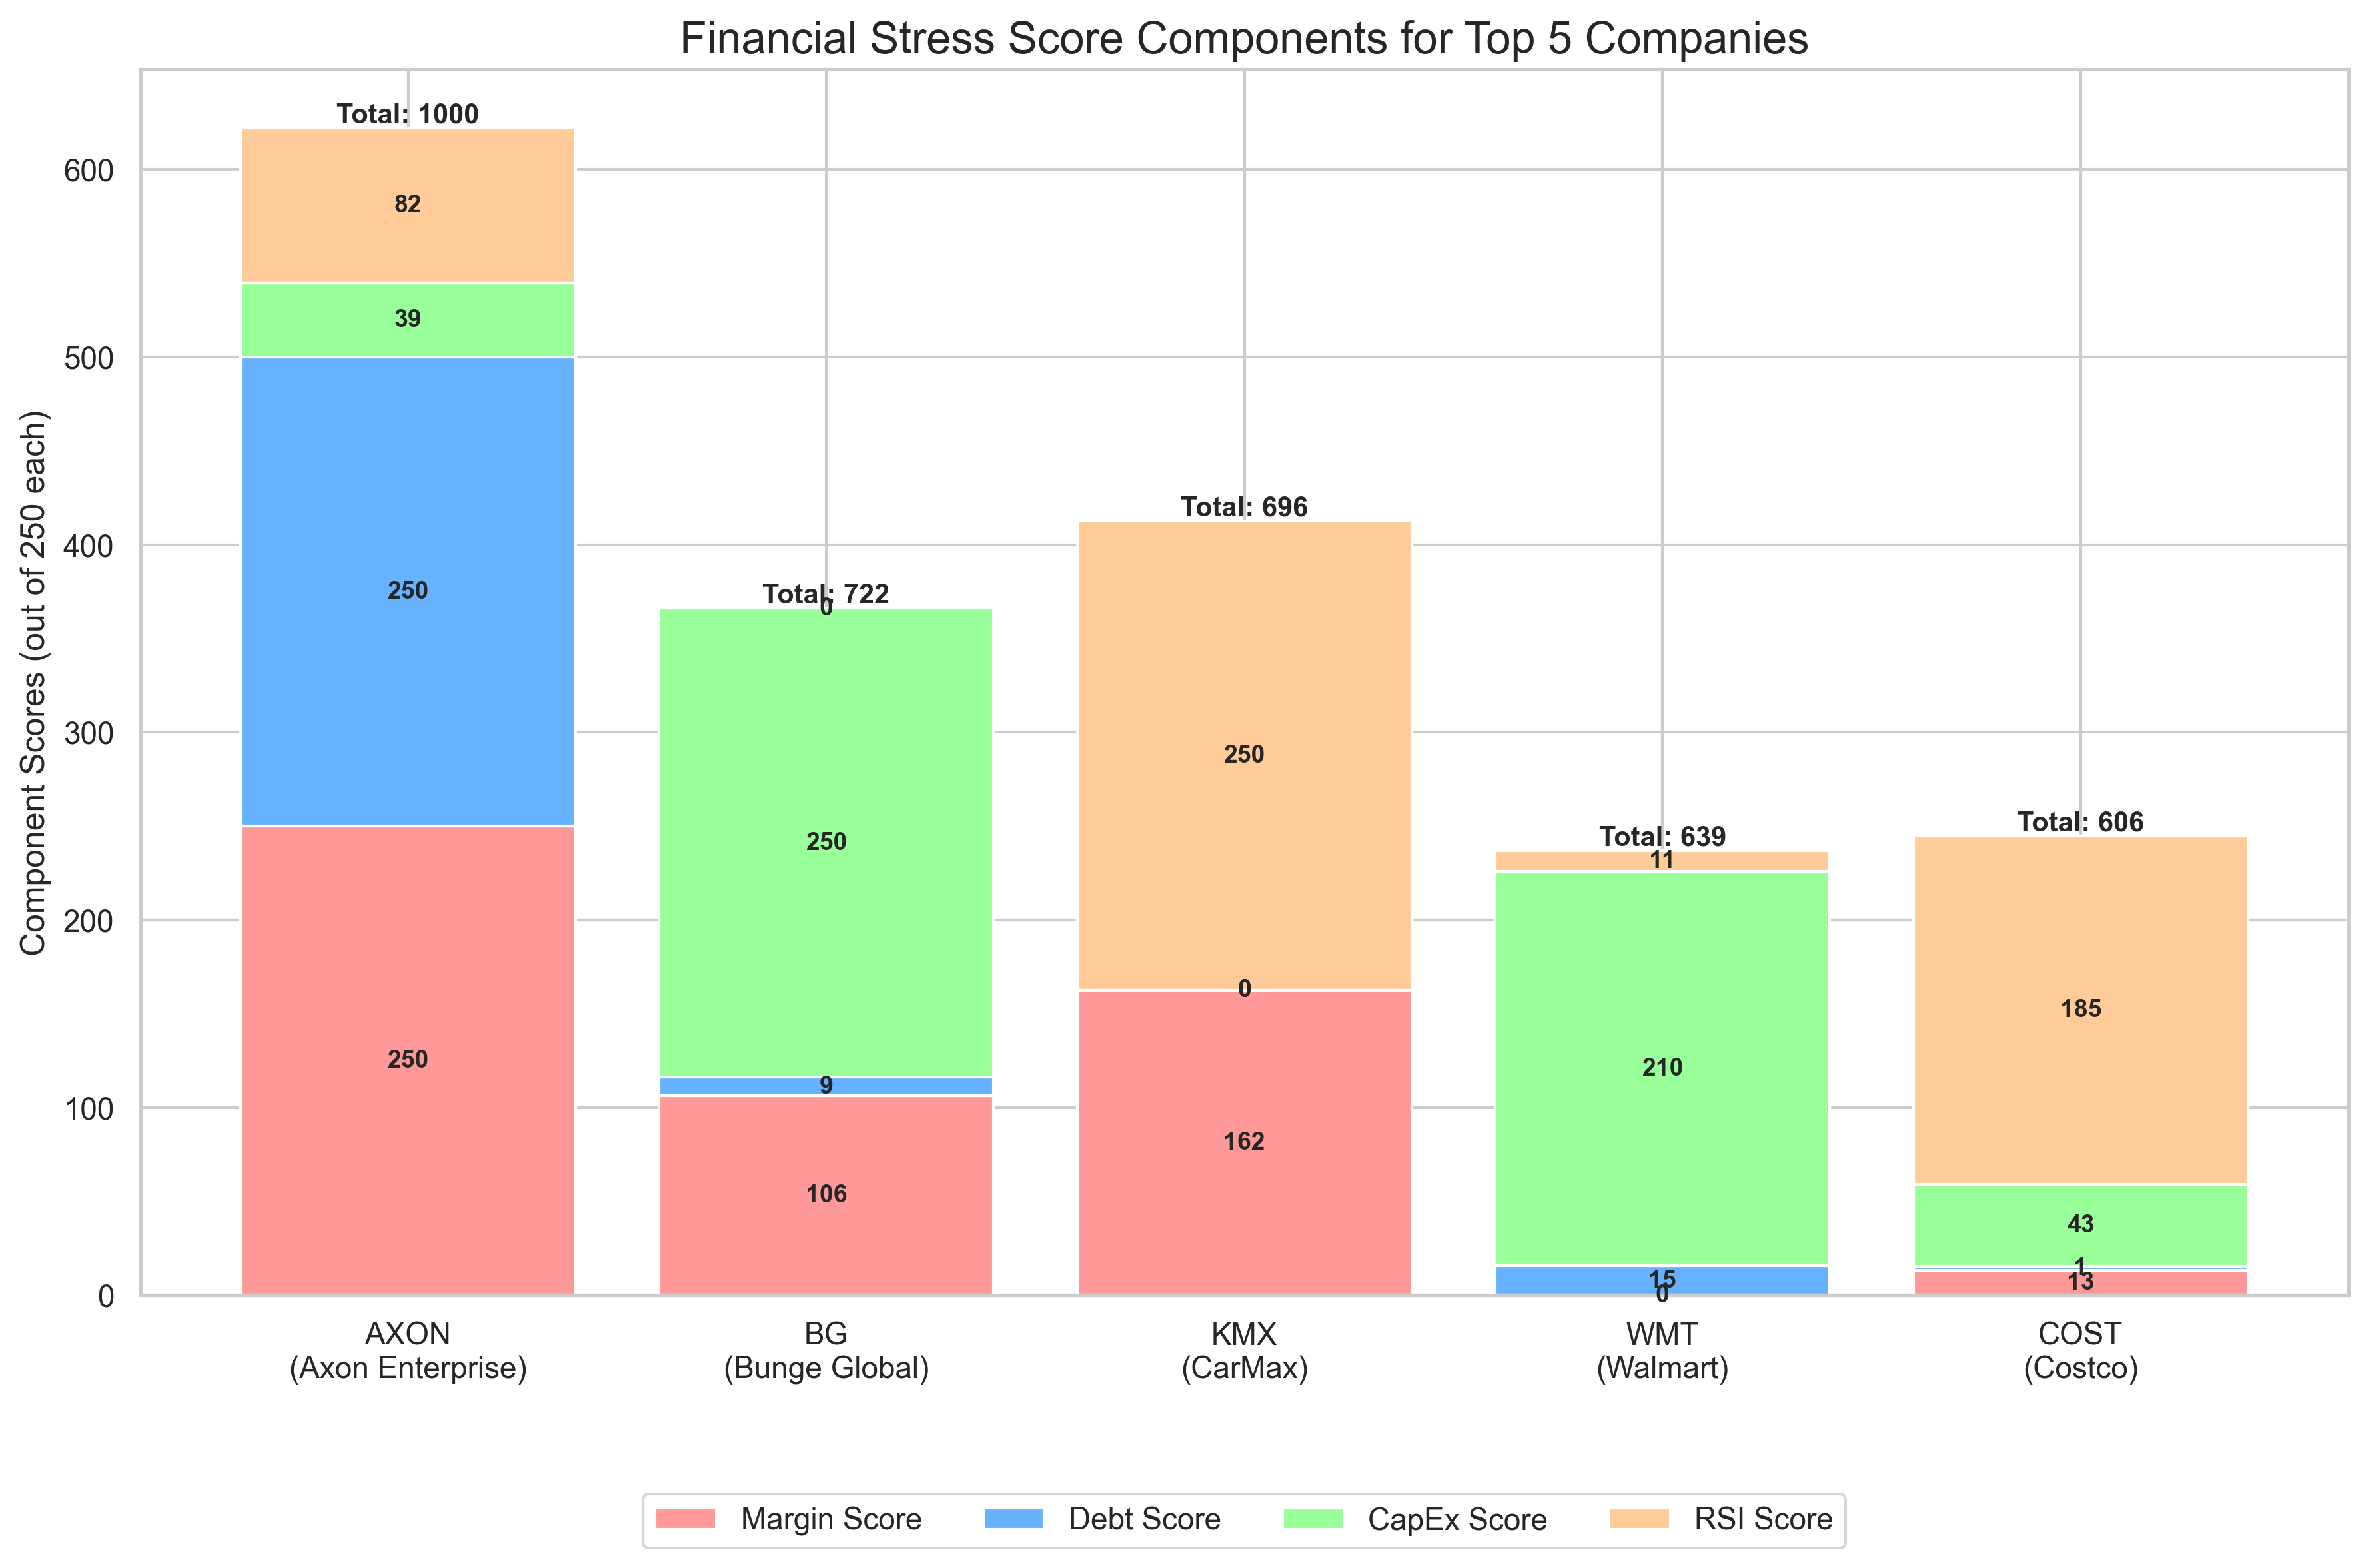
The component breakdown reveals different stress patterns among the top companies. Axon's extraordinarily high debt increase drives most of its score, while CarMax's extremely low RSI (technical oversold condition) contributes significantly to its ranking. Walmart shows more balanced stress across all four metrics, suggesting broader financial challenges rather than a single acute issue.
Putting the Financial Stress Index in Context
While the Financial Stress Index identifies potential concerns, it's important to understand its limitations. Companies may have strategic reasons for their financial decisions that don't necessarily indicate problems. For example, a company might increase debt to fund a major acquisition, temporarily affecting its metrics despite a sound long-term strategy.
- **Axon Enterprise** might be investing heavily in growth initiatives, explaining its high debt increase despite negative margins
- **Bunge Global** shows relatively healthy margins but appears on the list due to its debt and CapEx patterns
- **Retailers** like Walmart and Costco traditionally operate with thin margins, making them more likely to appear in stress rankings
- **Low RSI values** may indicate temporary market sentiment rather than fundamental issues
The Financial Stress Index provides a starting point for further research rather than a definitive judgment of a company's financial health. Historical context, industry standards, and company-specific factors should all be considered when interpreting these results.
Methodology Details
Our analysis covers the period from April 23, 2025, to July 23, 2025, using the most recent quarterly financial statements available for each company. We normalized each metric across the dataset and combined them into a composite score, giving equal weight to all four factors.
The Financial Stress Index offers a unique lens through which to view company performance, complementing traditional financial analysis by highlighting potential pressure points that might otherwise go unnoticed in standard financial reporting.
Comments (0)
No comments yet. Be the first to comment!