Understanding the Operational Excellence Metrics
Before diving into the results, let's understand what these metrics mean for everyday investors. Operational excellence isn't just about making profits—it's about how efficiently companies use their resources to generate those profits. These metrics help us see beyond simple revenue and earnings growth to understand the quality and sustainability of a company's performance.
| Metric | What It Means | Why It Matters |
|---|---|---|
| Operating Margin Change | How much more (or less) profit a company makes from each dollar of sales | Shows if a company is getting better at controlling costs or raising prices |
| Asset Turnover Change | Improvement in revenue generated per dollar of company assets | Reveals if a company is using its buildings, equipment, and other resources more productively |
| Return on Assets (ROA) Change | Increase in profit generated from each dollar of assets | Combines the effects of both margin and asset use to show overall operational improvement |
How the Scores Are Calculated
The total score (out of 1000) combines how much a company has improved its efficiency (60% of the score) with its current efficiency level (40%). Companies with higher scores have made bigger strides in running their operations better. The data comes from quarterly financial reports spanning from 2022 to early 2025, giving us a three-year window to measure progress.
The Efficiency Champions
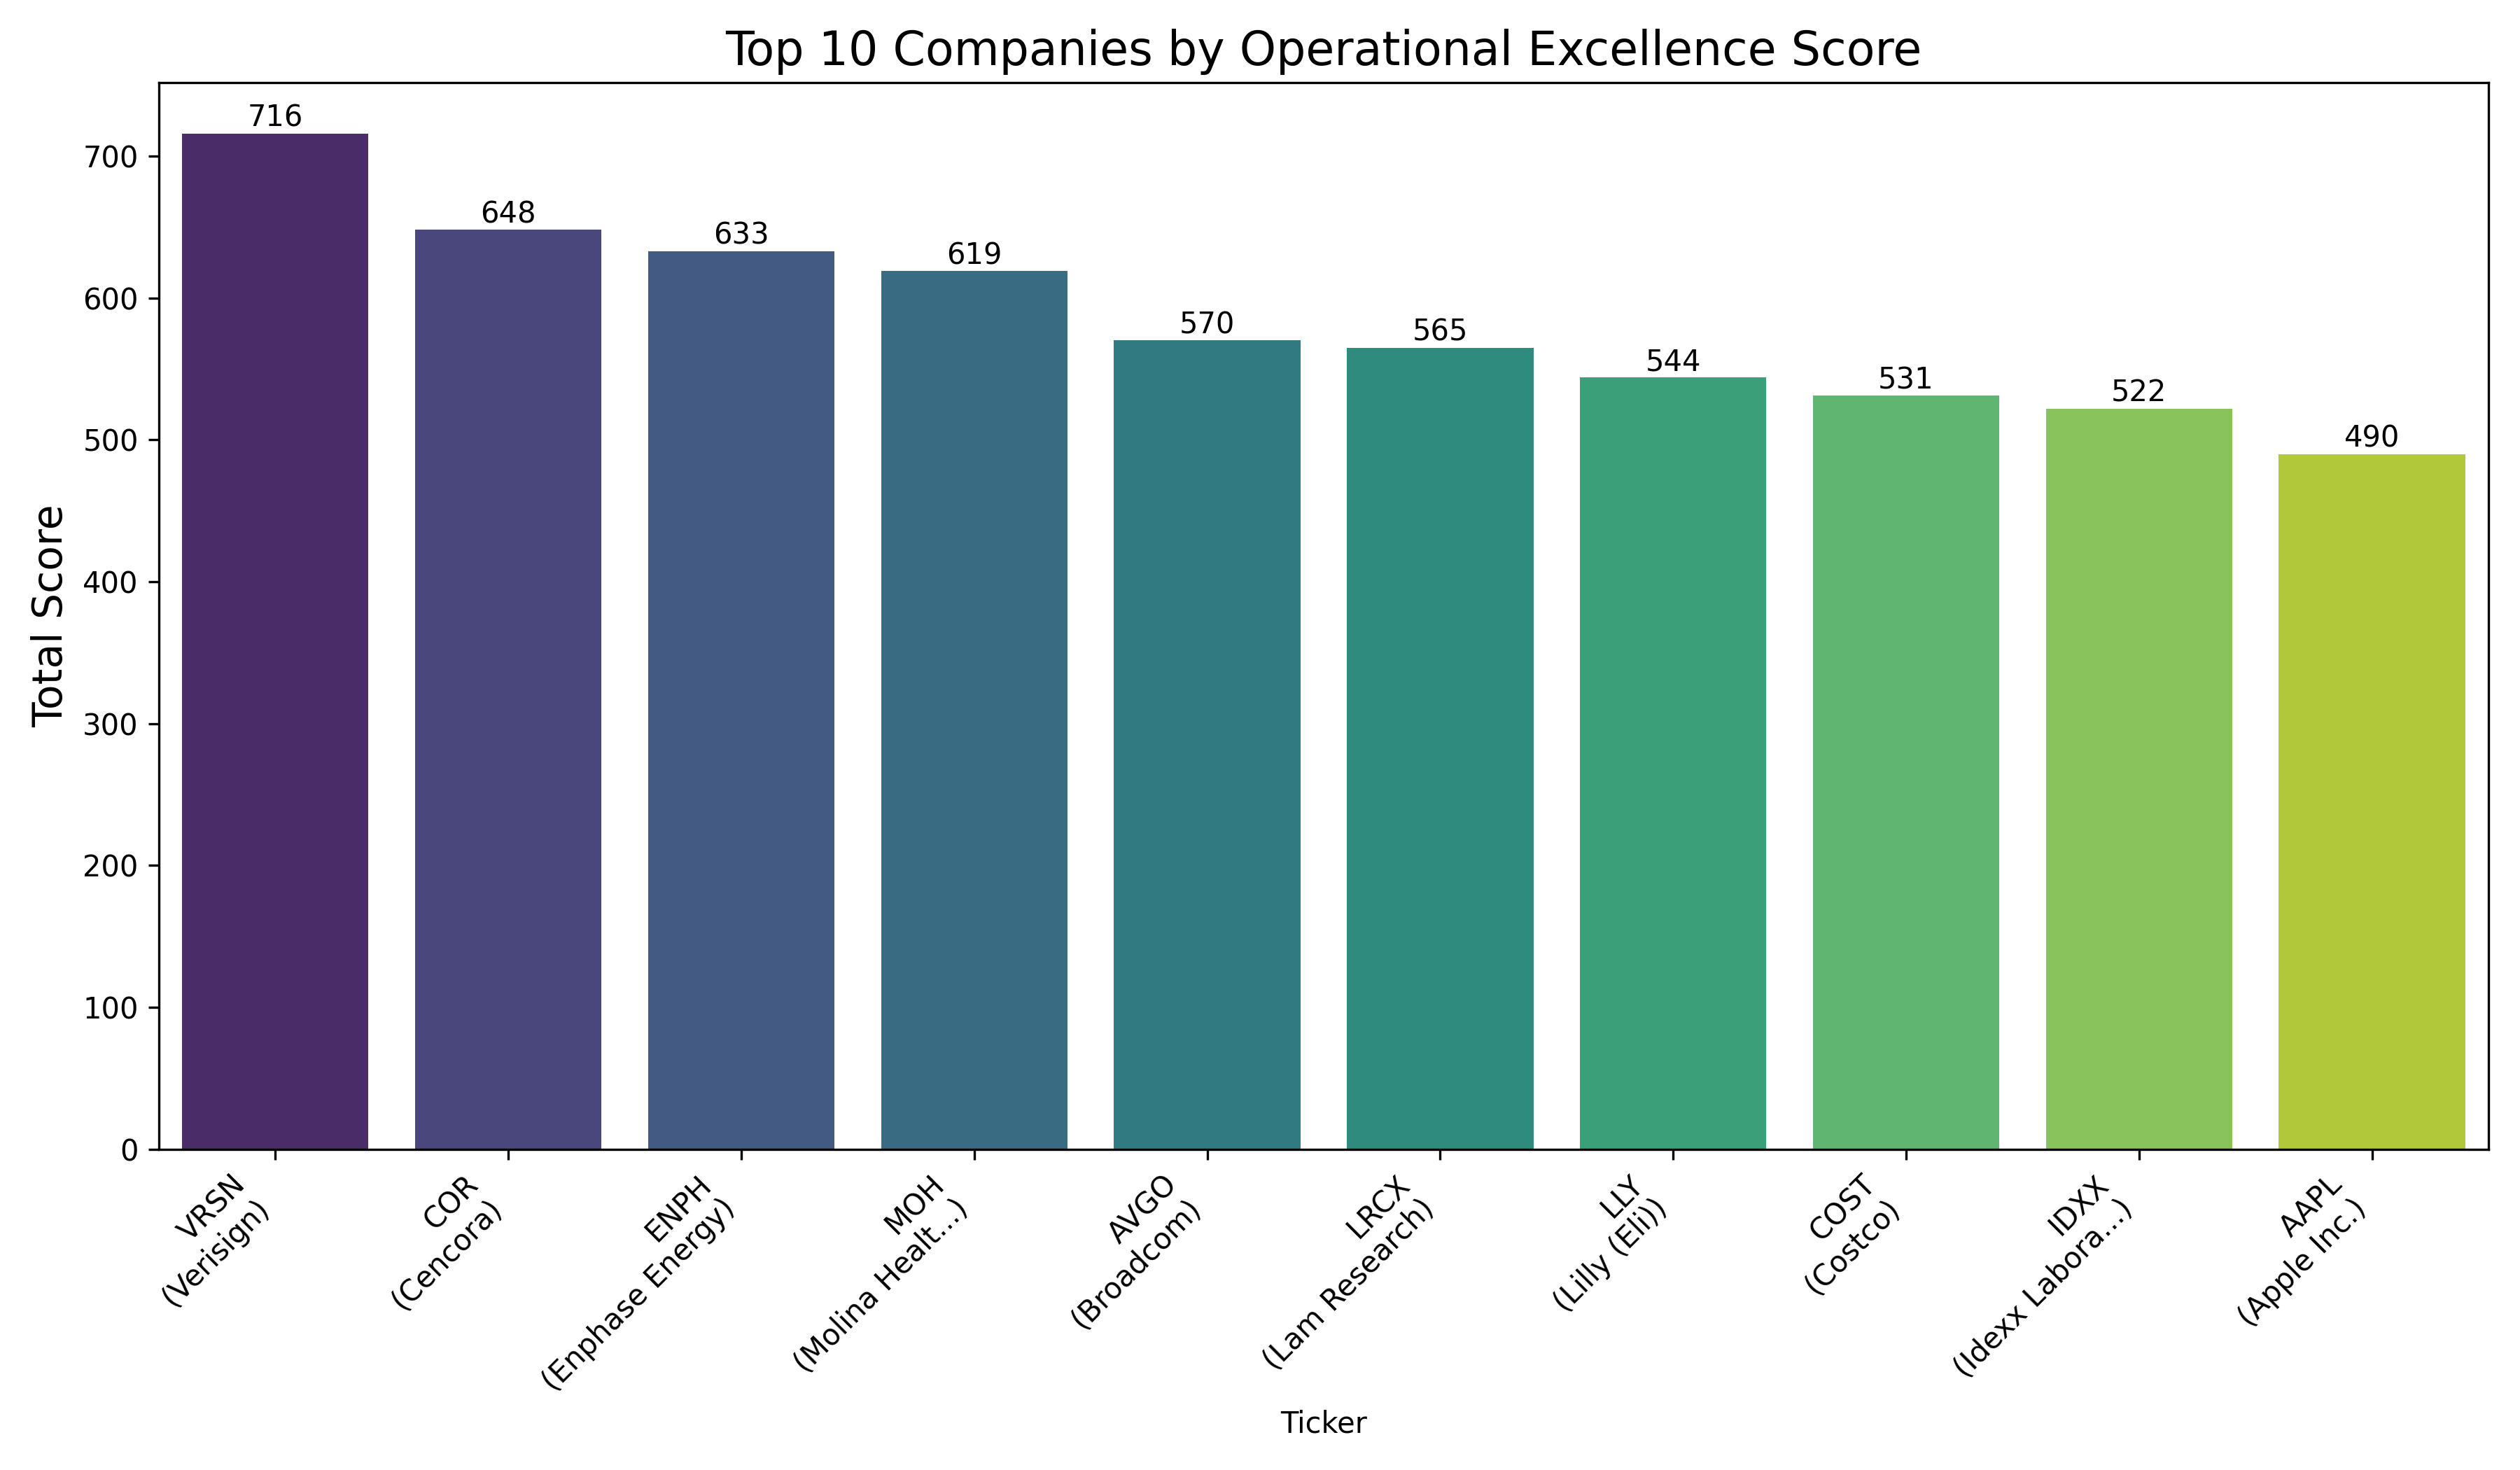
Verisign (VRSN) leads our ranking with an impressive score of 716, significantly ahead of the second-place Cencora (COR) at 648. What makes Verisign's performance particularly noteworthy is its balanced improvement across all metrics, especially its industry-leading asset turnover improvement of 0.222 and remarkable 15% ROA improvement. As the company behind much of the internet's domain name infrastructure, Verisign has clearly found ways to generate more value from its existing technical assets.
Enphase Energy (ENPH) stands out with the most dramatic operating margin improvement at 20.18%, showing that this renewable energy technology provider has significantly enhanced its profitability per dollar of sales. Meanwhile, healthcare company Molina (MOH) achieved the fourth position despite a slight decline in operating margin, demonstrating that substantial improvements in asset turnover can more than compensate for margin challenges.
Breaking Down the Key Metrics
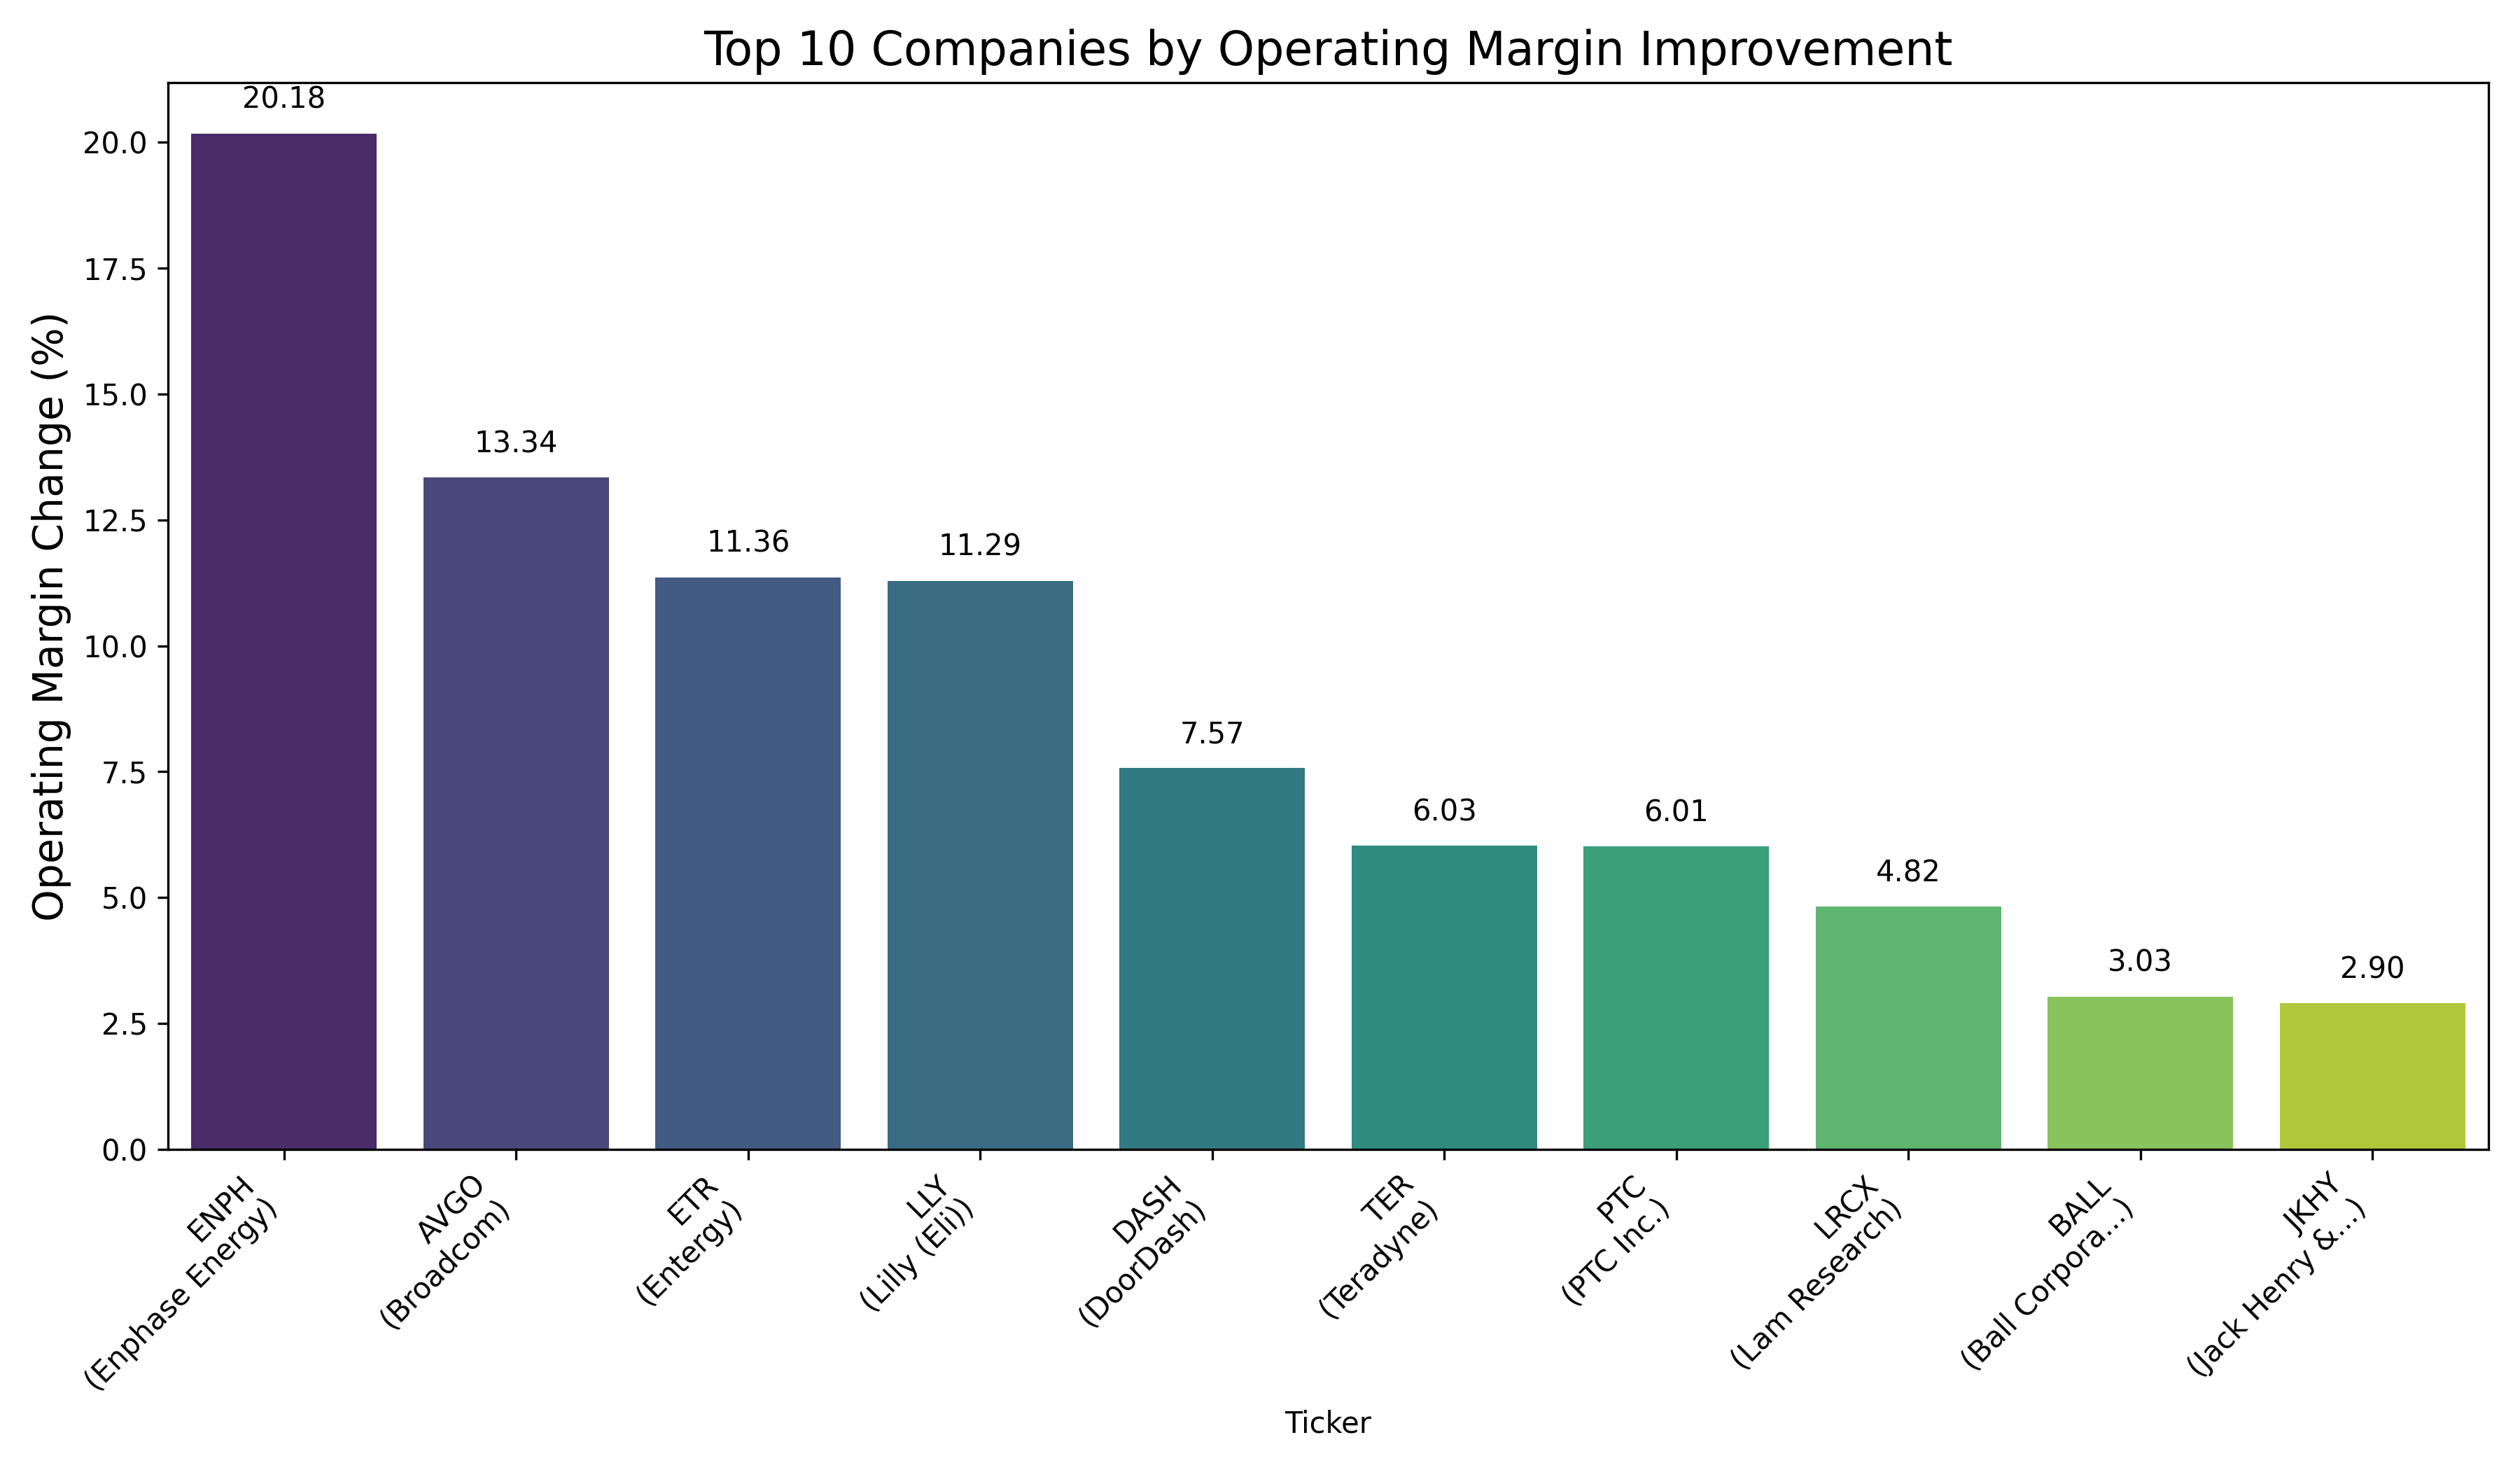
Operating margin improvements tell us which companies are becoming more profitable with their existing sales. Enphase Energy leads this category with an exceptional 20.18% improvement, followed by semiconductor giant Broadcom (AVGO) at 13.34% and pharmaceutical company Eli Lilly (LLY) at 11.29%. These substantial margin improvements often result from successful product innovation, pricing power, or effective cost-cutting initiatives.
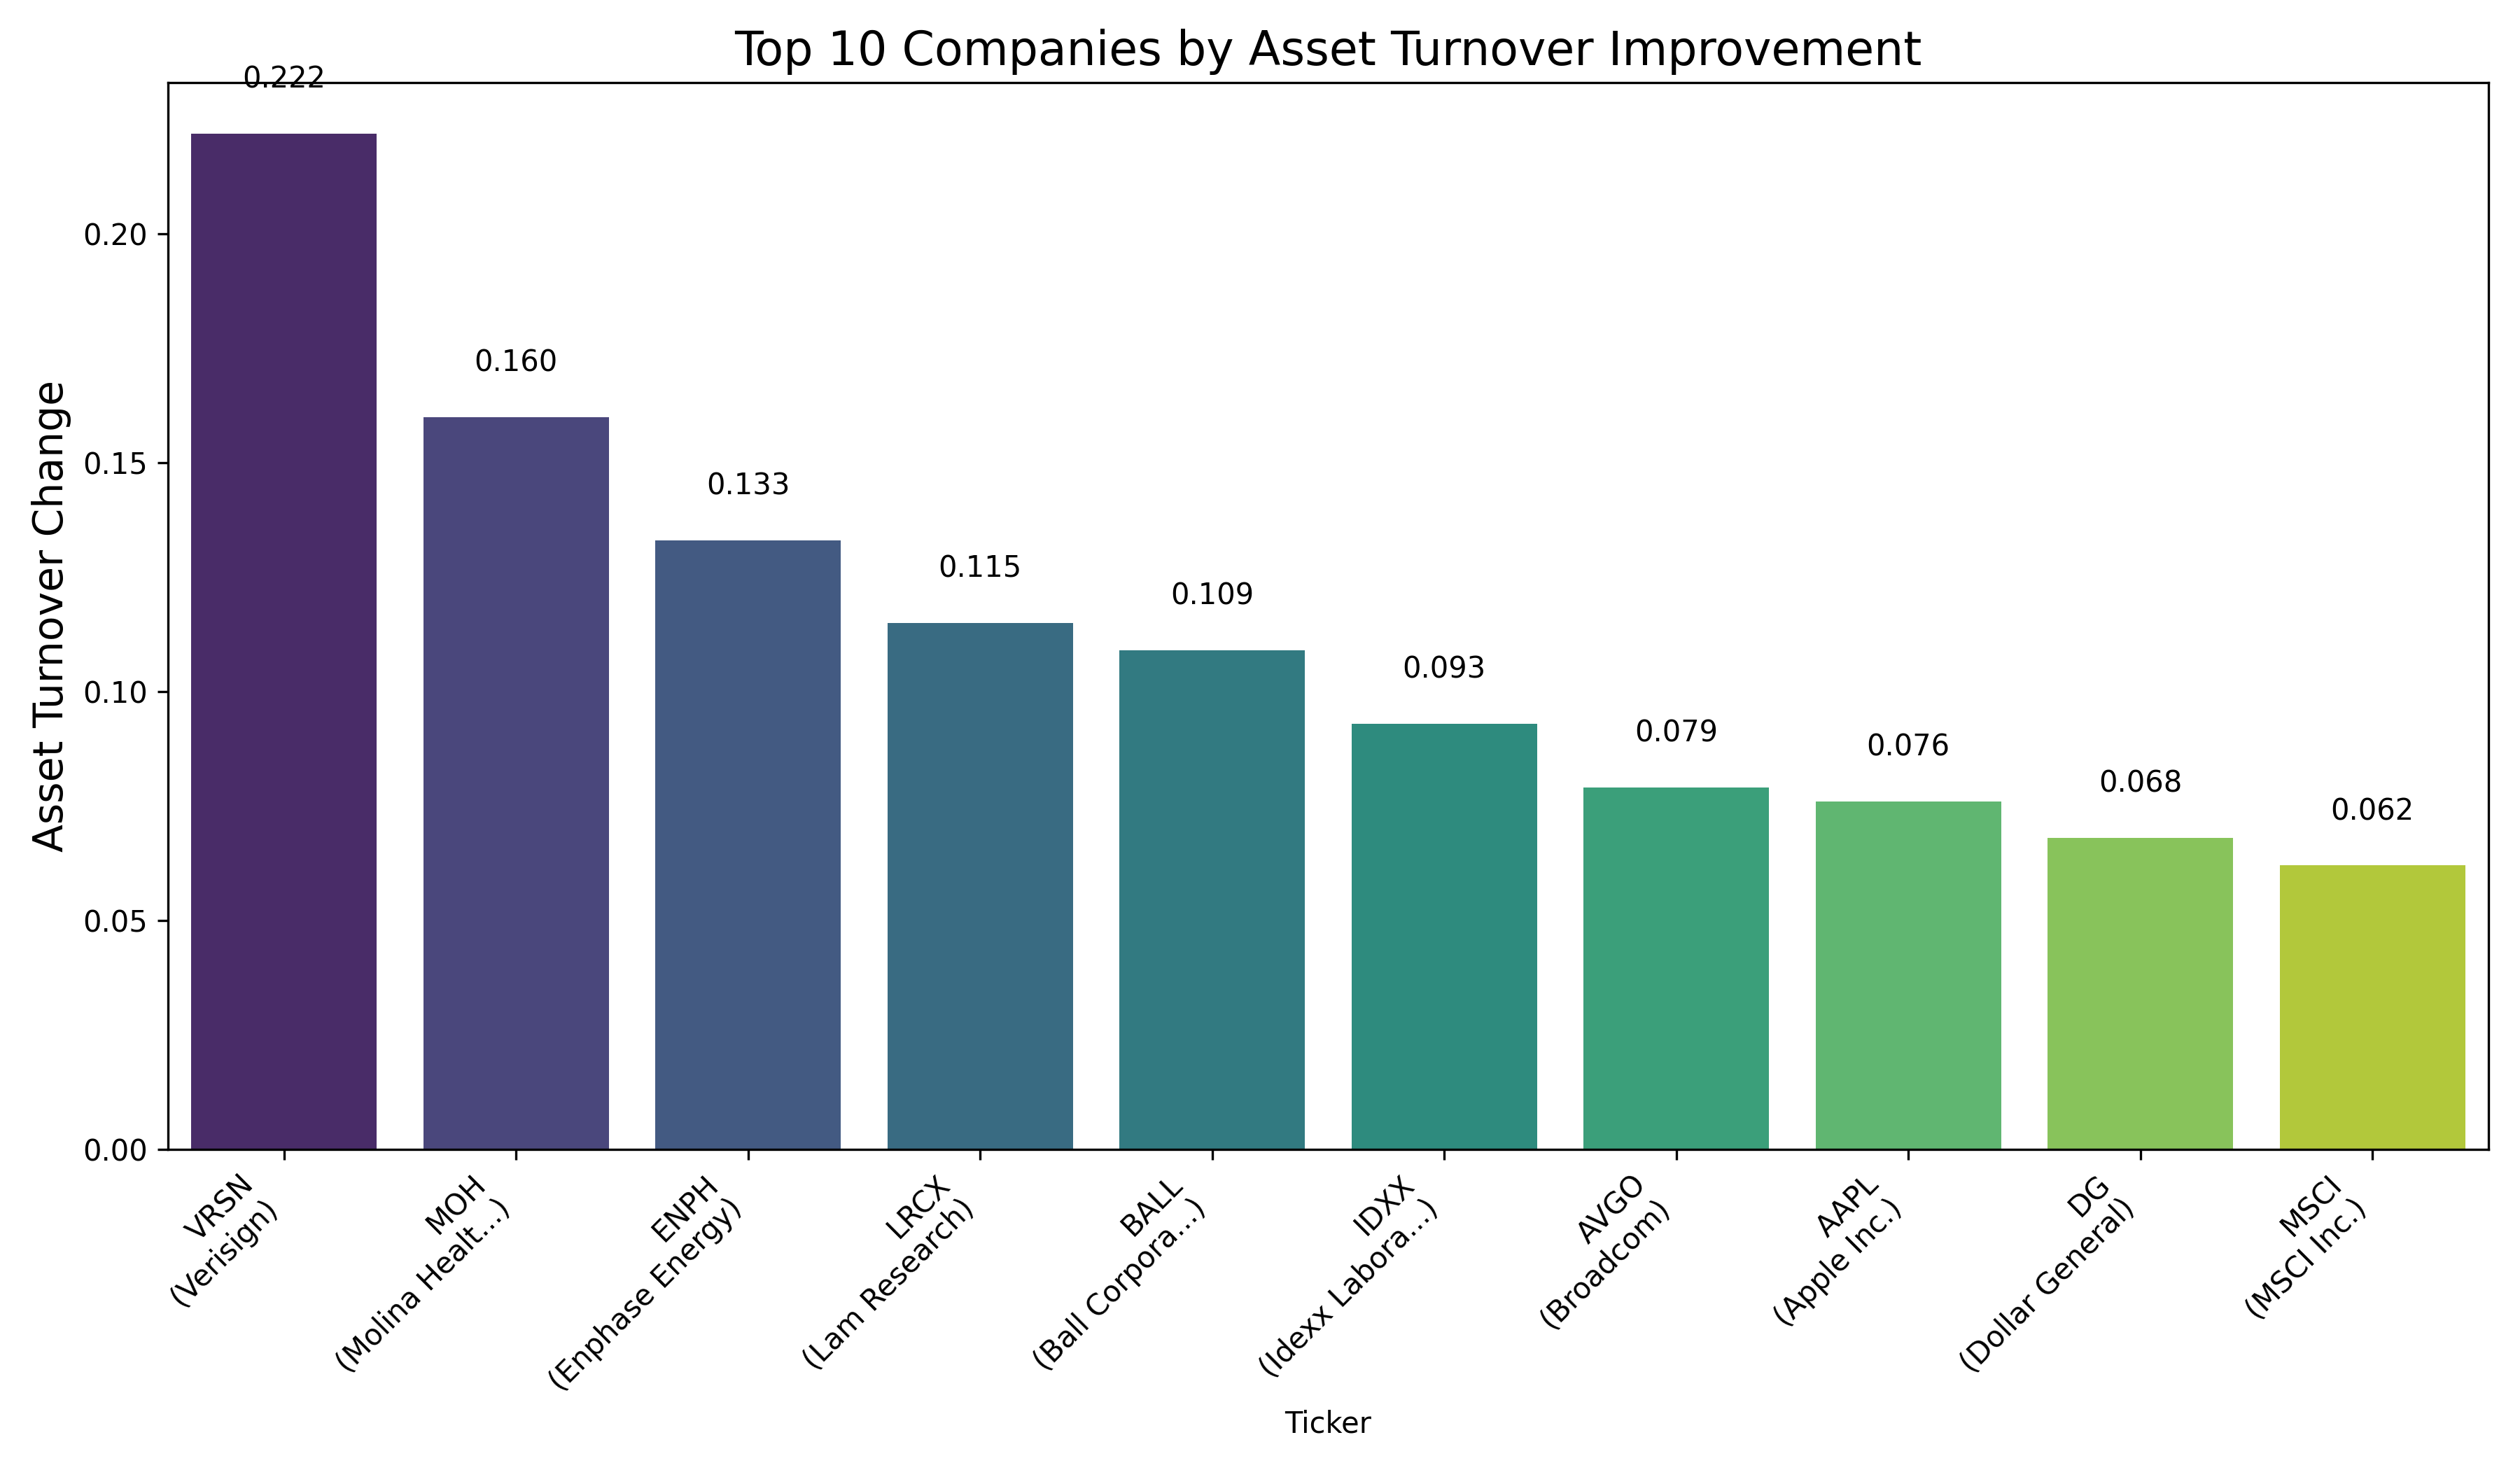
Asset turnover improvements highlight companies that are generating more revenue from their existing assets. Verisign leads in this metric, followed by Molina Healthcare and Enphase Energy. This efficiency metric is particularly important in capital-intensive industries where making the most of existing infrastructure, technology, and facilities can dramatically improve returns without requiring major new investments.
The Relationship Between Different Efficiency Metrics
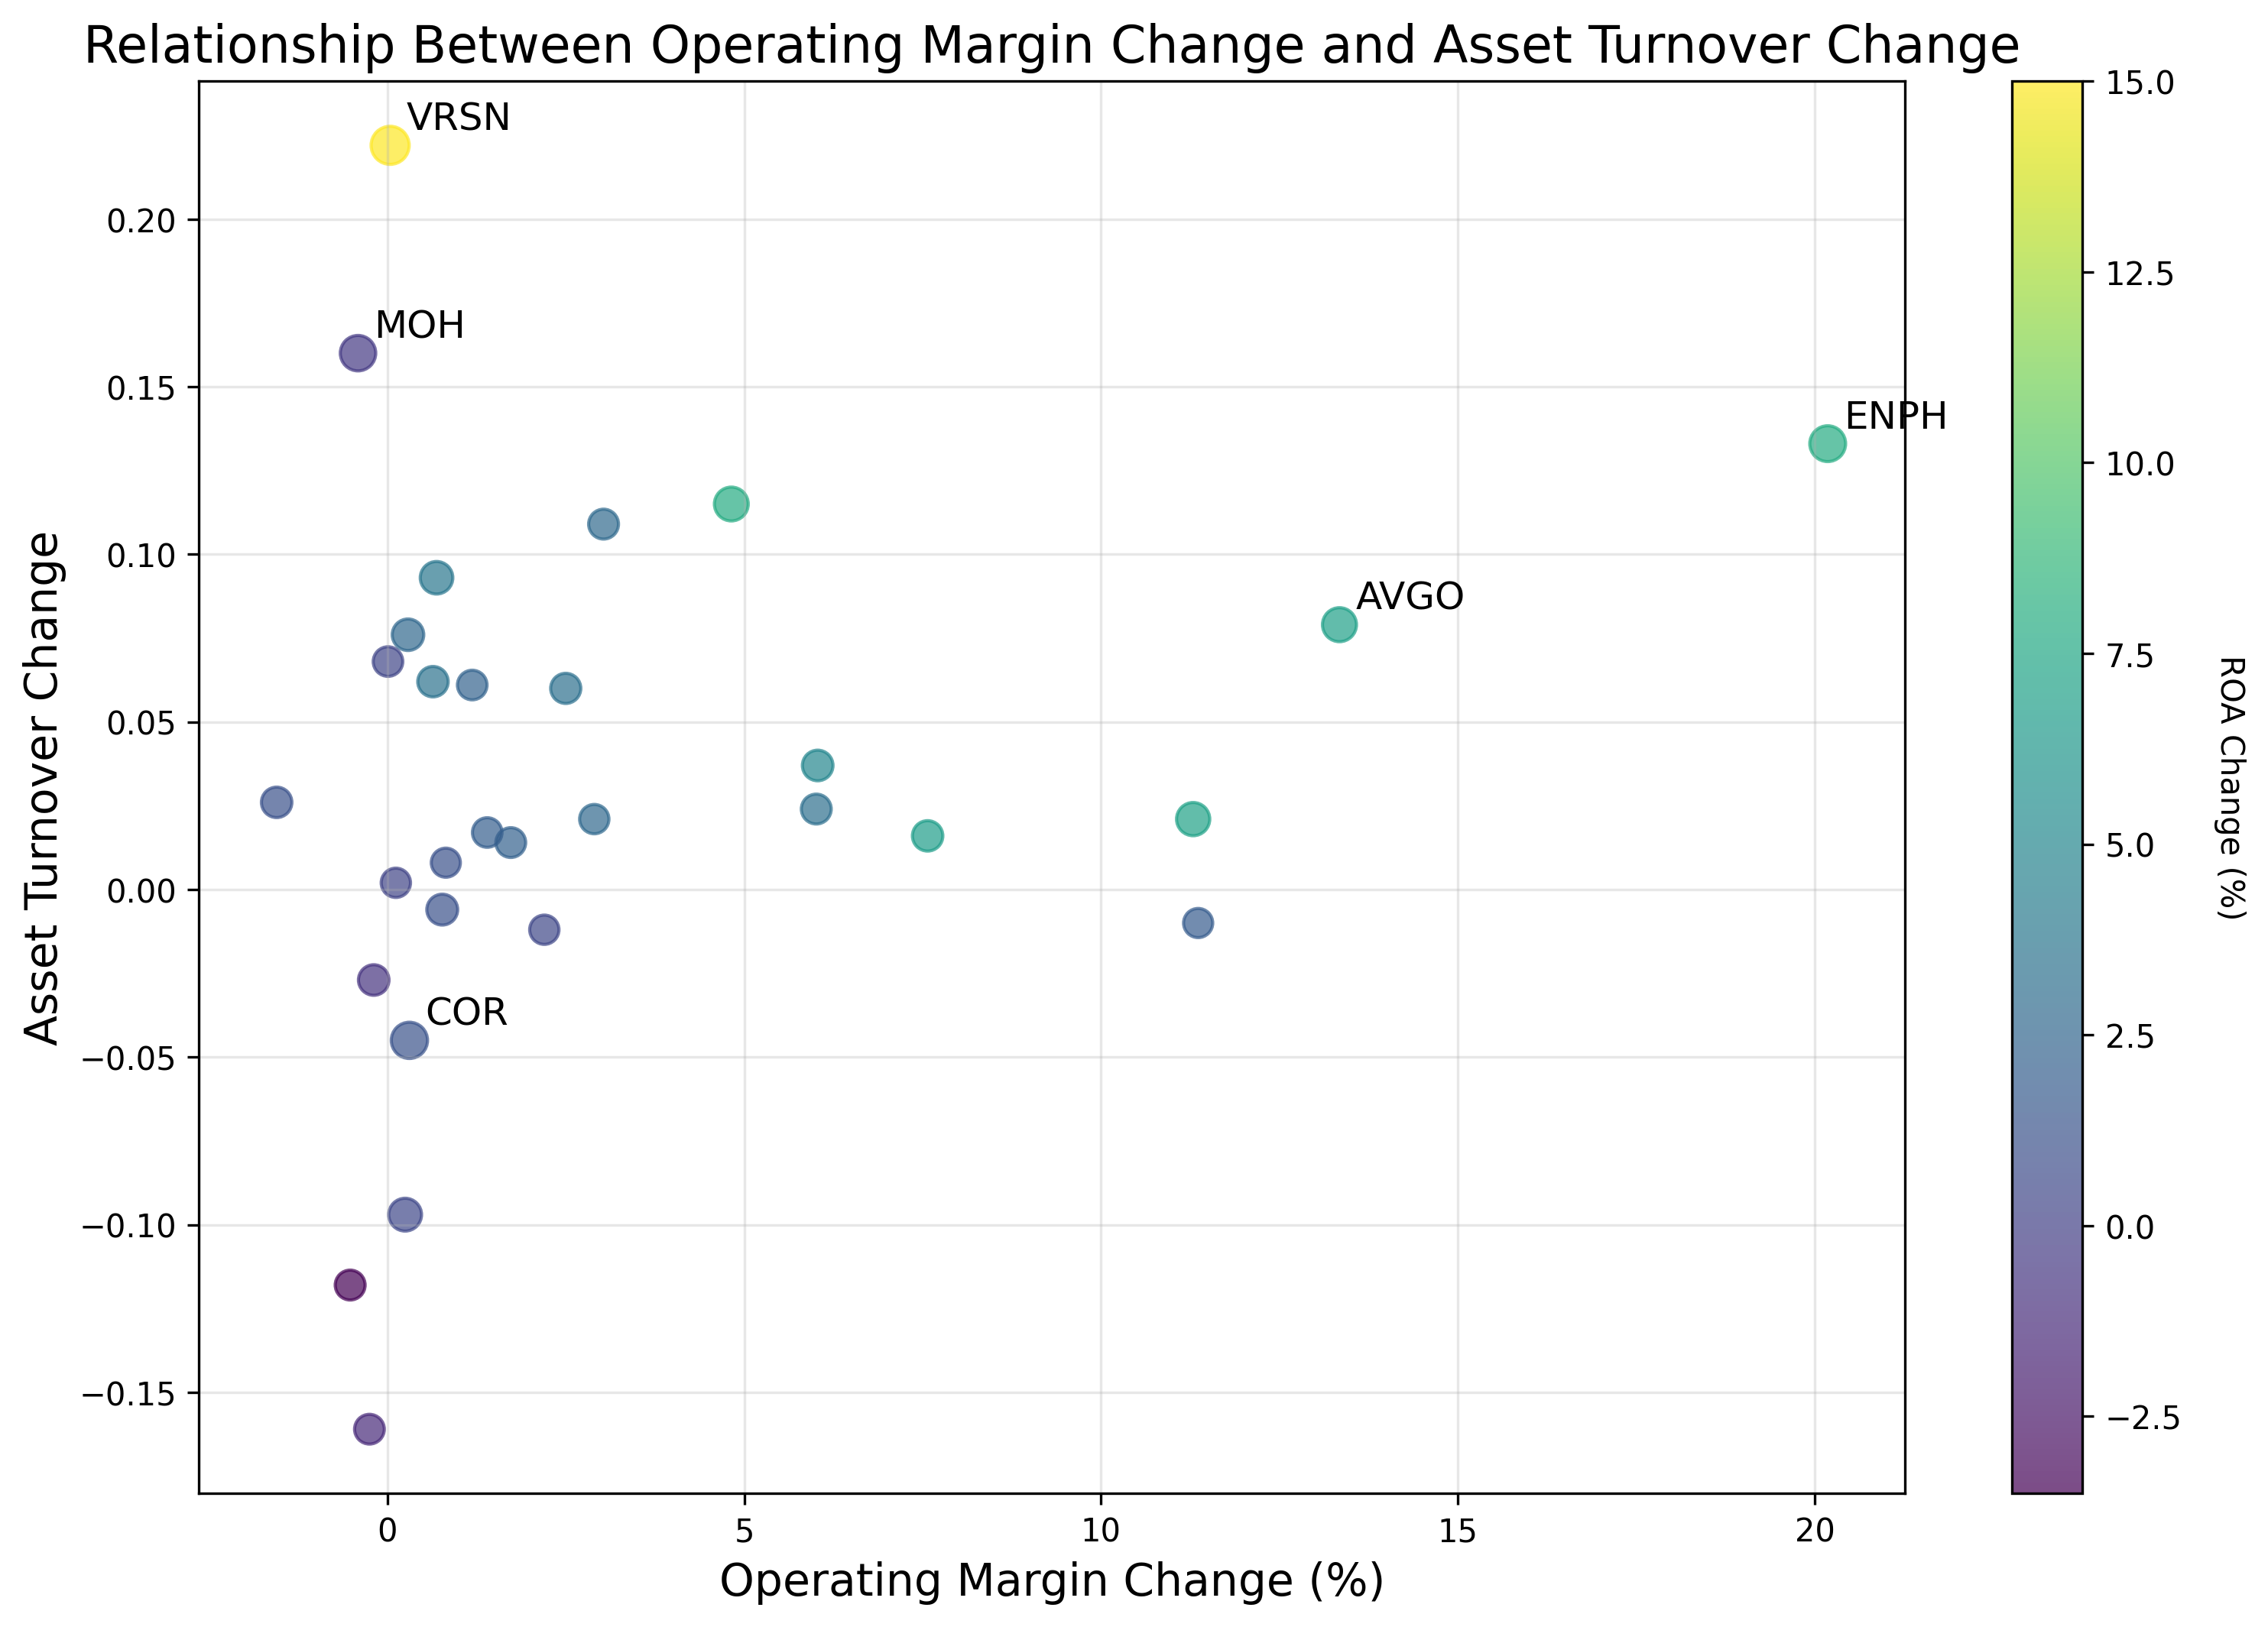
This visualization reveals an interesting pattern: companies tend to excel in either margin improvement or asset turnover improvement, but rarely in both simultaneously. The chart shows that most companies fall into either the 'margin improvers' (upper left) or the 'asset utilizers' (lower right) categories. The size of each dot represents the total score, while the color indicates ROA change. The top performers like Verisign and Enphase Energy stand out by achieving meaningful improvements across multiple dimensions.
Industry Diversity Among Top Performers
One of the most intriguing aspects of our analysis is the diversity of industries represented in the top ranks. From technology companies (Verisign, Apple) to healthcare providers (Molina, Eli Lilly), semiconductor manufacturers (Lam Research, Broadcom), and retailers (Costco), operational excellence can be achieved across various business models. This suggests that thoughtful management and strategic operational improvements can drive efficiency regardless of industry conditions.
- Technology companies in the top 10 benefit from scalable business models that can grow revenue without proportional increases in costs
- Healthcare companies show that even in highly regulated industries, operational improvements can drive significant value
- Retail presence (Costco) demonstrates that even in traditionally low-margin businesses, incremental efficiency gains matter
- Semiconductor companies highlight how manufacturing efficiency and capacity utilization directly impact financial performance
What This Means for Investors
Operational efficiency metrics provide valuable insights beyond traditional performance indicators. While quarterly earnings reports often drive short-term market reactions, these efficiency improvements may indicate which companies are building stronger foundations for long-term success. Companies that improve their operational metrics often demonstrate management skill in resource allocation and process optimization.
It's worth noting that operational efficiency is just one dimension of company performance. Market conditions, competitive positioning, innovation pipelines, and many other factors also influence a company's prospects. This analysis provides a focused lens on operational excellence, offering a complementary perspective to other financial and strategic assessments.
Key Takeaways
- Verisign leads in operational excellence with balanced improvements across all metrics
- Companies can reach the top through different paths: margin improvement, asset efficiency, or a combination
- Operational excellence transcends industry boundaries, appearing in tech, healthcare, retail, and manufacturing
- Efficiency improvements may indicate strong management execution and potential for sustained performance
Comments (0)
No comments yet. Be the first to comment!