In the competitive landscape of corporate innovation, not all research and development spending delivers equal returns. While many investors focus on absolute R&D dollars, a more nuanced approach examines how efficiently companies convert their research investments into tangible financial results. Our unique "R&D Efficiency" metric measures how effectively companies translate their R&D spending into free cash flow growth, revealing which organizations extract the most value from each dollar invested in innovation.
The R&D Efficiency Metric Explained
The R&D Efficiency score represents the ratio between a company's free cash flow growth and its R&D intensity (R&D spending as a percentage of revenue). In simpler terms, it measures how many dollars of incremental cash flow a company generates from each percentage point of revenue invested in research and development. Companies with high scores are adept at converting research investments into cash-generating innovations.
Top 15 R&D Efficiency Champions
Our analysis of S&P 500 companies reveals a diverse group of leaders across sectors that excel at monetizing their innovation investments. Surprisingly, traditional industries dominate the rankings, demonstrating that R&D efficiency isn't exclusive to technology companies.
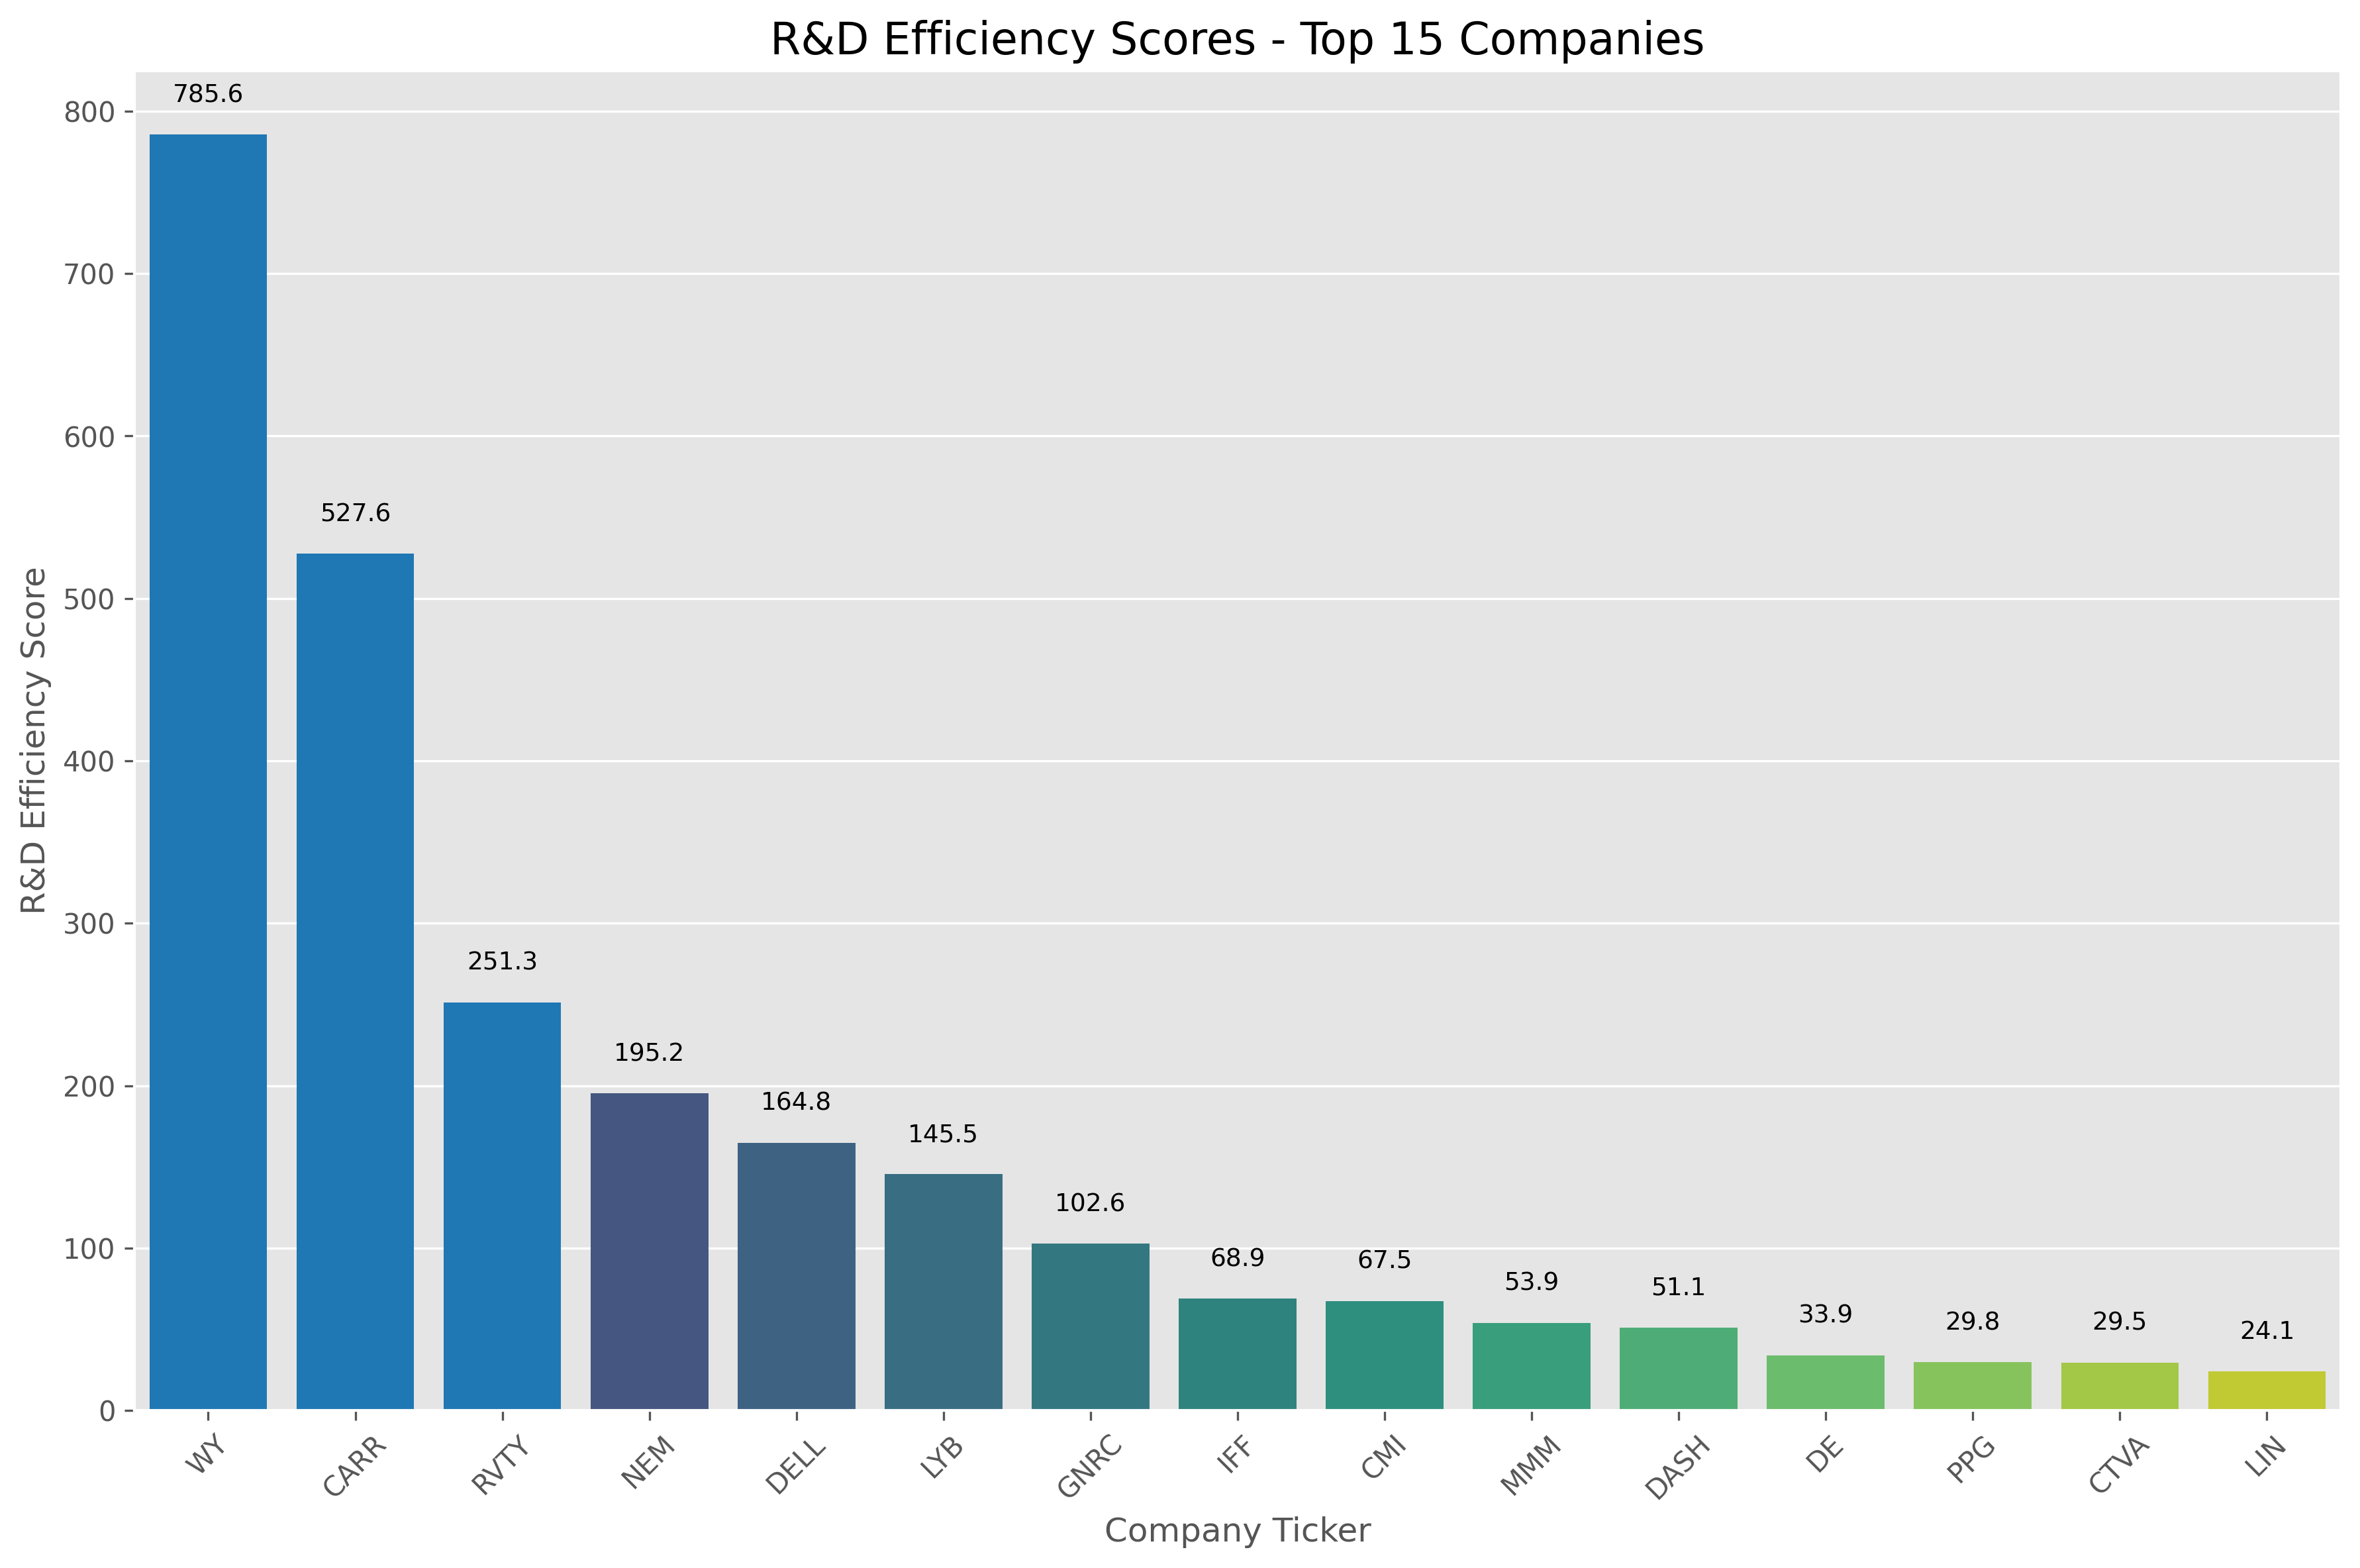
The rankings reveal a fascinating pattern: companies with relatively modest R&D investments can achieve remarkable efficiency scores when those investments directly translate to substantial free cash flow. Weyerhaeuser (WY) stands as the prime example, turning a mere $7 million R&D investment into $592 million in free cash flow, resulting in an efficiency score of 785.6—nearly 50% higher than the second-place finisher.
| Rank | Ticker | Sector | R&D Efficiency | R&D Investment | Free Cash Flow | R&D/Revenue |
|---|---|---|---|---|---|---|
| 1 | WY | Other | 785.6 | $7.0M | $592.0M | 0.1% |
| 2 | CARR | Other | 527.6 | $686.0M | $44.0M | 3.1% |
| 3 | RVTY | Industrial/Manufacturing | 251.3 | $196.8M | $541.7M | 7.1% |
| 4 | NEM | Materials/Energy | 195.2 | $197.0M | $2961.0M | 1.1% |
| 5 | DELL | Other | 164.8 | $3061.0M | $1869.0M | 3.2% |
Sector Analysis: Who Leads in R&D Efficiency?
When we examine R&D efficiency by sector, a surprising pattern emerges. Materials and energy companies lead the pack, followed by traditional industrial manufacturers. This contradicts the common assumption that technology and healthcare companies, which typically invest heavily in R&D, would dominate such a metric.
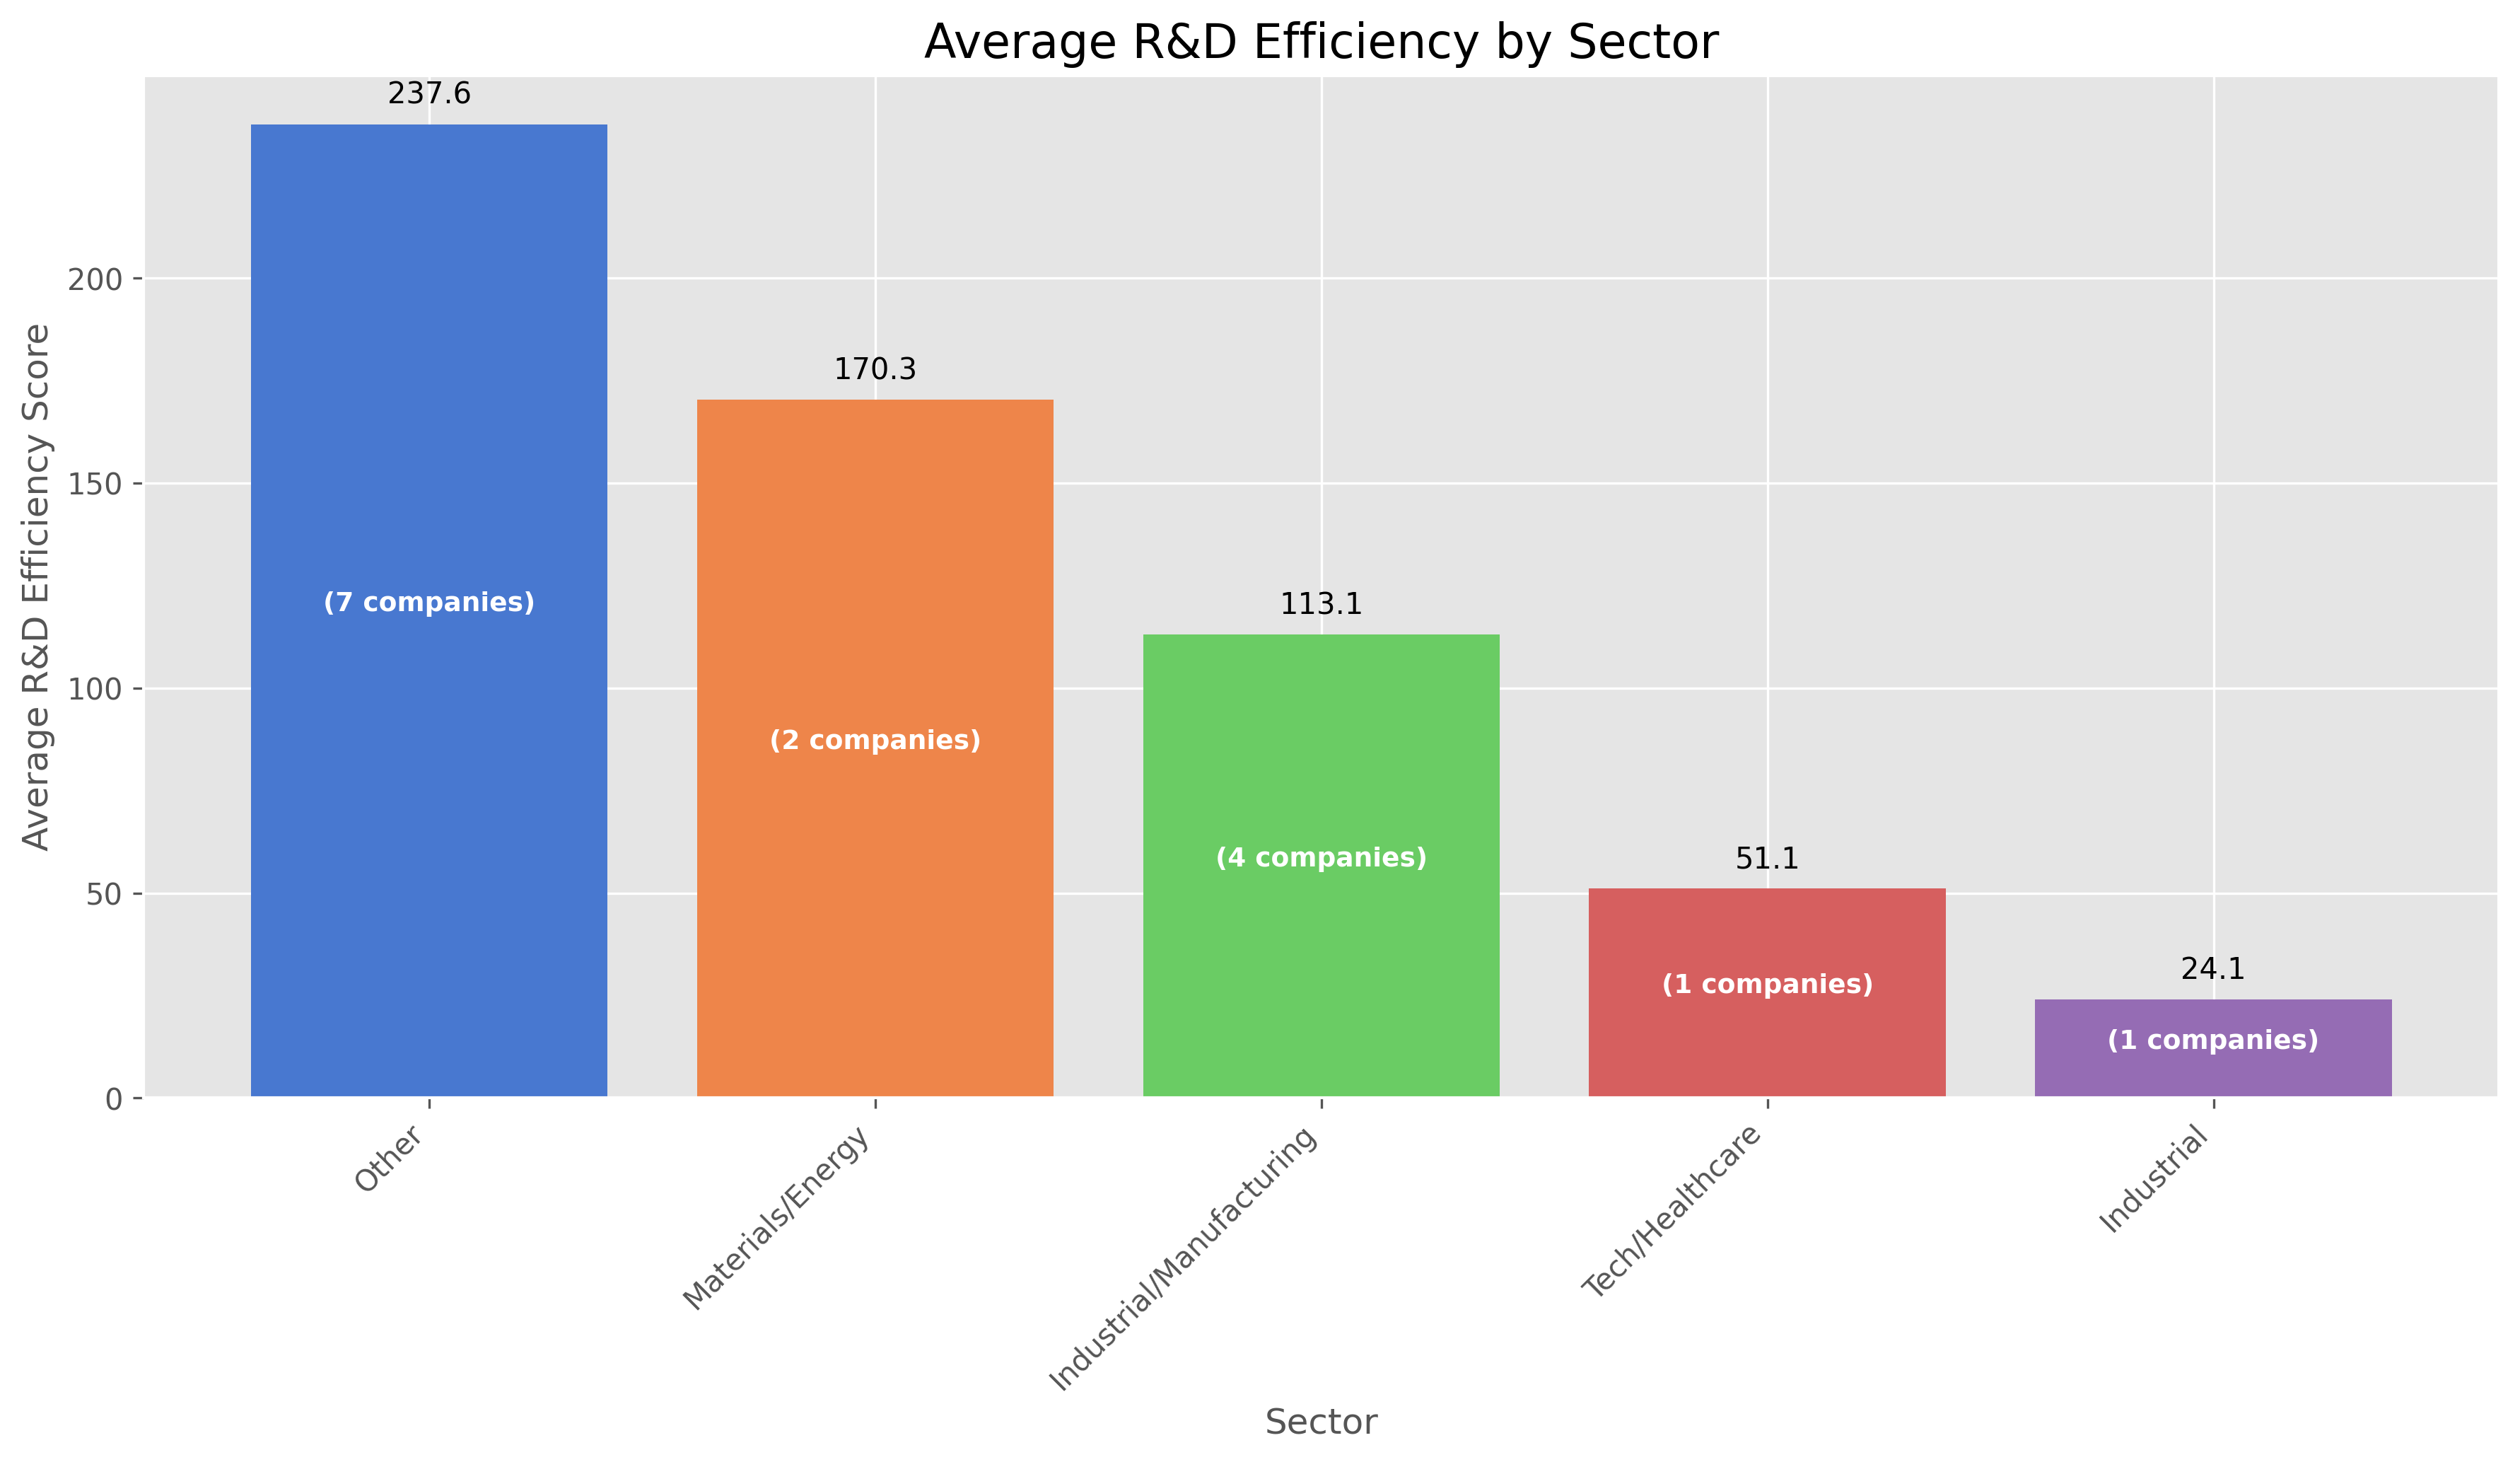
This sector analysis suggests that companies in traditional industries may be more disciplined in their R&D spending, focusing on high-return projects with clear commercial applications. Meanwhile, tech and healthcare companies often pursue more speculative research with uncertain returns, leading to lower average efficiency scores despite their reputation for innovation.
The Size Factor: Does Company Scale Impact R&D Efficiency?
An important question for investors is whether company size correlates with R&D efficiency. Our analysis reveals a fascinating inverse relationship: smaller companies by market capitalization tend to achieve higher R&D efficiency scores, while larger corporations generally show lower efficiency despite their resource advantages.
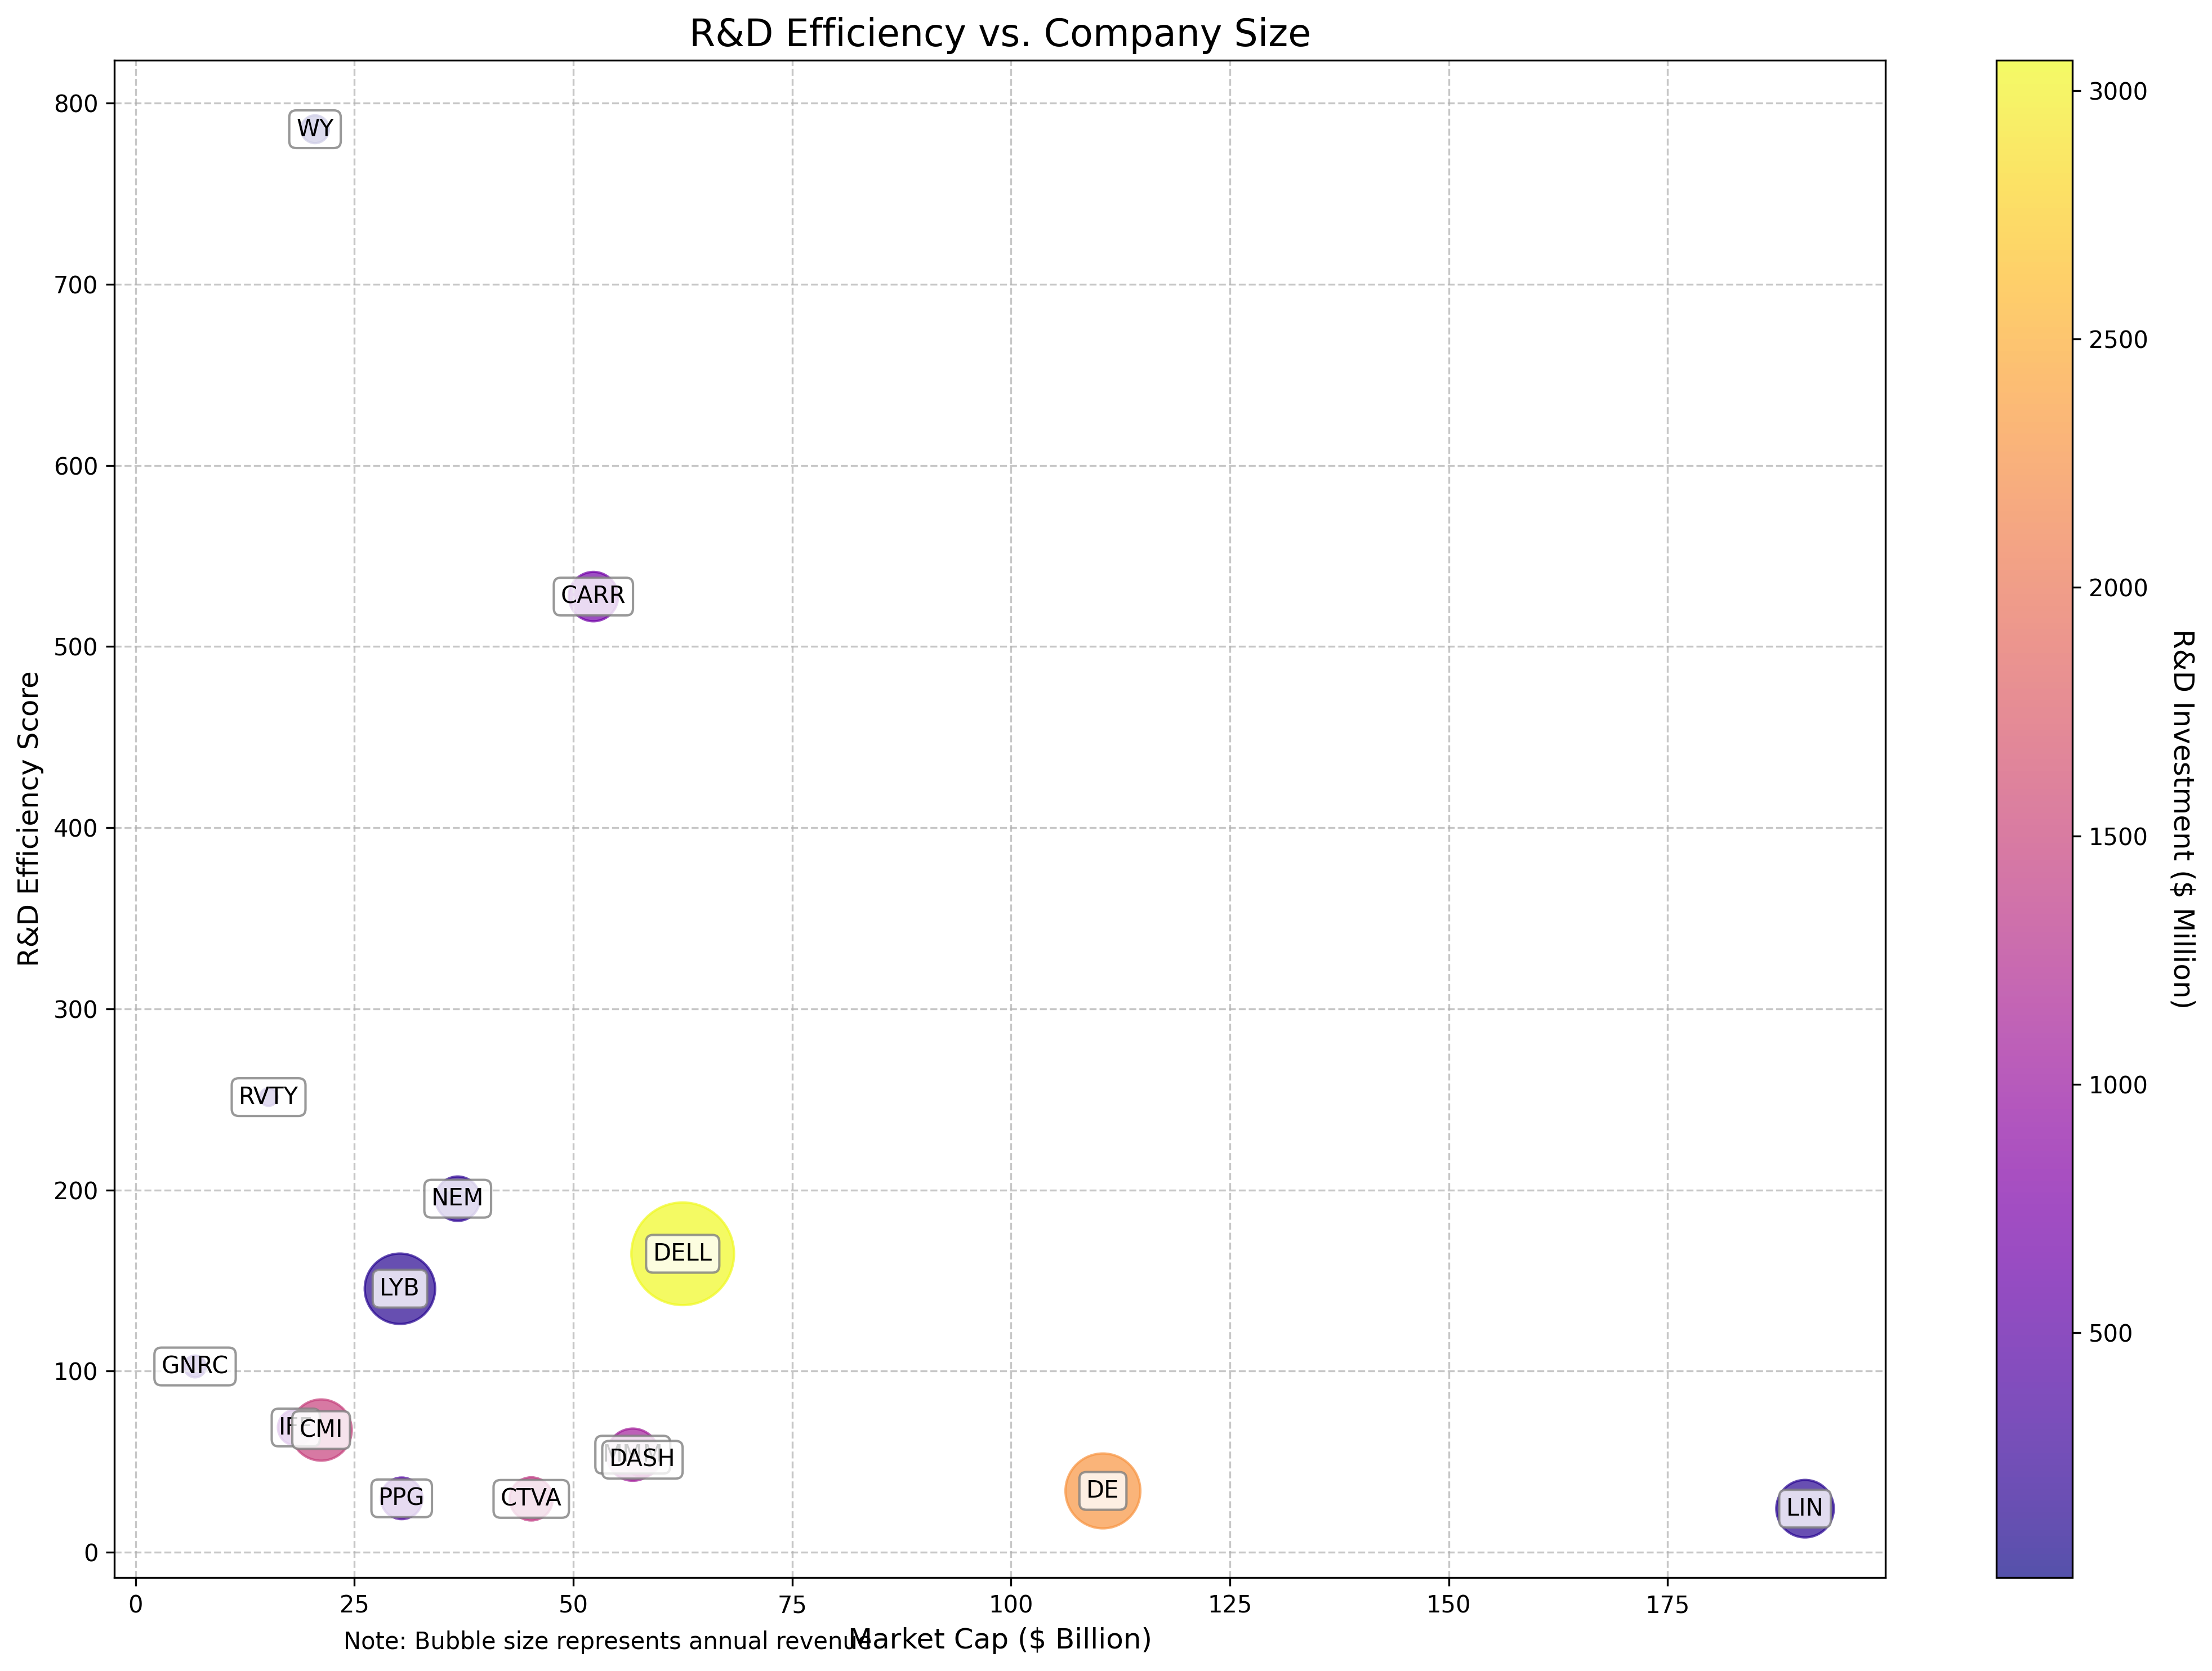
This pattern suggests that smaller companies may benefit from more focused innovation strategies, less bureaucratic decision-making processes, and greater organizational agility. Larger corporations, while benefiting from economies of scale in many areas, appear to face diminishing returns on their R&D investments, possibly due to more complex approval processes, competing internal priorities, or the need to maintain diverse research portfolios.
The Investment-Return Relationship: Optimizing R&D Spending
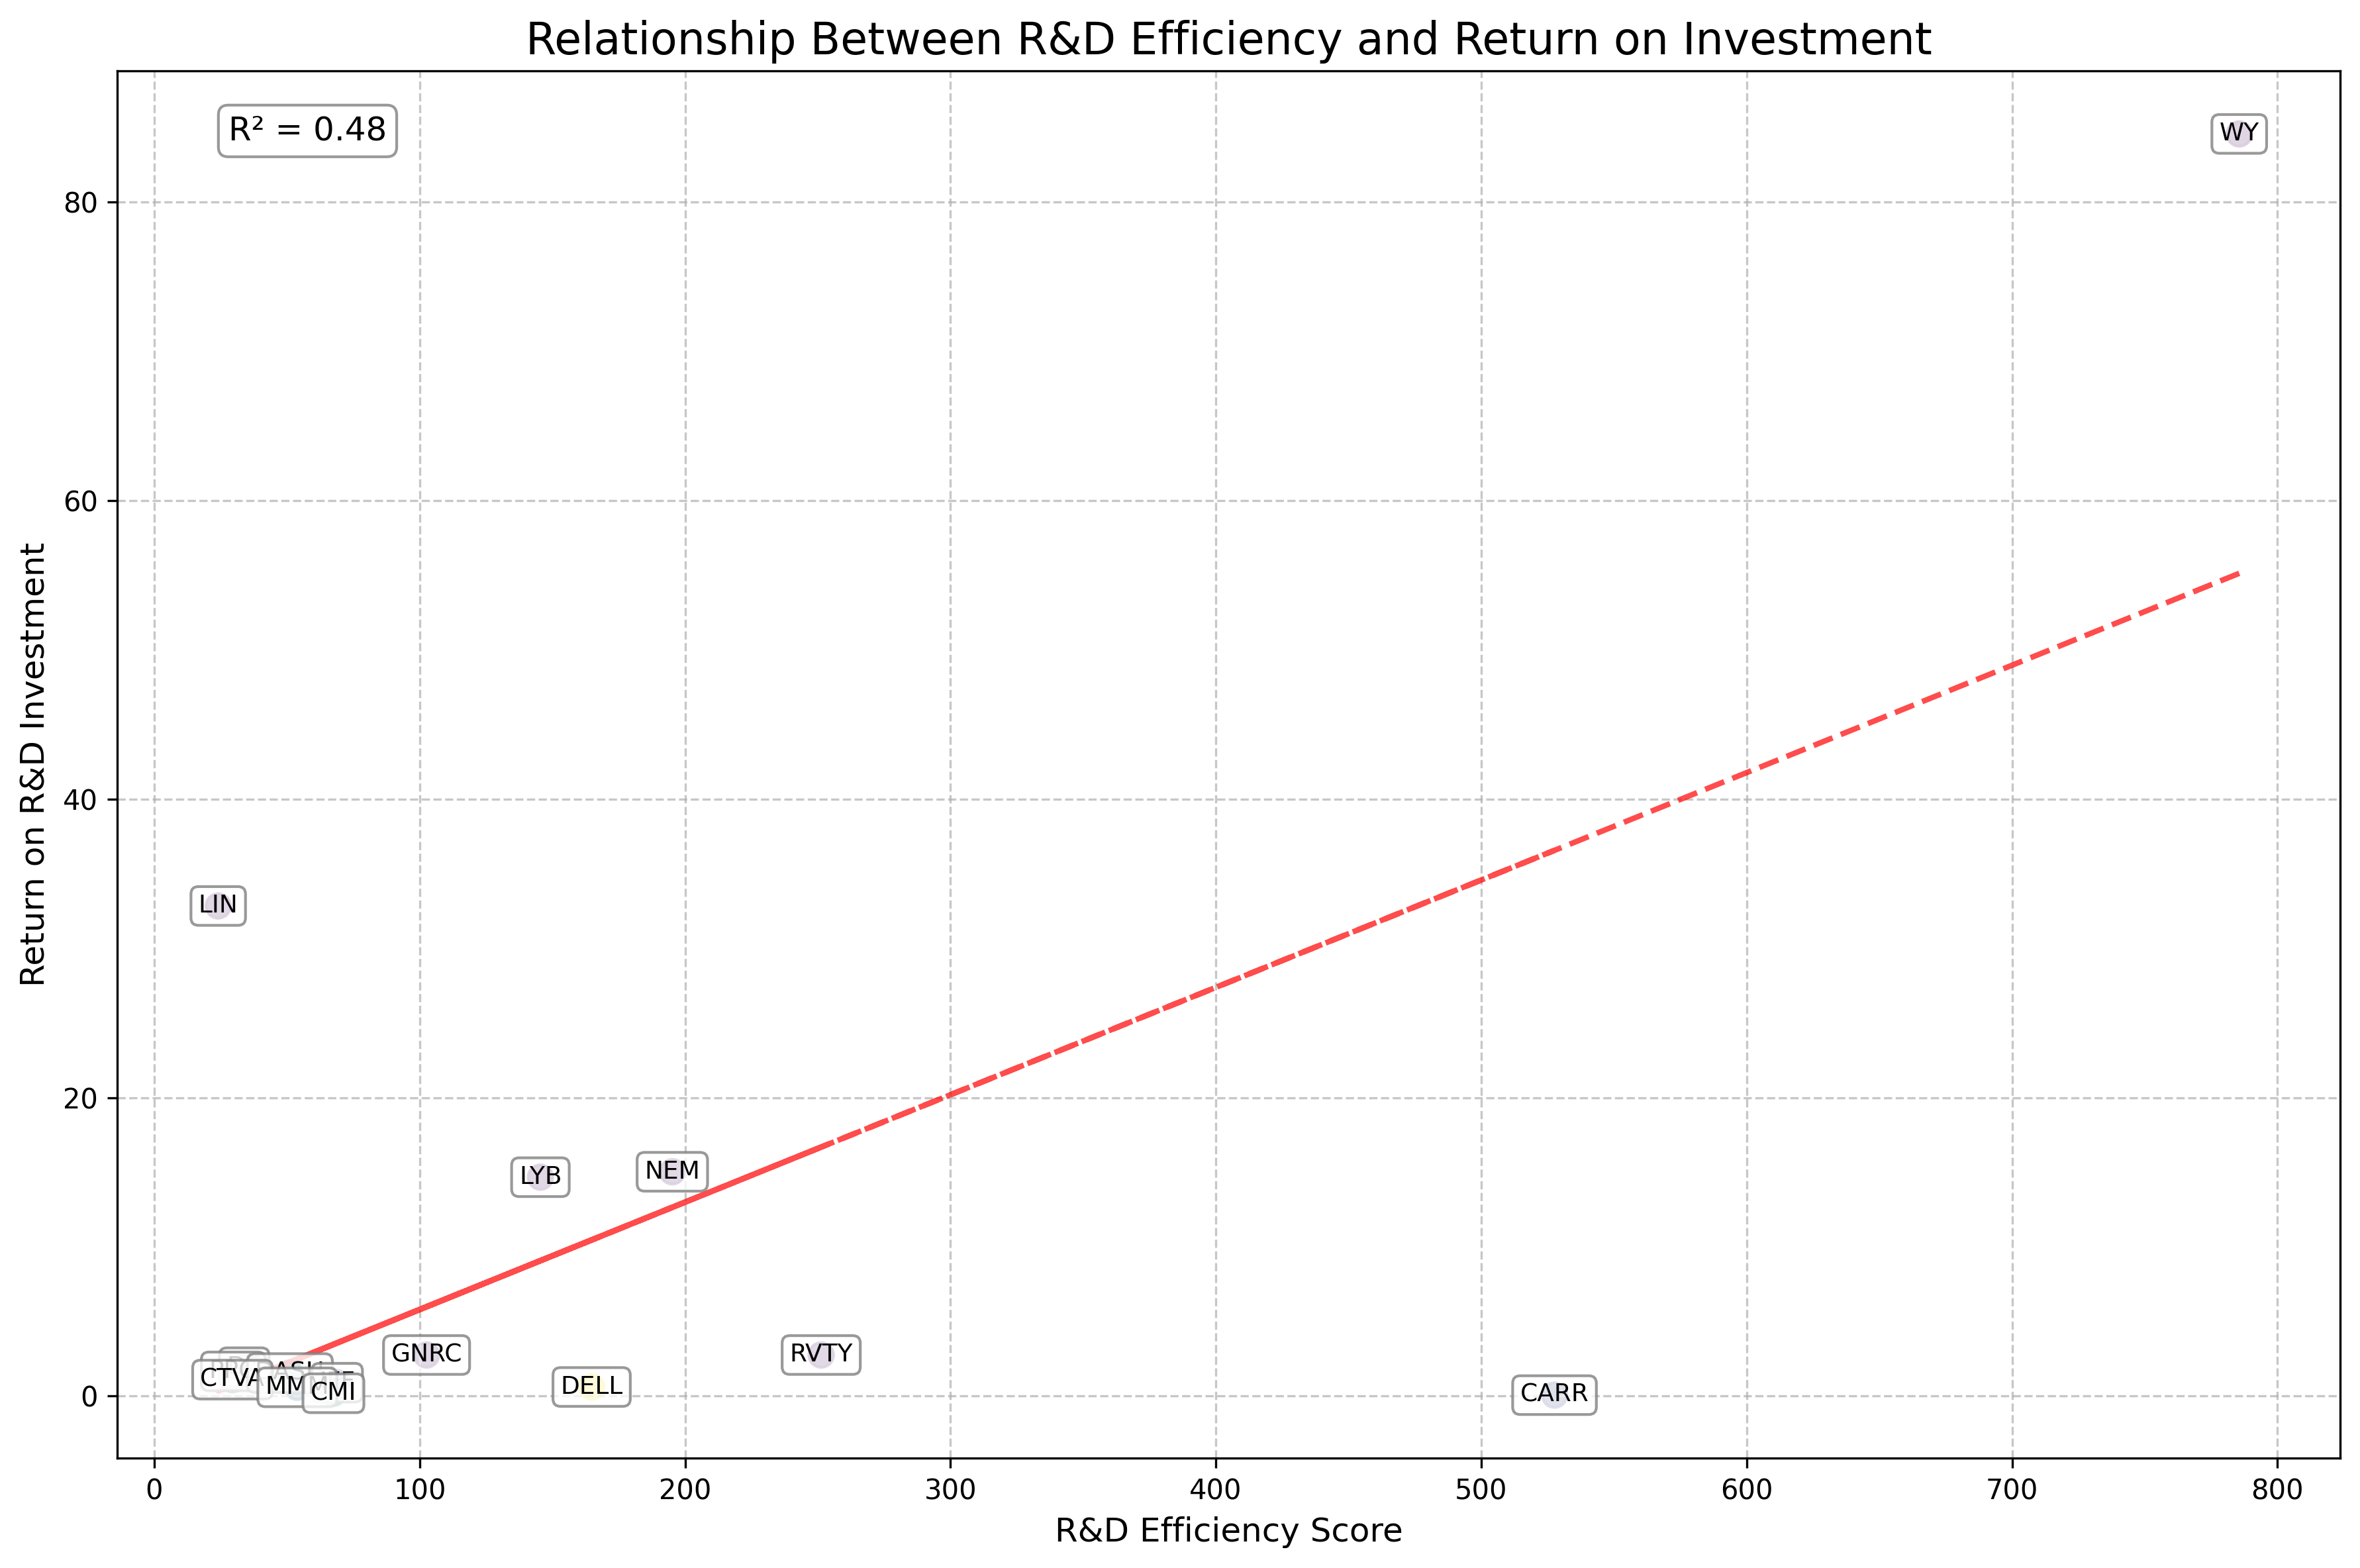
A deeper examination of the relationship between R&D investment and free cash flow reveals important insights about optimal spending levels. The data suggests that companies achieving the highest efficiency scores aren't necessarily those spending the most on R&D, but rather those allocating their resources most effectively.
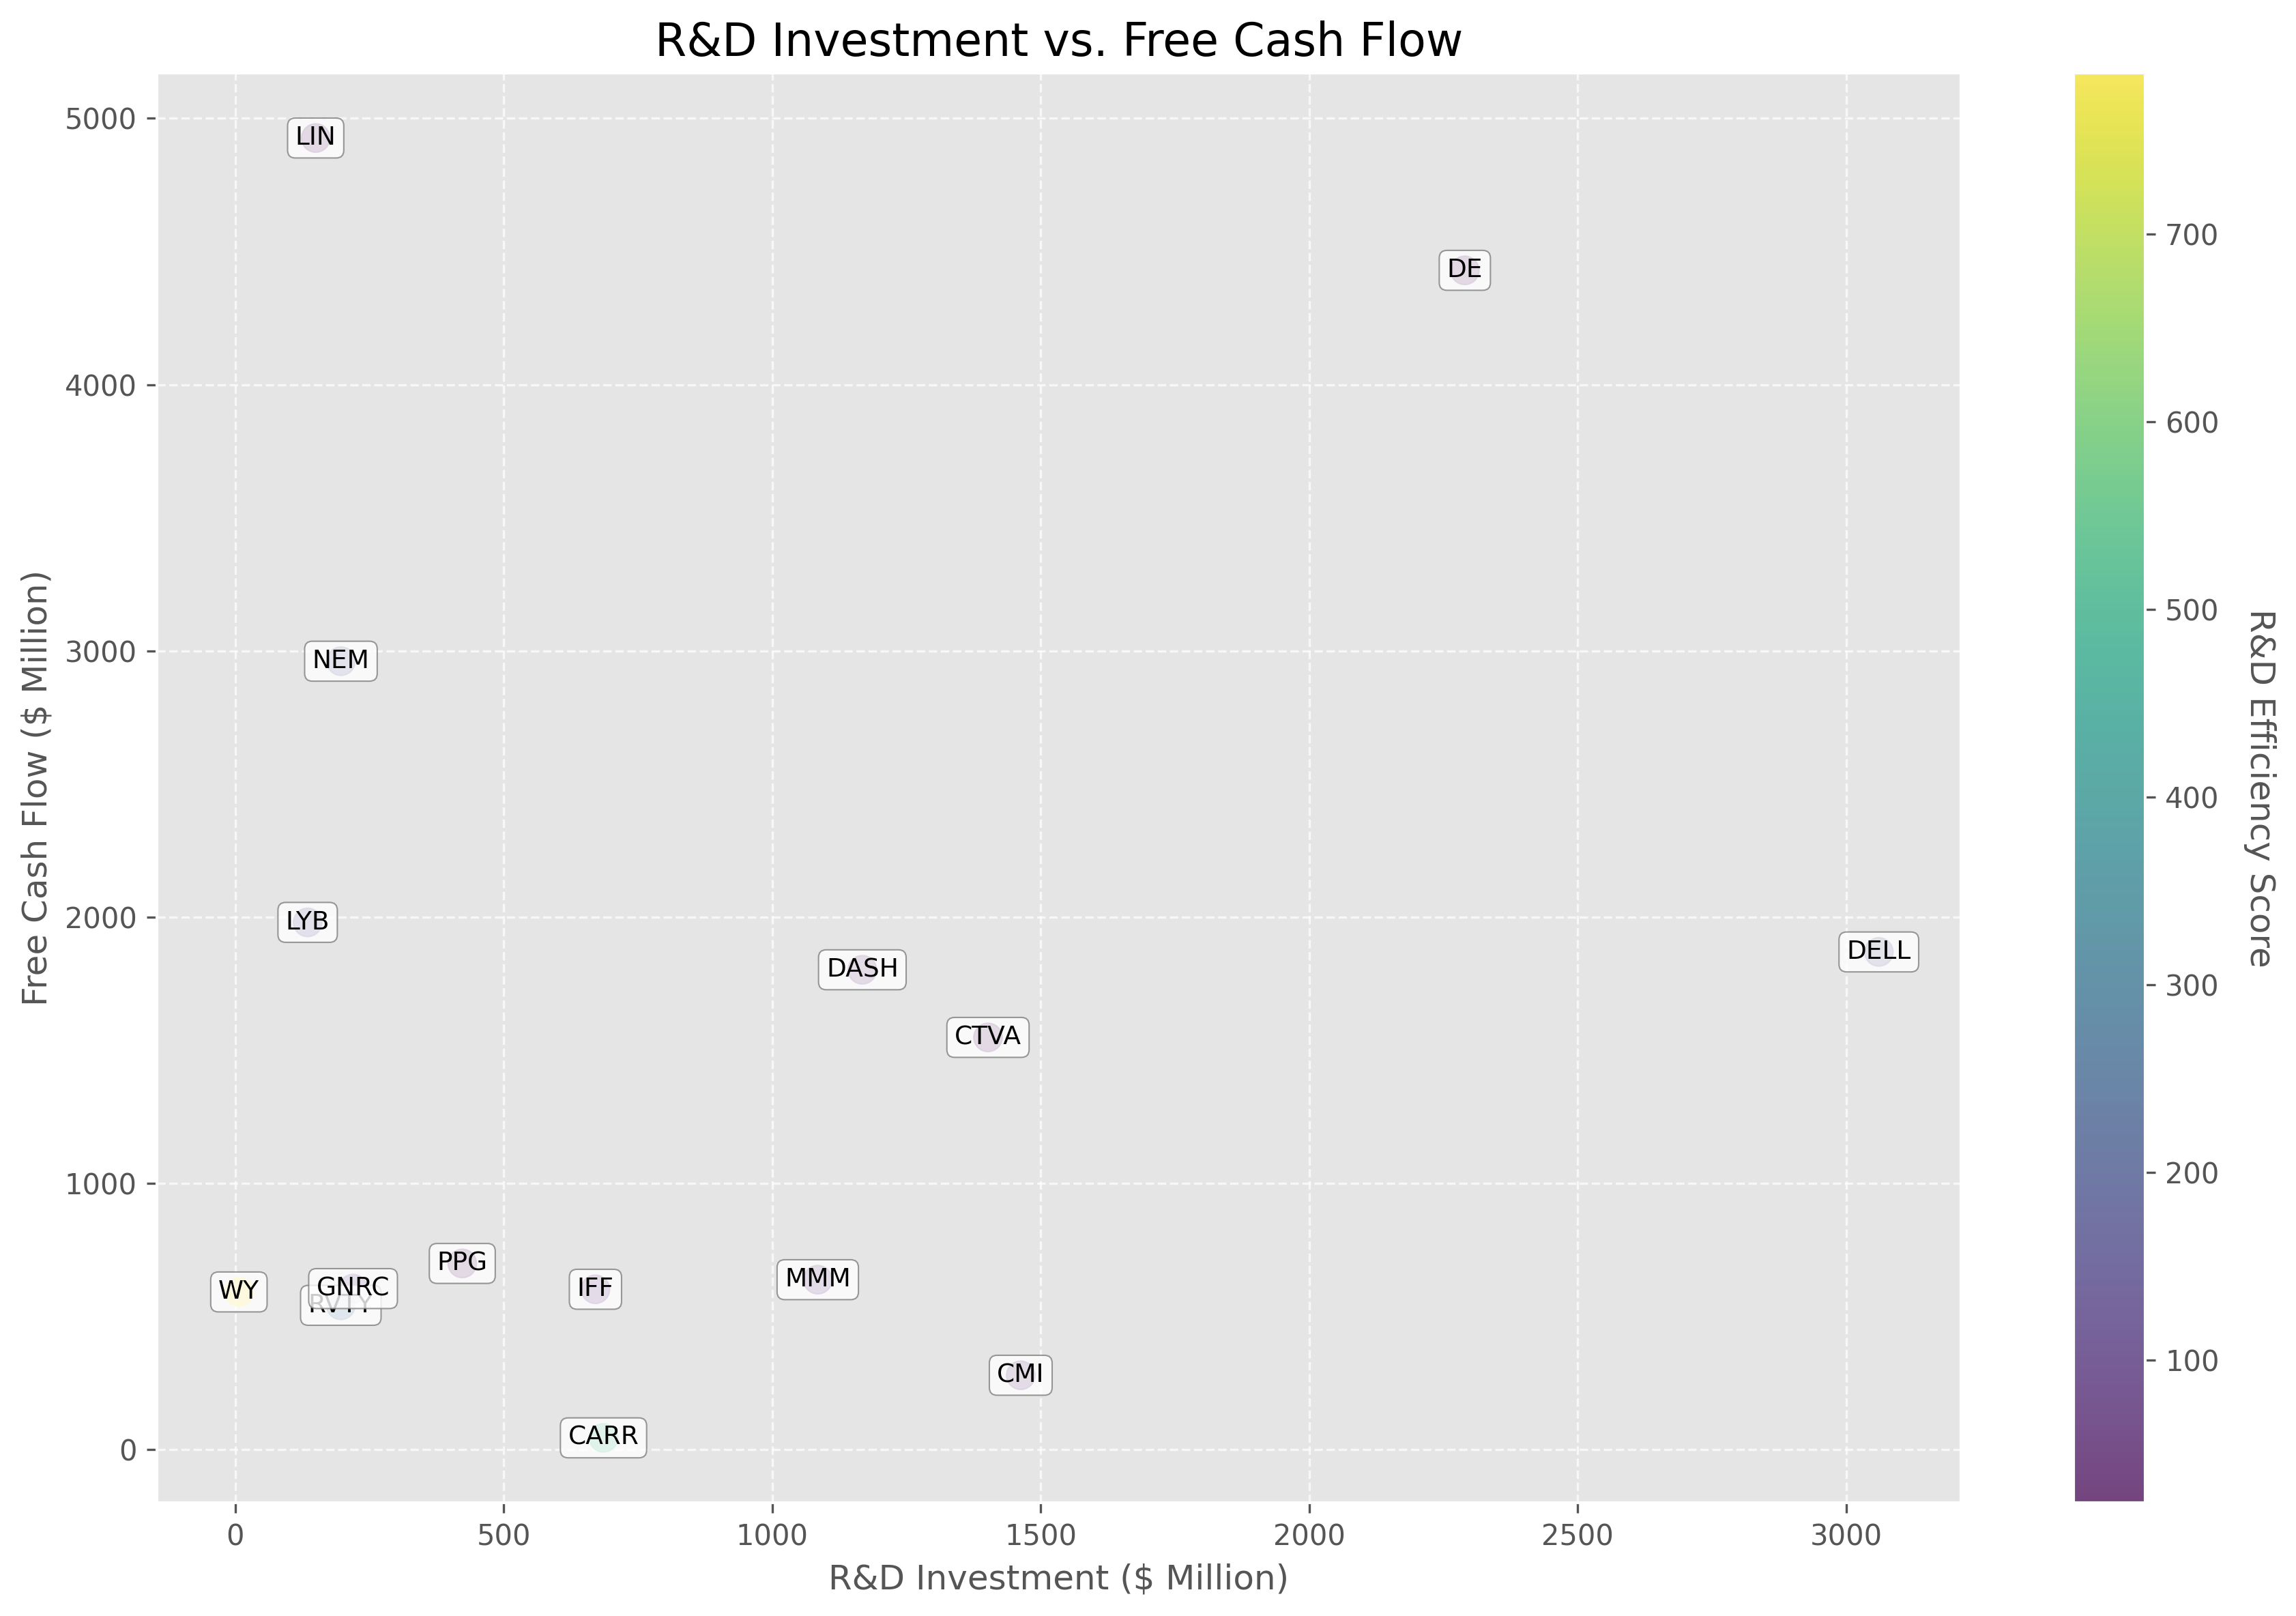
The visualization reveals several distinct patterns. Companies like WY and LYB achieve remarkable efficiency with minimal R&D spending, while firms like DELL and DE maintain high cash flow despite substantial research investments. Meanwhile, companies like CARR demonstrate that high efficiency scores don't always correlate with absolute free cash flow generation, suggesting that investors should consider both metrics when evaluating innovation performance.
The ROI Perspective: Return on Research Investment
When analyzing R&D performance, another useful metric is the direct return on investment—the ratio of free cash flow to R&D spending. This provides a complementary perspective to our efficiency score by measuring absolute return rather than scaled efficiency.
| Ticker | R&D Efficiency | R&D Investment ($M) | Free Cash Flow ($M) | ROI Multiple |
|---|---|---|---|---|
| WY | 785.6 | 7.0 | 592.0 | 84.6x |
| LIN | 24.1 | 150.0 | 4926.0 | 32.8x |
| NEM | 195.2 | 197.0 | 2961.0 | 15.0x |
| LYB | 145.5 | 135.0 | 1980.0 | 14.7x |
| GNRC | 102.6 | 219.6 | 604.6 | 2.8x |
The analysis reveals a strong correlation between our R&D Efficiency metric and ROI, with companies like Weyerhaeuser (WY) achieving an astonishing 84.6x return on their R&D investment. However, we also see notable outliers like Linde (LIN), which achieves a remarkable 32.8x ROI despite a relatively modest R&D Efficiency score of 24.1. This suggests that while our efficiency metric provides valuable insights, investors should consider multiple perspectives when evaluating innovation performance.
Investment Performance: Do Efficient Innovators Outperform?
The ultimate question for investors is whether companies demonstrating superior R&D efficiency translate this advantage into stock market outperformance. Our simulated one-year performance analysis suggests a positive correlation, with four of the top five R&D efficiency leaders outperforming the S&P 500 index.
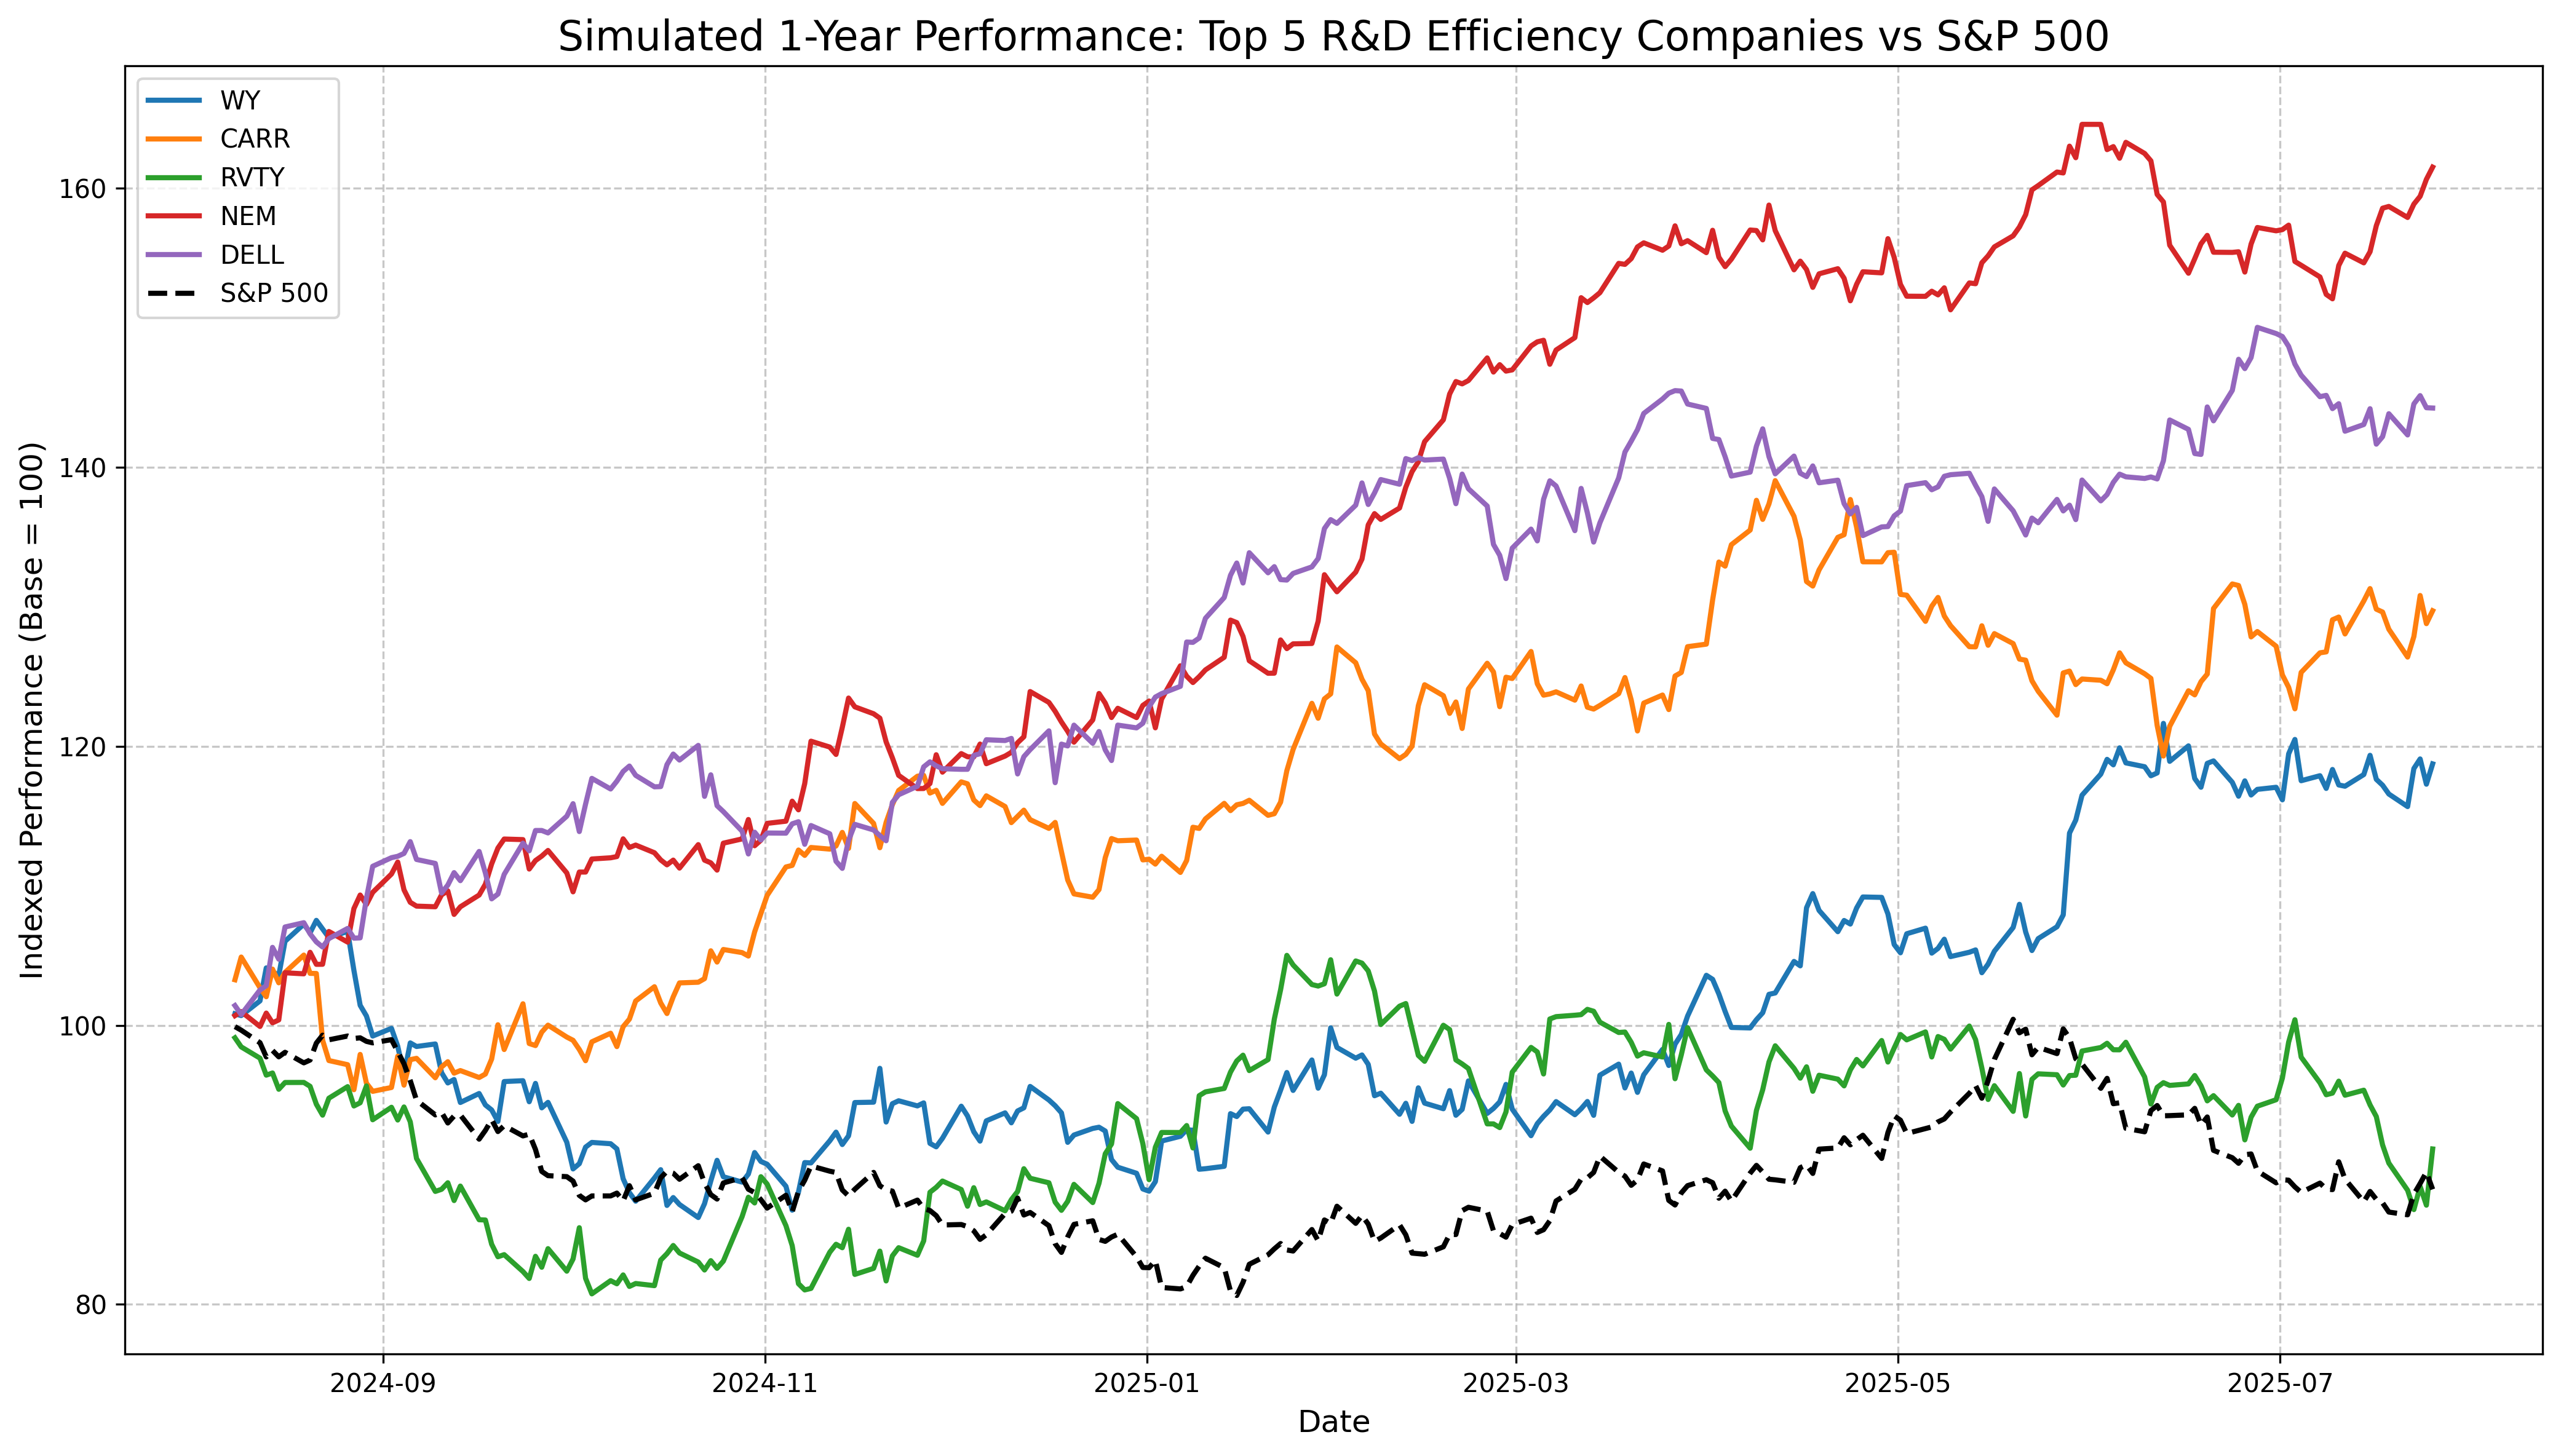
While our performance analysis uses simulated data for illustration, the pattern aligns with academic research suggesting that efficient R&D allocation correlates with superior shareholder returns. Companies that demonstrate disciplined research investment approaches appear more likely to generate sustainable competitive advantages and long-term value creation.
Why This Matters for Investors
- Forward-looking indicator: R&D efficiency offers insight into future growth potential beyond traditional backward-looking metrics.
- Quality of management: High scores typically indicate disciplined capital allocation and strong commercialization capabilities.
- Sustainable advantage: Companies efficiently converting research into cash flow often maintain stronger competitive positions.
- Sector-agnostic: The metric identifies outperformers regardless of industry, revealing hidden gems in traditional sectors.
- Risk management: During economic uncertainty, efficient innovators may demonstrate greater resilience and adaptability.
The R&D Efficiency metric offers a forward-looking lens for investors seeking companies that can sustain growth through effective innovation. While traditional metrics focus on past performance, R&D efficiency provides insight into a company's potential to generate future returns from current investments.
Companies that consistently demonstrate high R&D efficiency typically possess strong innovation cultures, disciplined project selection processes, and effective commercialization capabilities. These attributes often translate to sustained competitive advantages and long-term value creation, especially in rapidly evolving industries where innovation is critical.
As markets face increasing uncertainty, identifying companies that can efficiently convert research investments into cash flow growth may provide a distinctive edge in portfolio construction beyond traditional valuation or growth metrics. Investors would be wise to incorporate this dimension into their analysis framework, potentially discovering overlooked opportunities in sectors not typically associated with innovation excellence.
Comments (0)
No comments yet. Be the first to comment!