What is Gross Margin and Why Should You Care?
Imagine you're running a lemonade stand. You buy lemons, sugar, and cups for $2, then sell your lemonade for $5. Your gross margin is the percentage of that $5 sale that remains after covering just the direct costs of making the lemonade - that's ($5-$2)/$5 = 60%. In the business world, gross margin reveals how much money a company keeps from each sale after paying for the direct costs of creating their product or service. It's calculated as (Total Revenue - Cost of Revenue) / Total Revenue × 100. This metric is crucial because it shows how efficiently a company can turn raw materials, labor, and manufacturing into profitable products. Higher gross margins typically indicate stronger pricing power, better operational efficiency, or more valuable products that customers are willing to pay premium prices for.
The Clear Winner: Autodesk's Digital Dominance
At the summit of our analysis sits Autodesk (ADSK), the design software giant, with an impressive 90.57% gross margin. To put this in perspective, for every dollar of revenue Autodesk generates, they keep about 91 cents after covering the direct costs of delivering their software. With total revenue of $6.13 billion and cost of revenue of just $578 million, Autodesk exemplifies the economics of software businesses. Once they've developed their AutoCAD, Maya, or other design tools, they can sell unlimited copies with minimal additional costs - no physical manufacturing, no raw materials, just digital distribution. This is the beauty of software: the marginal cost of serving one more customer approaches zero, while the value delivered can be enormous.
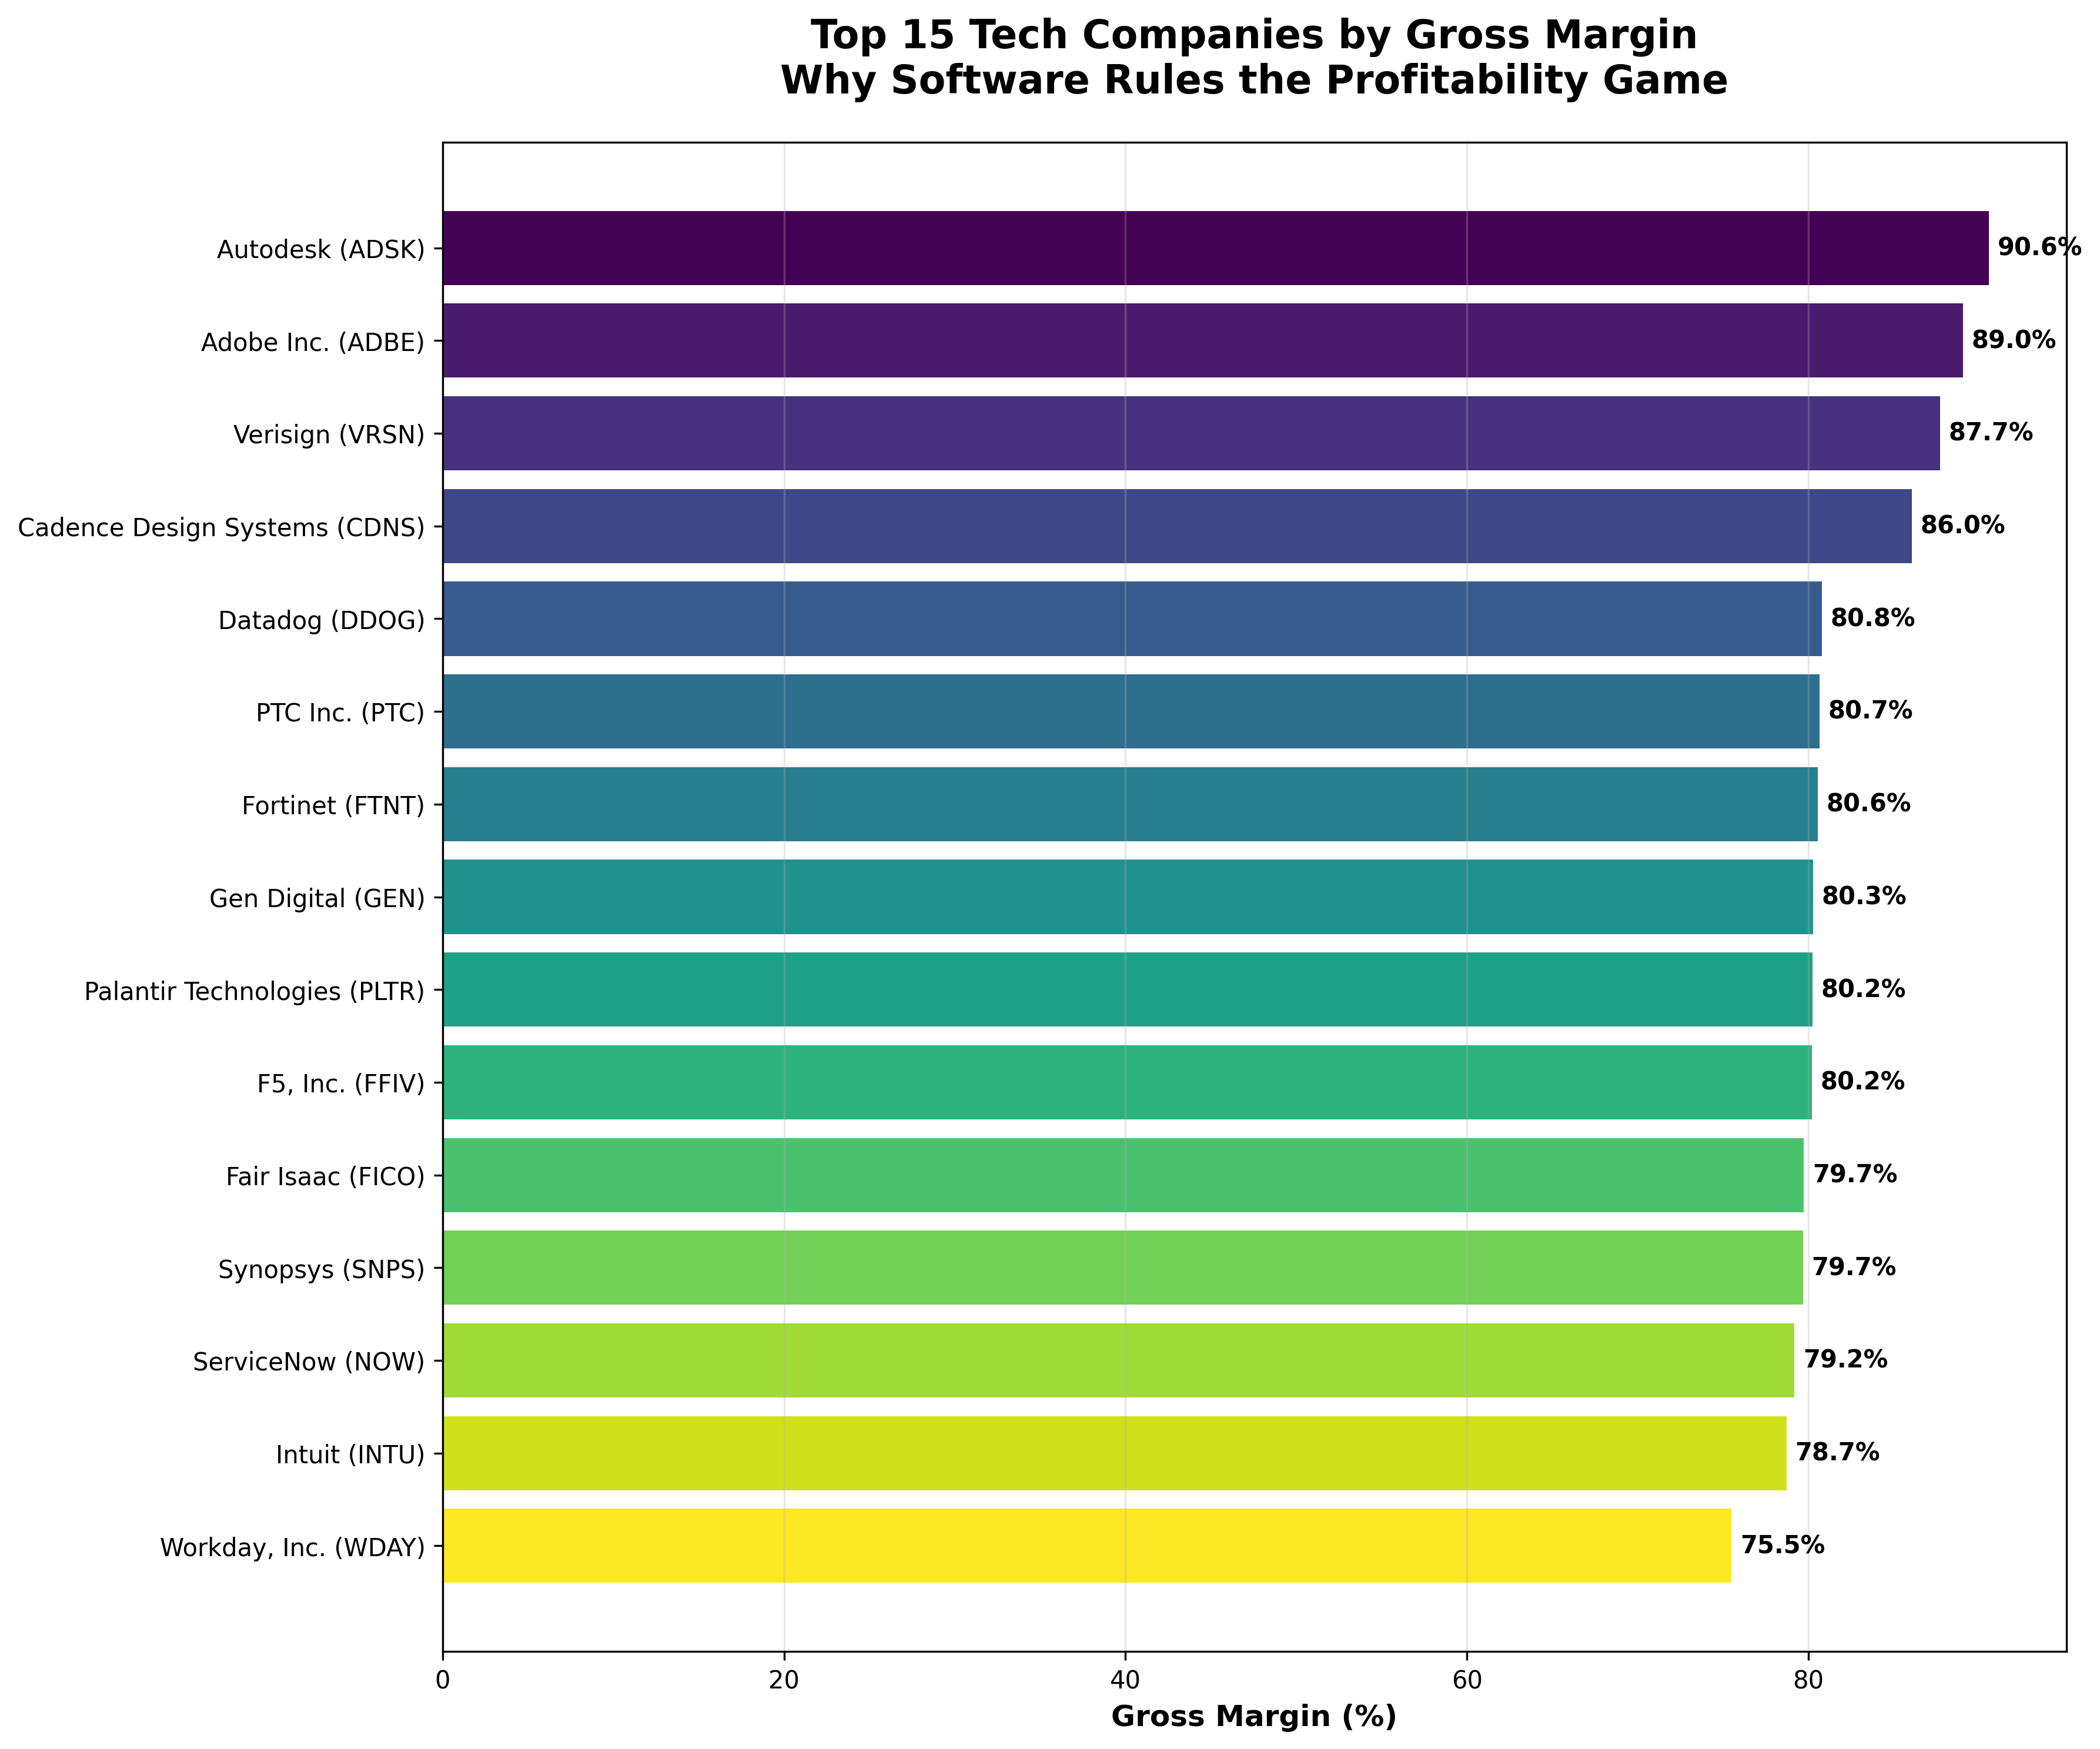
The Software vs. Hardware Tale
Our analysis reveals a fascinating dichotomy in the tech sector. Software companies like Adobe (89.04%), Verisign (87.71%), and Cadence Design Systems (86.05%) cluster at the top with margins approaching 90%. Meanwhile, even tech giant Apple (46.21%) ranks only 47th, highlighting how physical products - even premium ones - face inherent cost pressures. The contrast becomes even starker when we look at traditional hardware manufacturers: Jabil sits at the bottom with just 9.26% gross margin, followed by Supermicro (13.75%) and CDW Corporation (21.92%). These companies must constantly purchase components, manage inventory, handle shipping, and deal with the physical complexities of manufacturing - all of which eat into their margins.
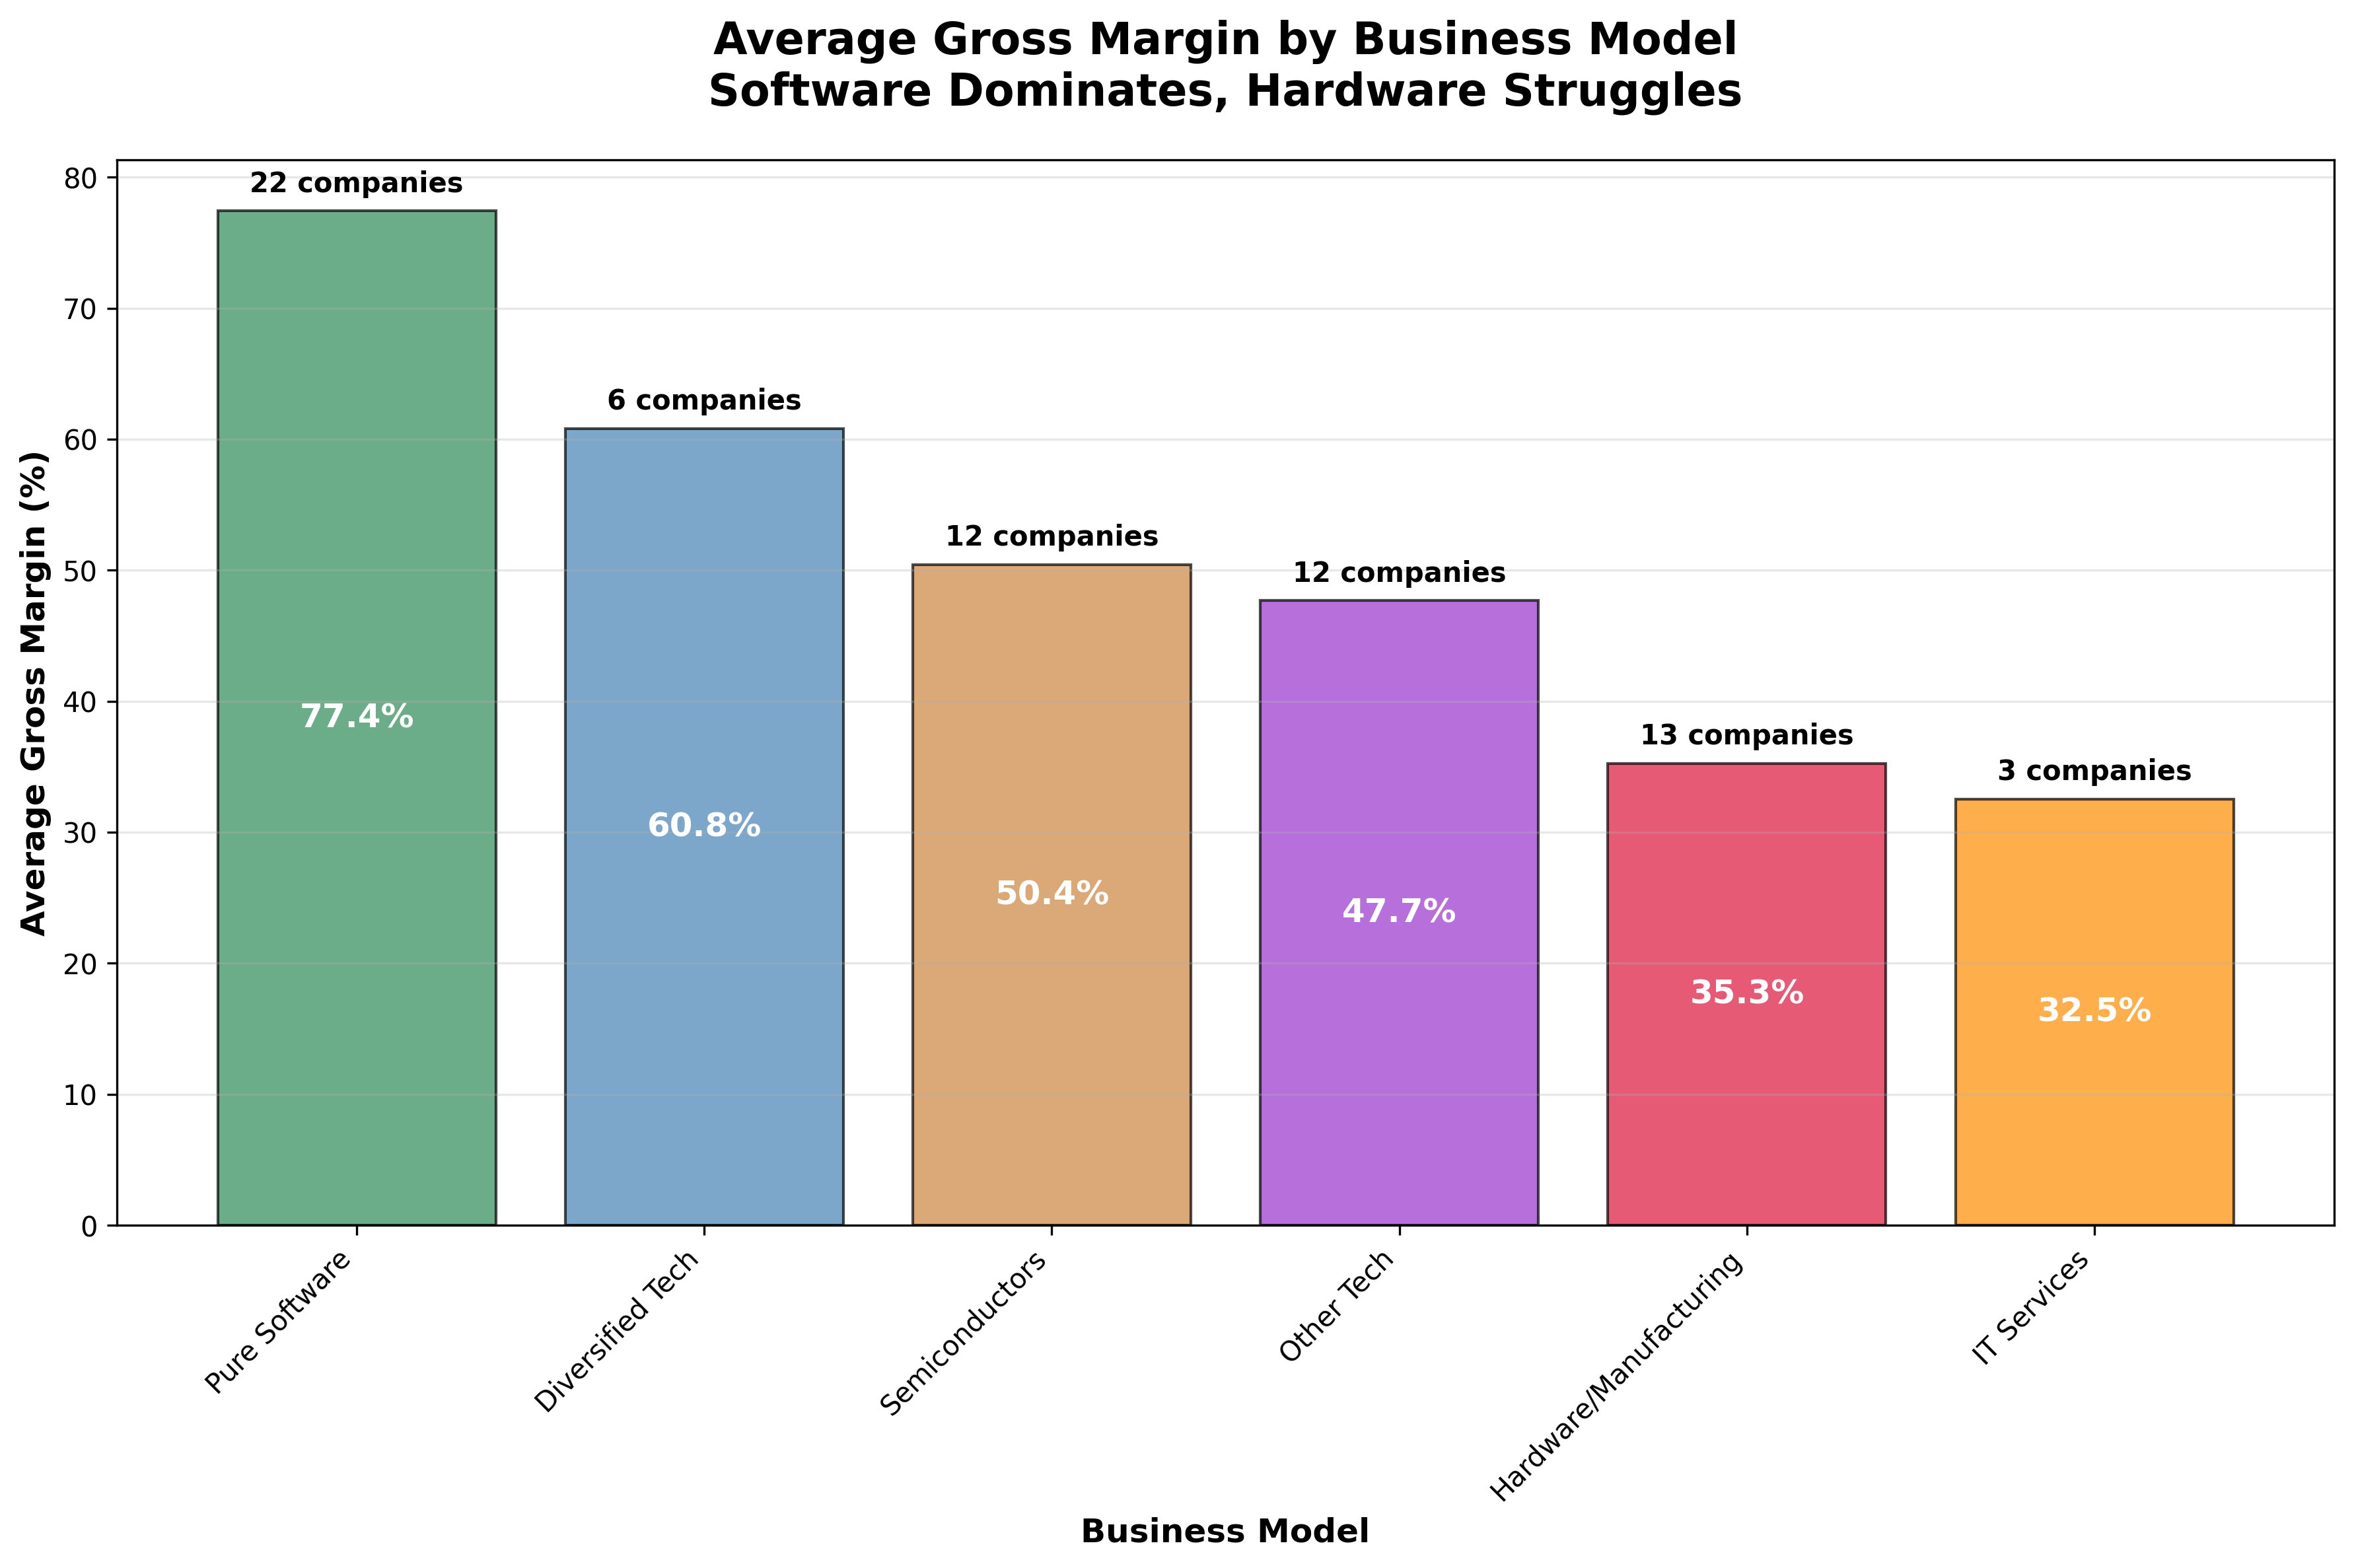
Business Model Makes All the Difference
When we categorize companies by their core business models, the pattern becomes crystal clear. Pure software companies average an impressive 77.4% gross margin across 22 companies, while hardware/manufacturing businesses average just 35.3% across 13 companies. Semiconductor companies, despite their high-tech nature, average 50.4% - better than hardware but still far behind software. Even IT services companies like Accenture (32.61%) and Cognizant (34.34%) struggle with lower margins due to their labor-intensive nature. This isn't just about technology sophistication; it's about fundamental business economics. Software scales infinitely without proportional cost increases, while physical products and human services face inherent scalability constraints.
What This Means for Understanding Tech Businesses
These gross margin differences tell a compelling story about the nature of different tech businesses. High-margin software companies often enjoy stronger competitive moats - once customers are trained on AutoCAD or integrated with Salesforce, switching costs are high. They also benefit from network effects and recurring revenue models through subscriptions. Conversely, hardware companies face constant pressure from commodity pricing, supply chain volatility, and the need for continuous capital investment in manufacturing capabilities. This analysis helps explain why software companies often trade at higher valuation multiples in the stock market - their superior unit economics translate to more predictable and scalable profit generation.
- Software companies dominate the top 15 positions, with 13 out of 15 spots
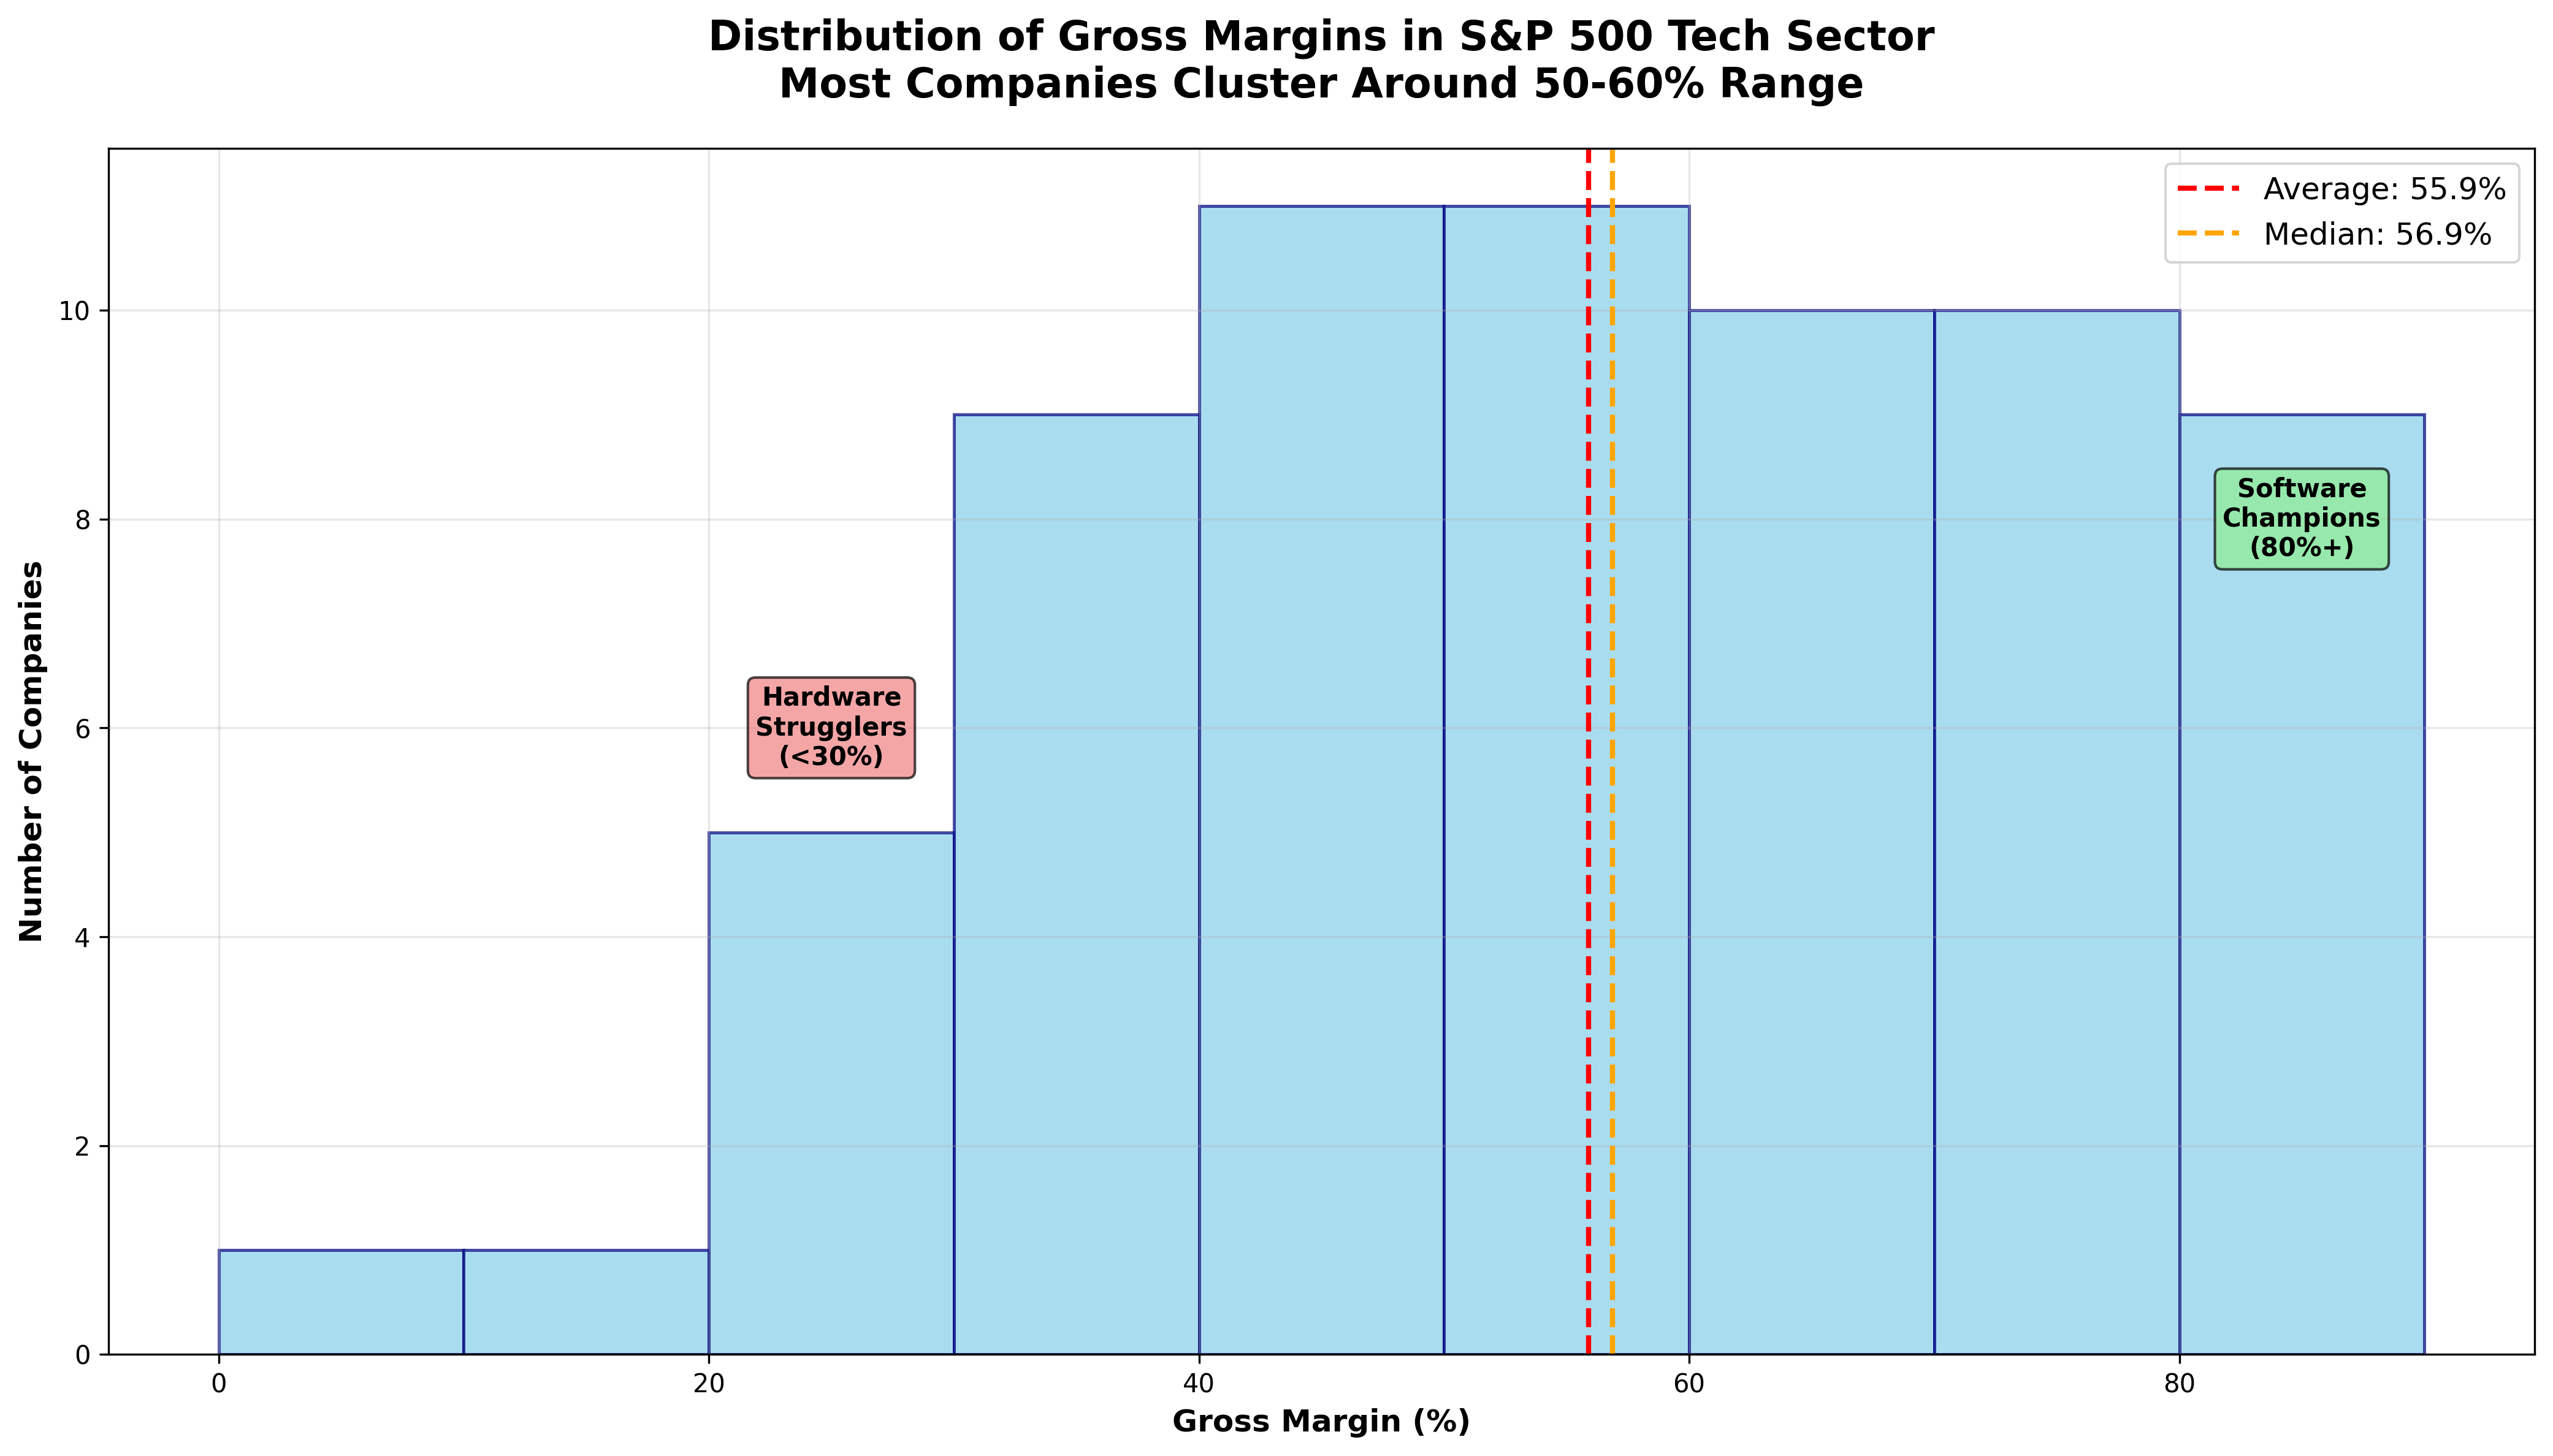
- Average gross margin across all 68 tech companies is 55.9%, but software companies average 77.4%
- The gap between Autodesk (#1 at 90.57%) and Jabel (#68 at 9.26%) spans over 81 percentage points
- Even technology hardware leaders like Apple (46.21%) rank in the bottom half due to physical product constraints
- Semiconductor companies occupy a middle ground, averaging 50.4% despite their high-tech manufacturing
- Pure software business models show the most consistent high margins, with 18 of 22 companies exceeding 70%
Comments (0)
No comments yet. Be the first to comment!