What is Return on Assets (ROA) and Why Should You Care?
Imagine you're comparing two lemonade stands. One uses $100 worth of equipment and ingredients to make $20 profit, while another uses $50 to make the same $20. Which business is more efficient? That's exactly what Return on Assets (ROA) measures for companies – how much profit they generate from every dollar of assets they own. ROA is calculated as Net Income divided by Total Assets, then multiplied by 100 to get a percentage. A higher ROA means the company is more efficient at turning its resources into profits, like a well-oiled machine that wastes nothing.
The ROA Champions: A Tale of Two Business Models
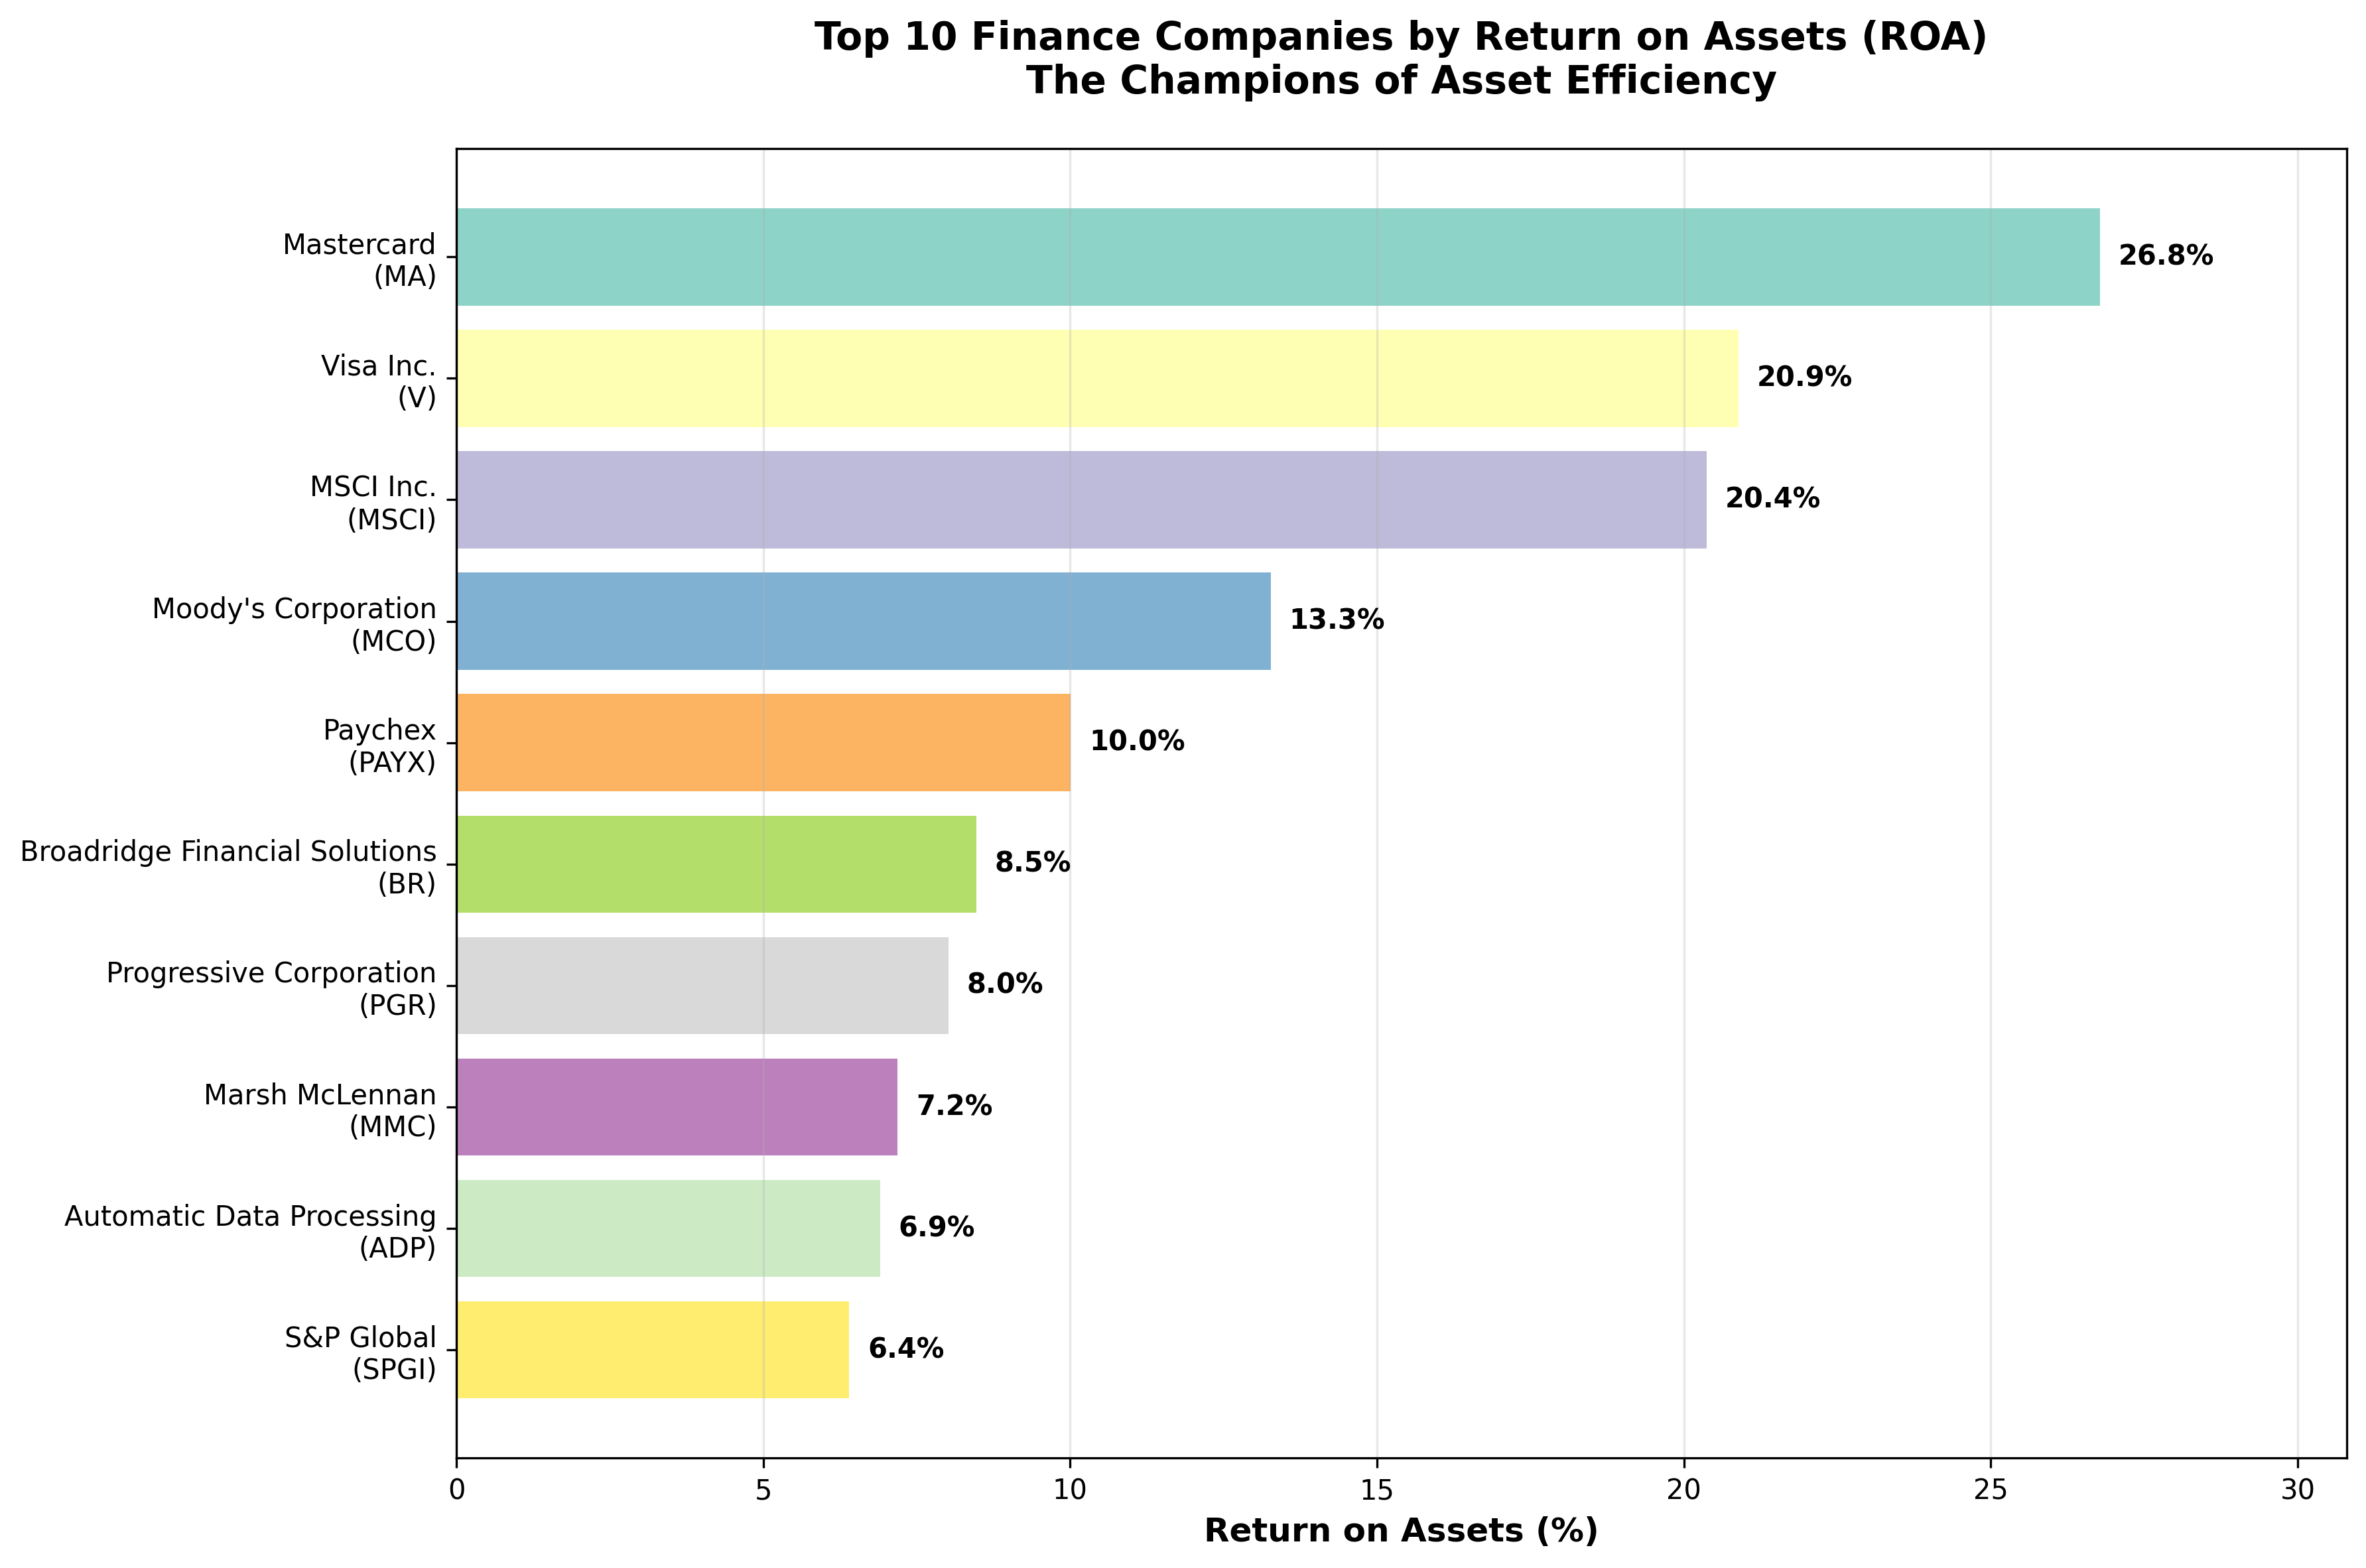
Our analysis of 51 major financial companies from the S&P 500 reveals a fascinating story about business models and efficiency. Leading the pack is Mastercard (MA) with an astounding 26.78% ROA, followed closely by Visa (V) at 20.89%. To put this in perspective, for every $100 of assets Mastercard owns, it generates nearly $27 in profit annually. Compare this to traditional banks like Bank of America (BAC) at 0.83% or Citigroup (C) at 0.54%, and the difference is staggering. These payment processors operate what's called 'asset-light' business models – they don't need massive physical branches, ATM networks, or loan portfolios. Instead, they process transactions and collect fees, requiring relatively few assets to generate substantial profits.
Breaking Down the Calculation: Mastercard's Success Story
Let's demystify how Mastercard (MA) achieved its top ranking with a real-world calculation. According to the company's 2024 annual financial statements, Mastercard reported Net Income of $12.874 billion and Total Assets of $48.081 billion. The ROA calculation is straightforward: ($12.874 billion ÷ $48.081 billion) × 100 = 26.78%. This means that for every dollar in assets Mastercard possesses, it generates approximately 27 cents in annual profit. To appreciate how exceptional this is, consider that the average ROA across all 51 analyzed companies is just 4.27%. Mastercard's performance is more than six times better than the sector average.
Business Model Categories: Why Some Models Win Big
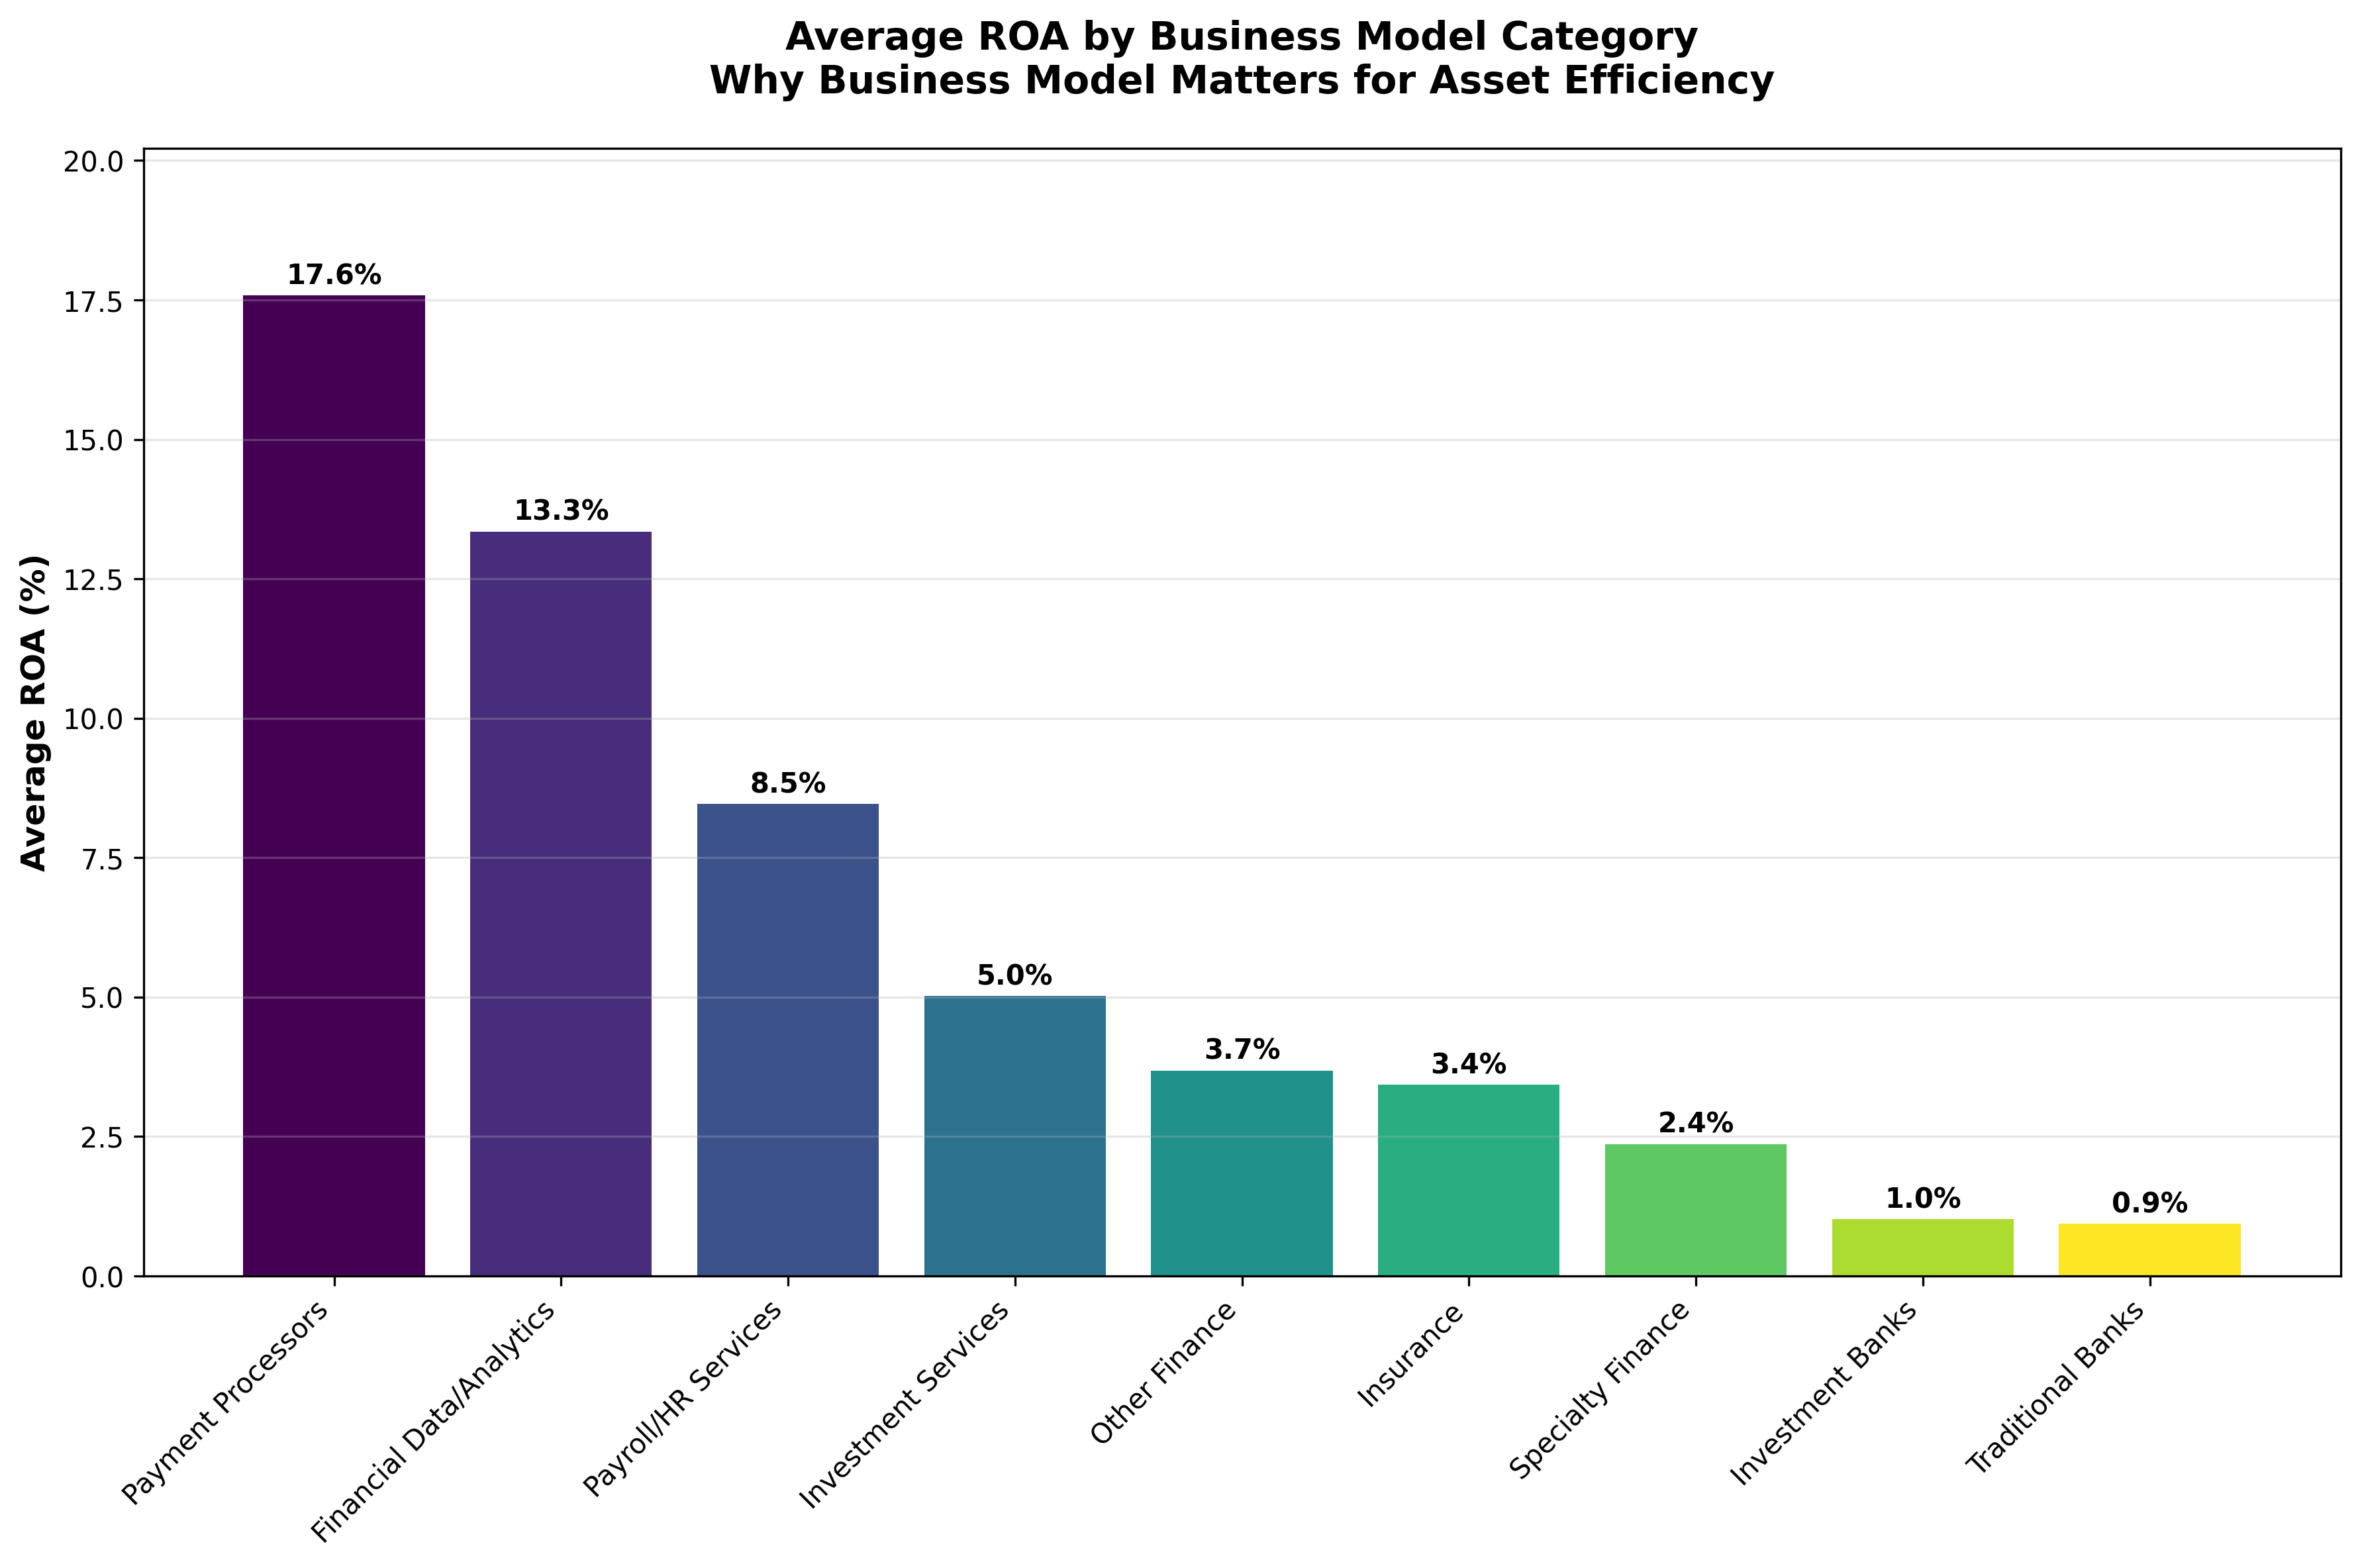
The data reveals clear patterns when companies are grouped by business model. Payment processors average an impressive 17.6% ROA, while Financial Data/Analytics providers like MSCI (MSCI) and Moody's (MCO) achieve 13.3% average ROA. These companies sell information and data services – products that, once created, can be sold repeatedly without significant additional assets. In contrast, traditional banks average just 0.9% ROA because they must maintain substantial assets like loan portfolios, deposits, and physical infrastructure. Insurance companies fall in the middle at 3.4% average ROA, as they need reserves to pay claims but don't require the same asset intensity as banks.
The Distribution Reality: Most Companies Struggle with Asset Efficiency
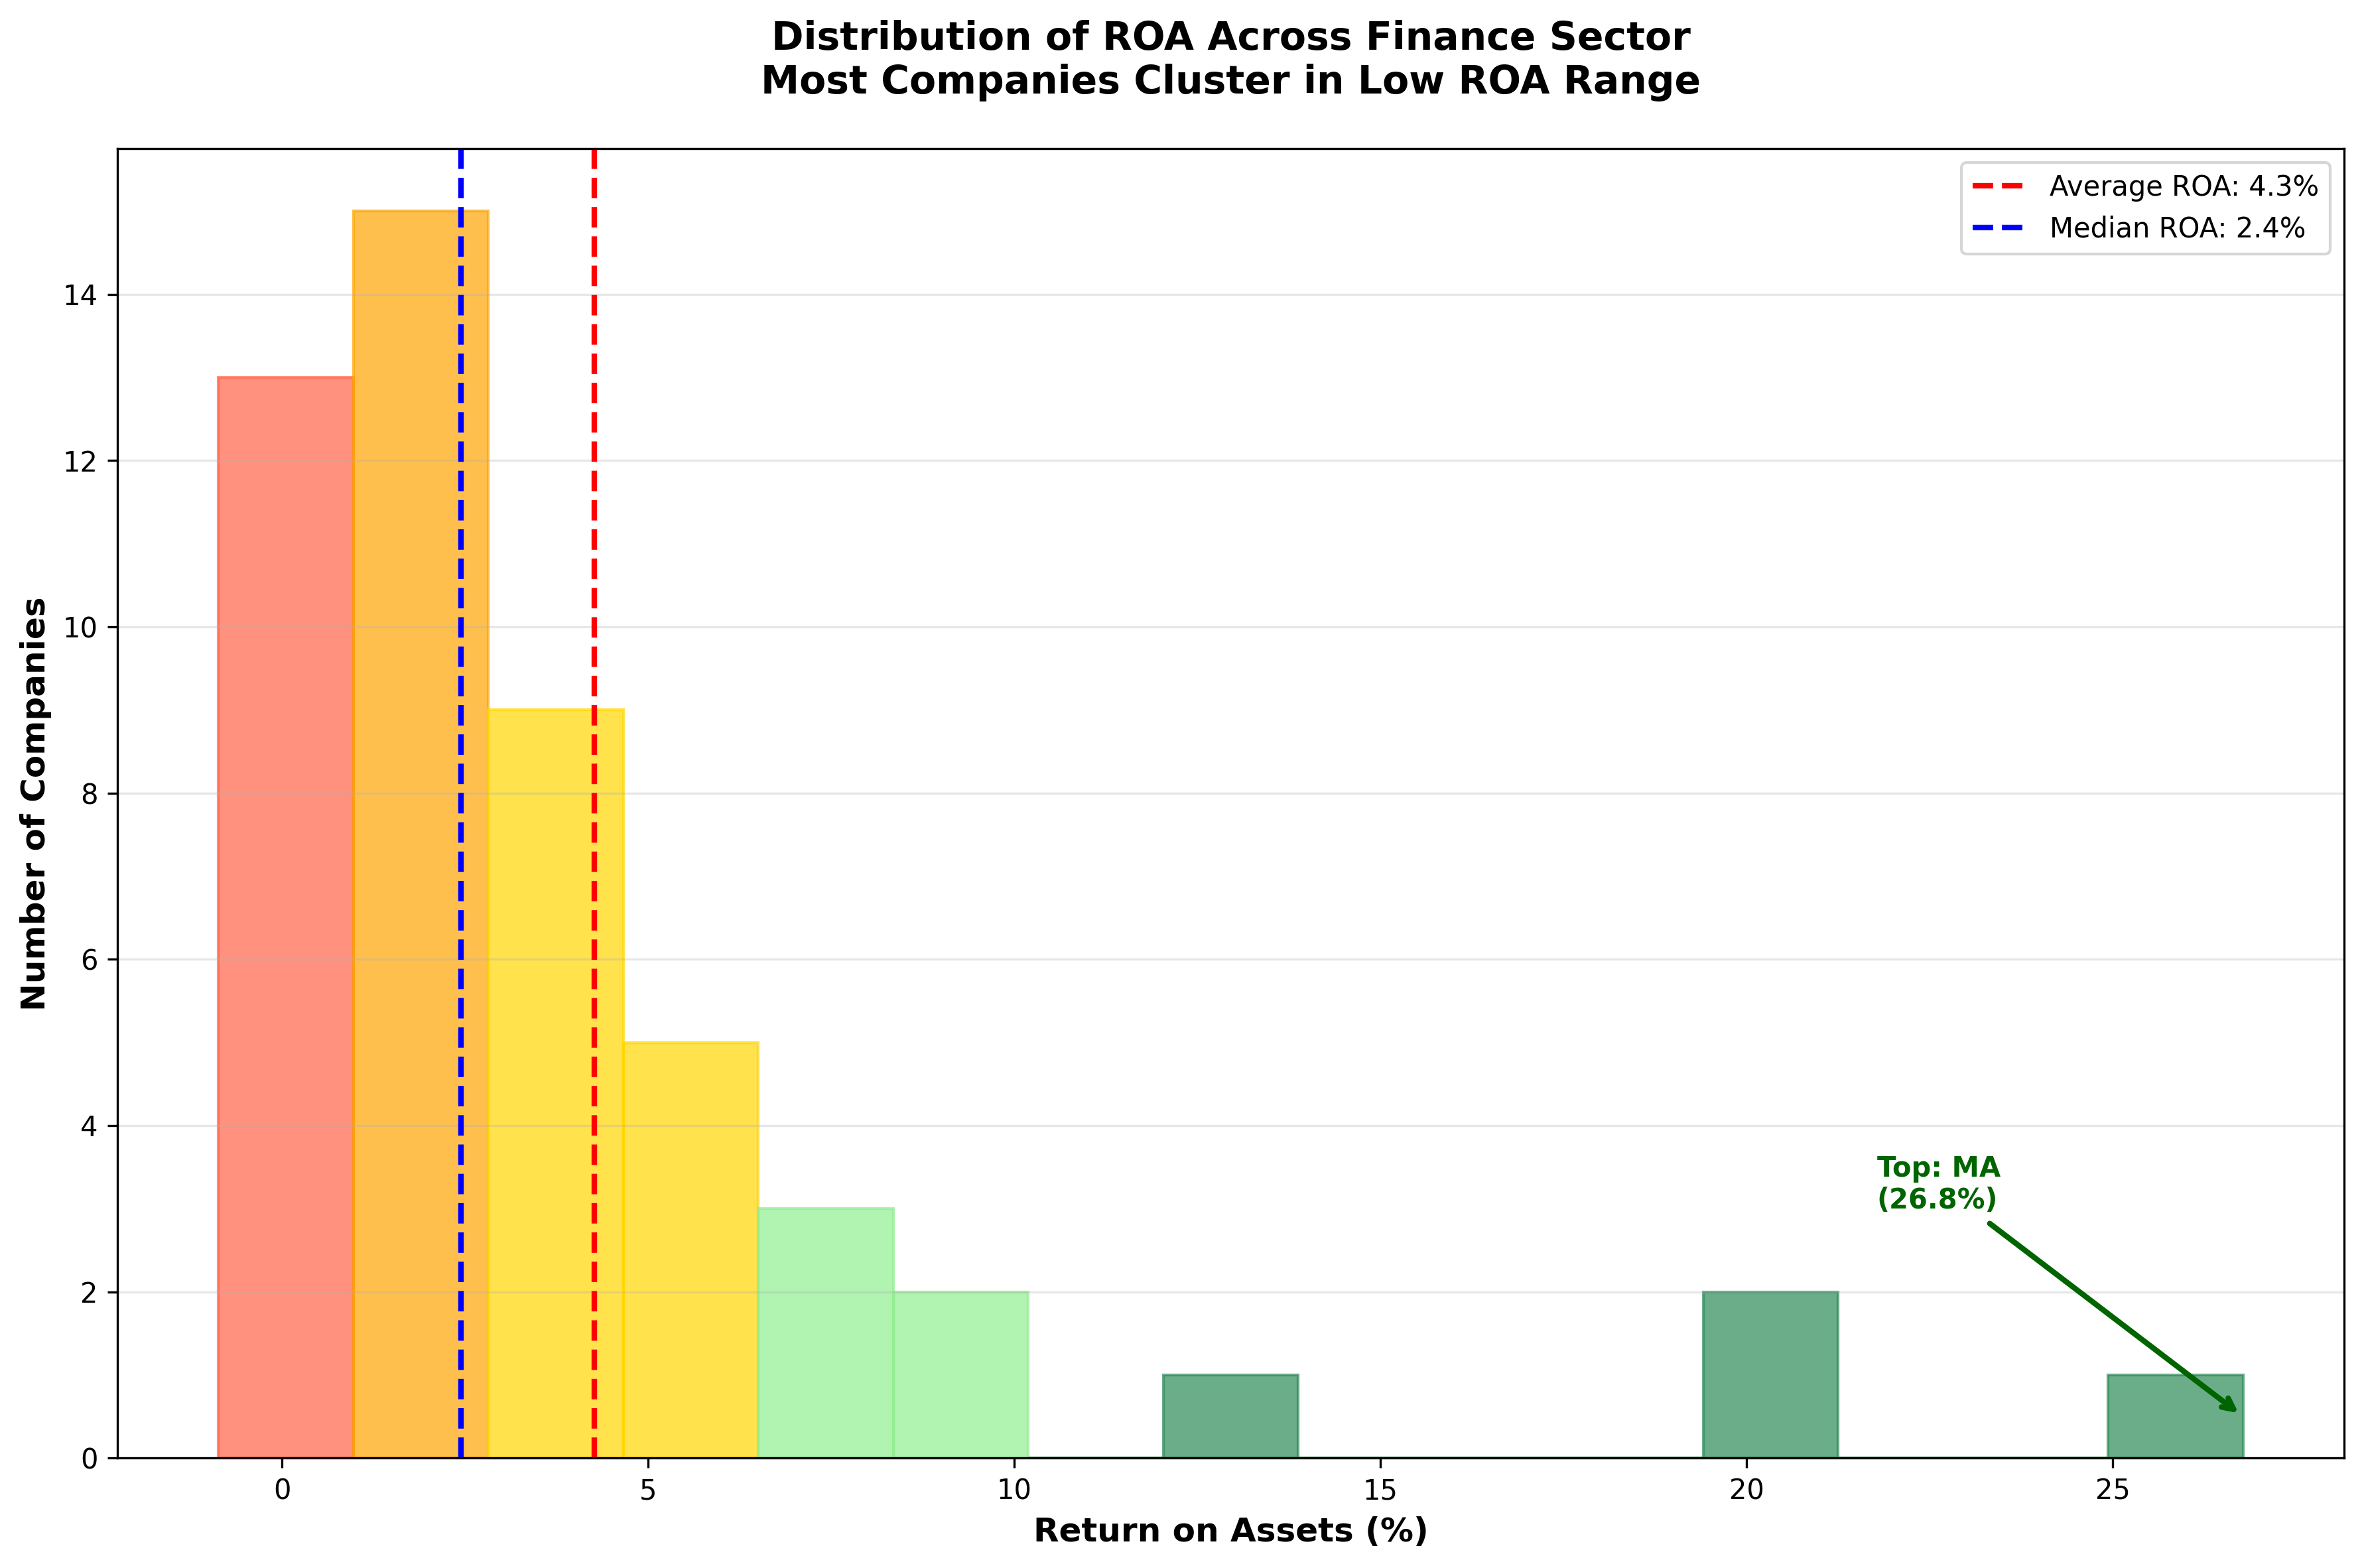
The broader picture shows that high ROA is actually quite rare in the finance sector. With a median ROA of just 2.44%, half of all analyzed companies generate less than 2.5 cents of profit per dollar of assets. Only five companies achieve ROA above 10%, while 18 companies fall below 2% ROA. This distribution highlights why the top performers are so remarkable – they've found business models that generate exceptional returns without proportional increases in asset requirements. The standard deviation of 5.51% shows significant variation, indicating that business model choice and execution efficiency create vastly different outcomes even within the same sector.
Key Performance Categories: Understanding the Spectrum
- **Exceptional Performers (≥10% ROA)**: Just 5 companies including Mastercard (MA), Visa (V), MSCI (MSCI), Moody's (MCO), and Paychex (PAYX) – all with asset-light business models
- **Strong Performers (5-10% ROA)**: 8 companies primarily in insurance and investment services, showing solid efficiency without extreme asset leverage
- **Average Performers (2-5% ROA)**: 16 companies representing typical finance sector performance, including some insurance companies and specialty finance firms
- **Below Average (0-2% ROA)**: 20 companies mostly traditional banks struggling with asset-heavy business models in low interest rate environments
- **Negative ROA (<0%)**: 2 companies including KeyCorp (KEY) and AIG (AIG), indicating fundamental business challenges requiring attention
What This Means for Understanding Financial Companies
This analysis reveals that in today's financial landscape, the companies generating the highest returns on their assets are those that have moved away from traditional asset-heavy banking models. Payment processors, data providers, and service companies dominate the efficiency rankings because they've built scalable businesses that don't require proportional asset growth. For anyone trying to understand modern finance, this shift toward asset-light models represents a fundamental change in how successful financial companies operate. The days when bigger balance sheets automatically meant more profitable companies are clearly over – today's champions prove that smart business models beat big asset bases every time.
Understanding ROA helps explain why some financial companies trade at premium valuations while others struggle – it's not just about revenue size, but about how efficiently companies convert their resources into profits. This efficiency metric provides crucial insight into management quality, business model sustainability, and competitive positioning in an increasingly digital financial services world.
Comments (0)
No comments yet. Be the first to comment!