What Is Inventory Turnover and Why Should You Care?
Imagine your local grocery store as a busy restaurant kitchen. Just like a chef needs fresh ingredients that move quickly from delivery to plate, retailers need products that fly off the shelves before they spoil, expire, or become outdated. This is the essence of inventory turnover – a crucial business metric that measures how many times a company sells and replaces its entire stock in a year.
The inventory turnover ratio is calculated using a simple formula: Cost of Goods Sold (COGS) divided by Average Inventory. Think of COGS as all the money a company spends to make or buy the products it sells, while average inventory represents the typical value of products sitting on shelves and in warehouses. A higher ratio means faster turnover – and that's usually a very good thing.
The Speed Champions: Kroger Leads the Pack
When we analyzed 30 major consumer staples companies, the results revealed a fascinating hierarchy of speed. Kroger (KR) emerged as the undisputed champion with an astounding 16.00x inventory turnover, meaning they sell and replace their entire inventory 16 times per year – or roughly every 23 days. To put this in perspective, by the time Estée Lauder (EL) sells through its inventory once (212 days), Kroger has done it more than 9 times!
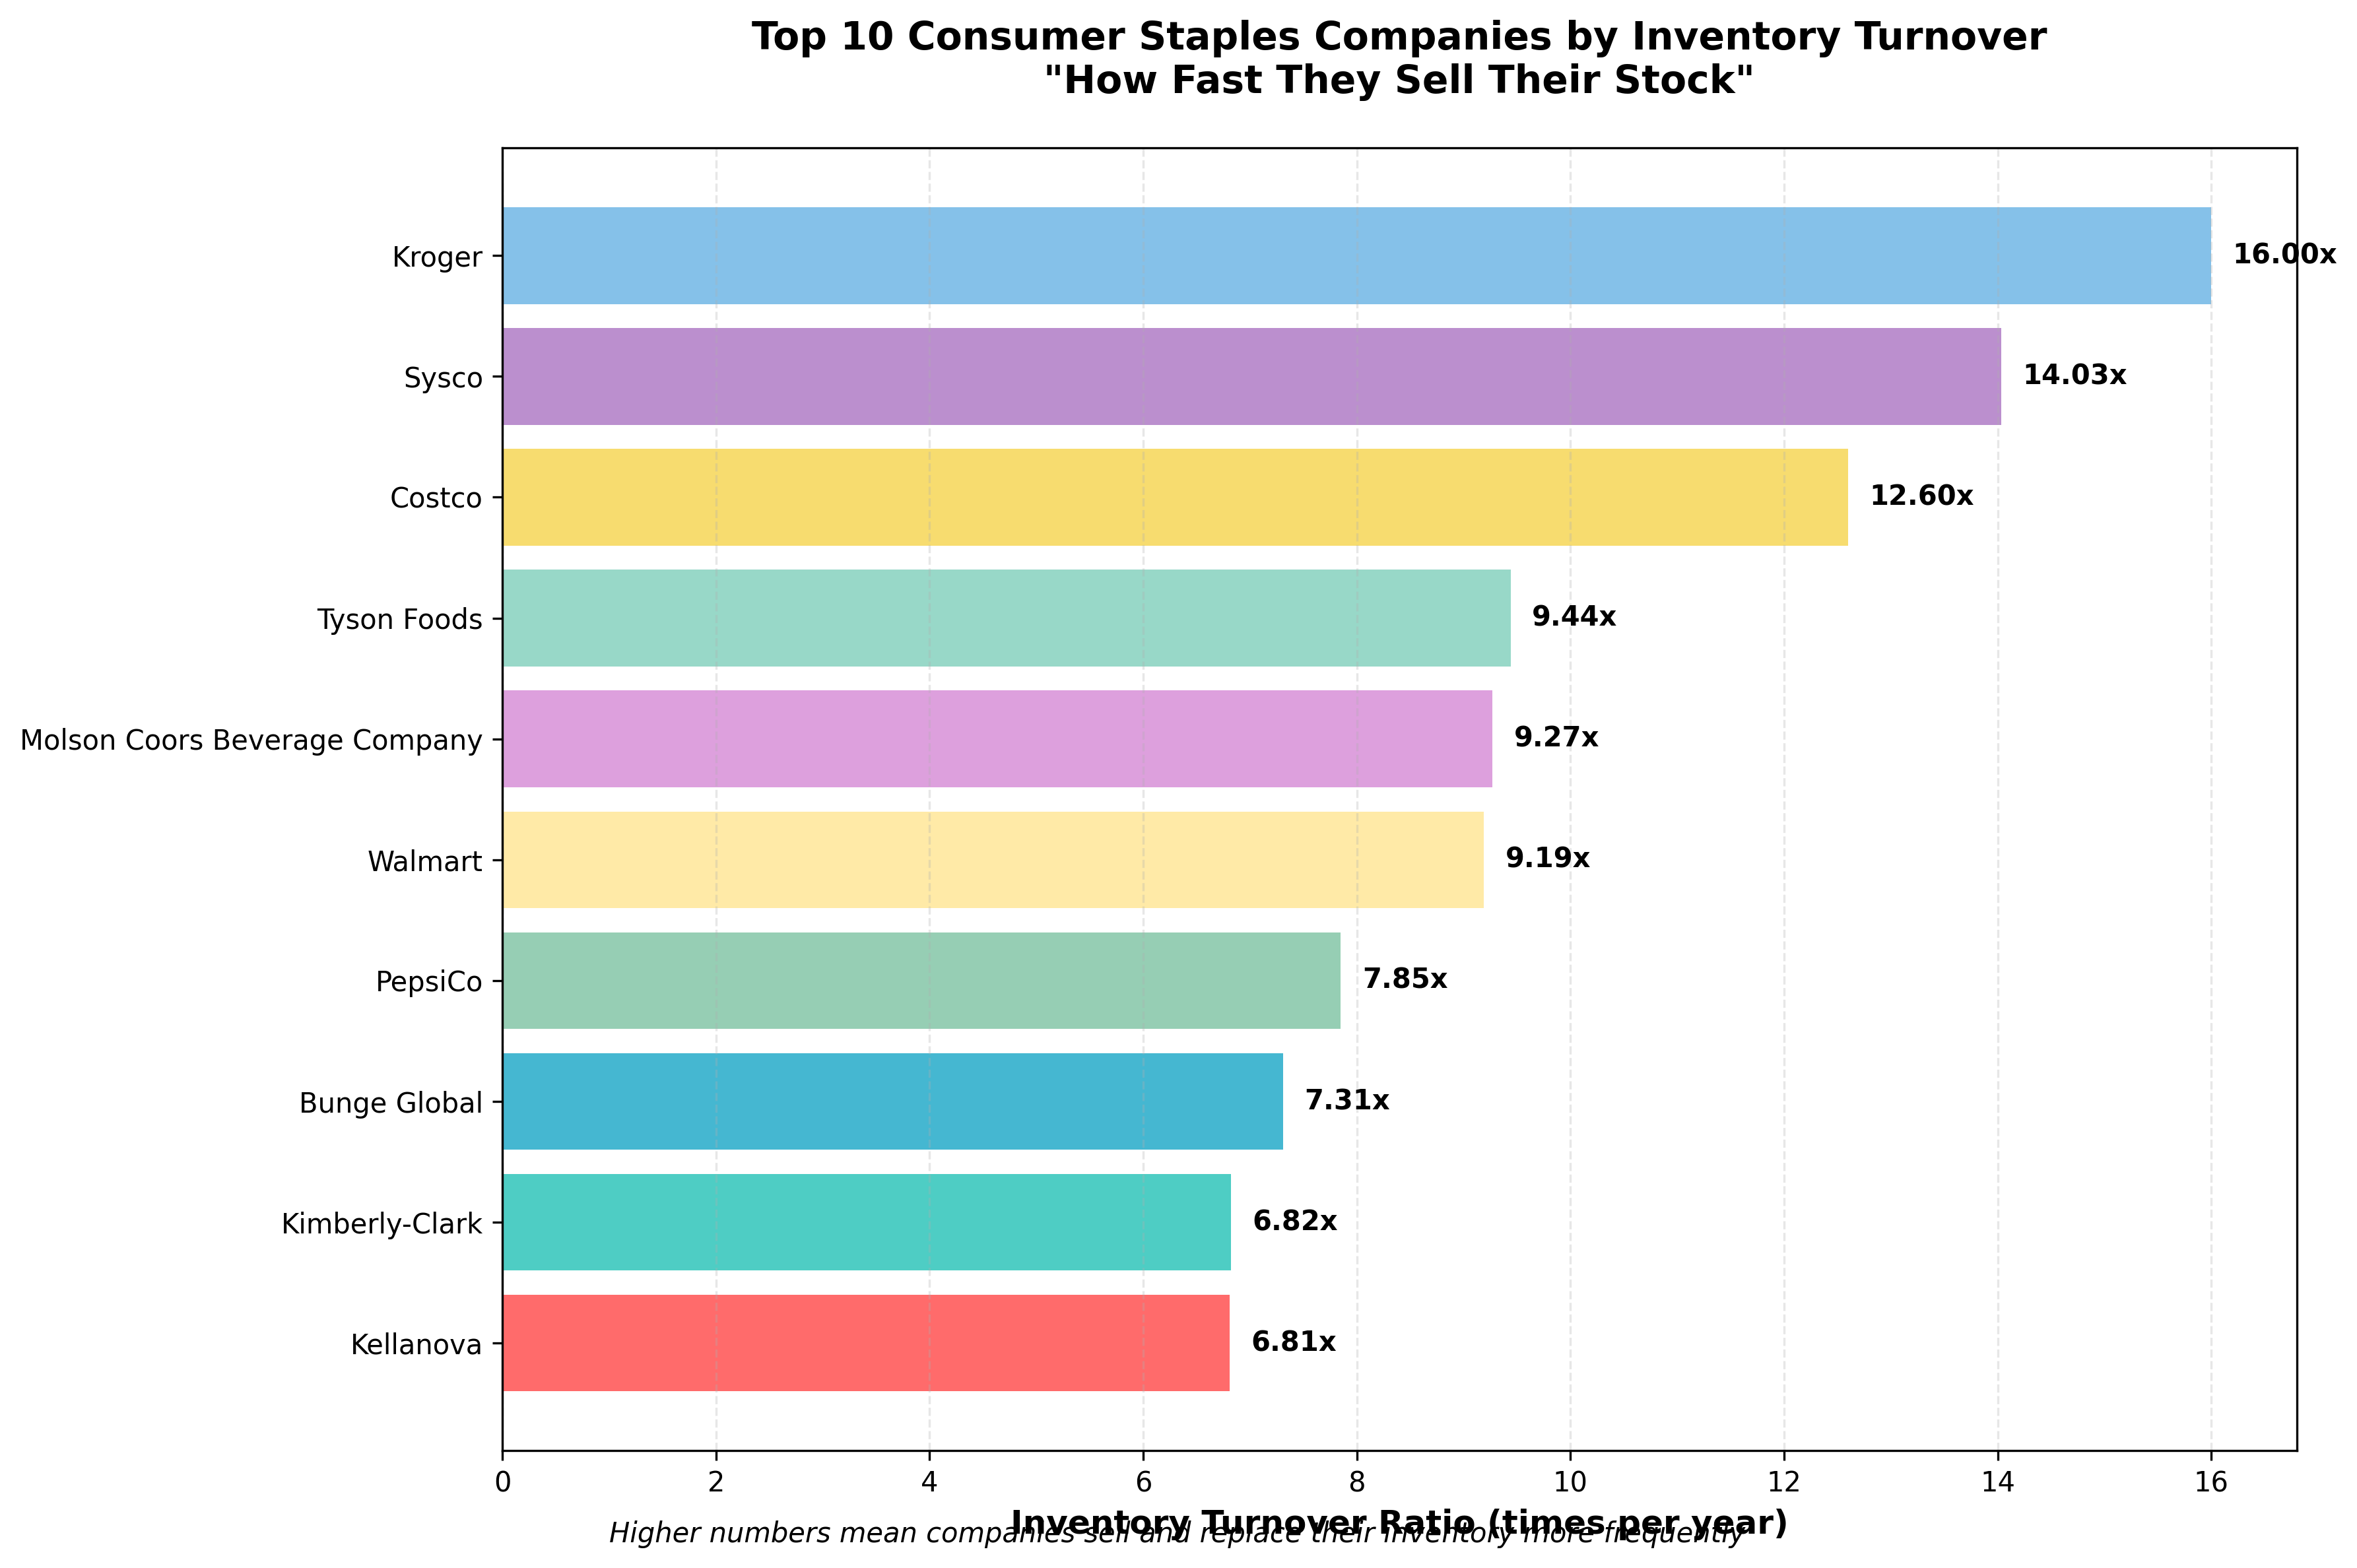
The top five speed champions tell an interesting story about different business models. Following Kroger, we have Sysco (SYY) at 14.03x – a food service distributor that supplies restaurants and institutions. Costco (COST) takes third place with 12.60x, showcasing the efficiency of the warehouse club model. Tyson Foods (TSN) and Molson Coors (TAP) round out the top five, representing the speed required in meat processing and beverage production respectively.
Business Models Drive Different Speeds
The data reveals distinct patterns when we group companies by their business models. It's not random that grocery retailers dominate the top spots – their business model demands it. When you're selling milk, bread, and produce, sitting inventory too long means spoilage, waste, and lost profits. The analysis shows grocery retailers average 11.0x turnover, far exceeding other categories.
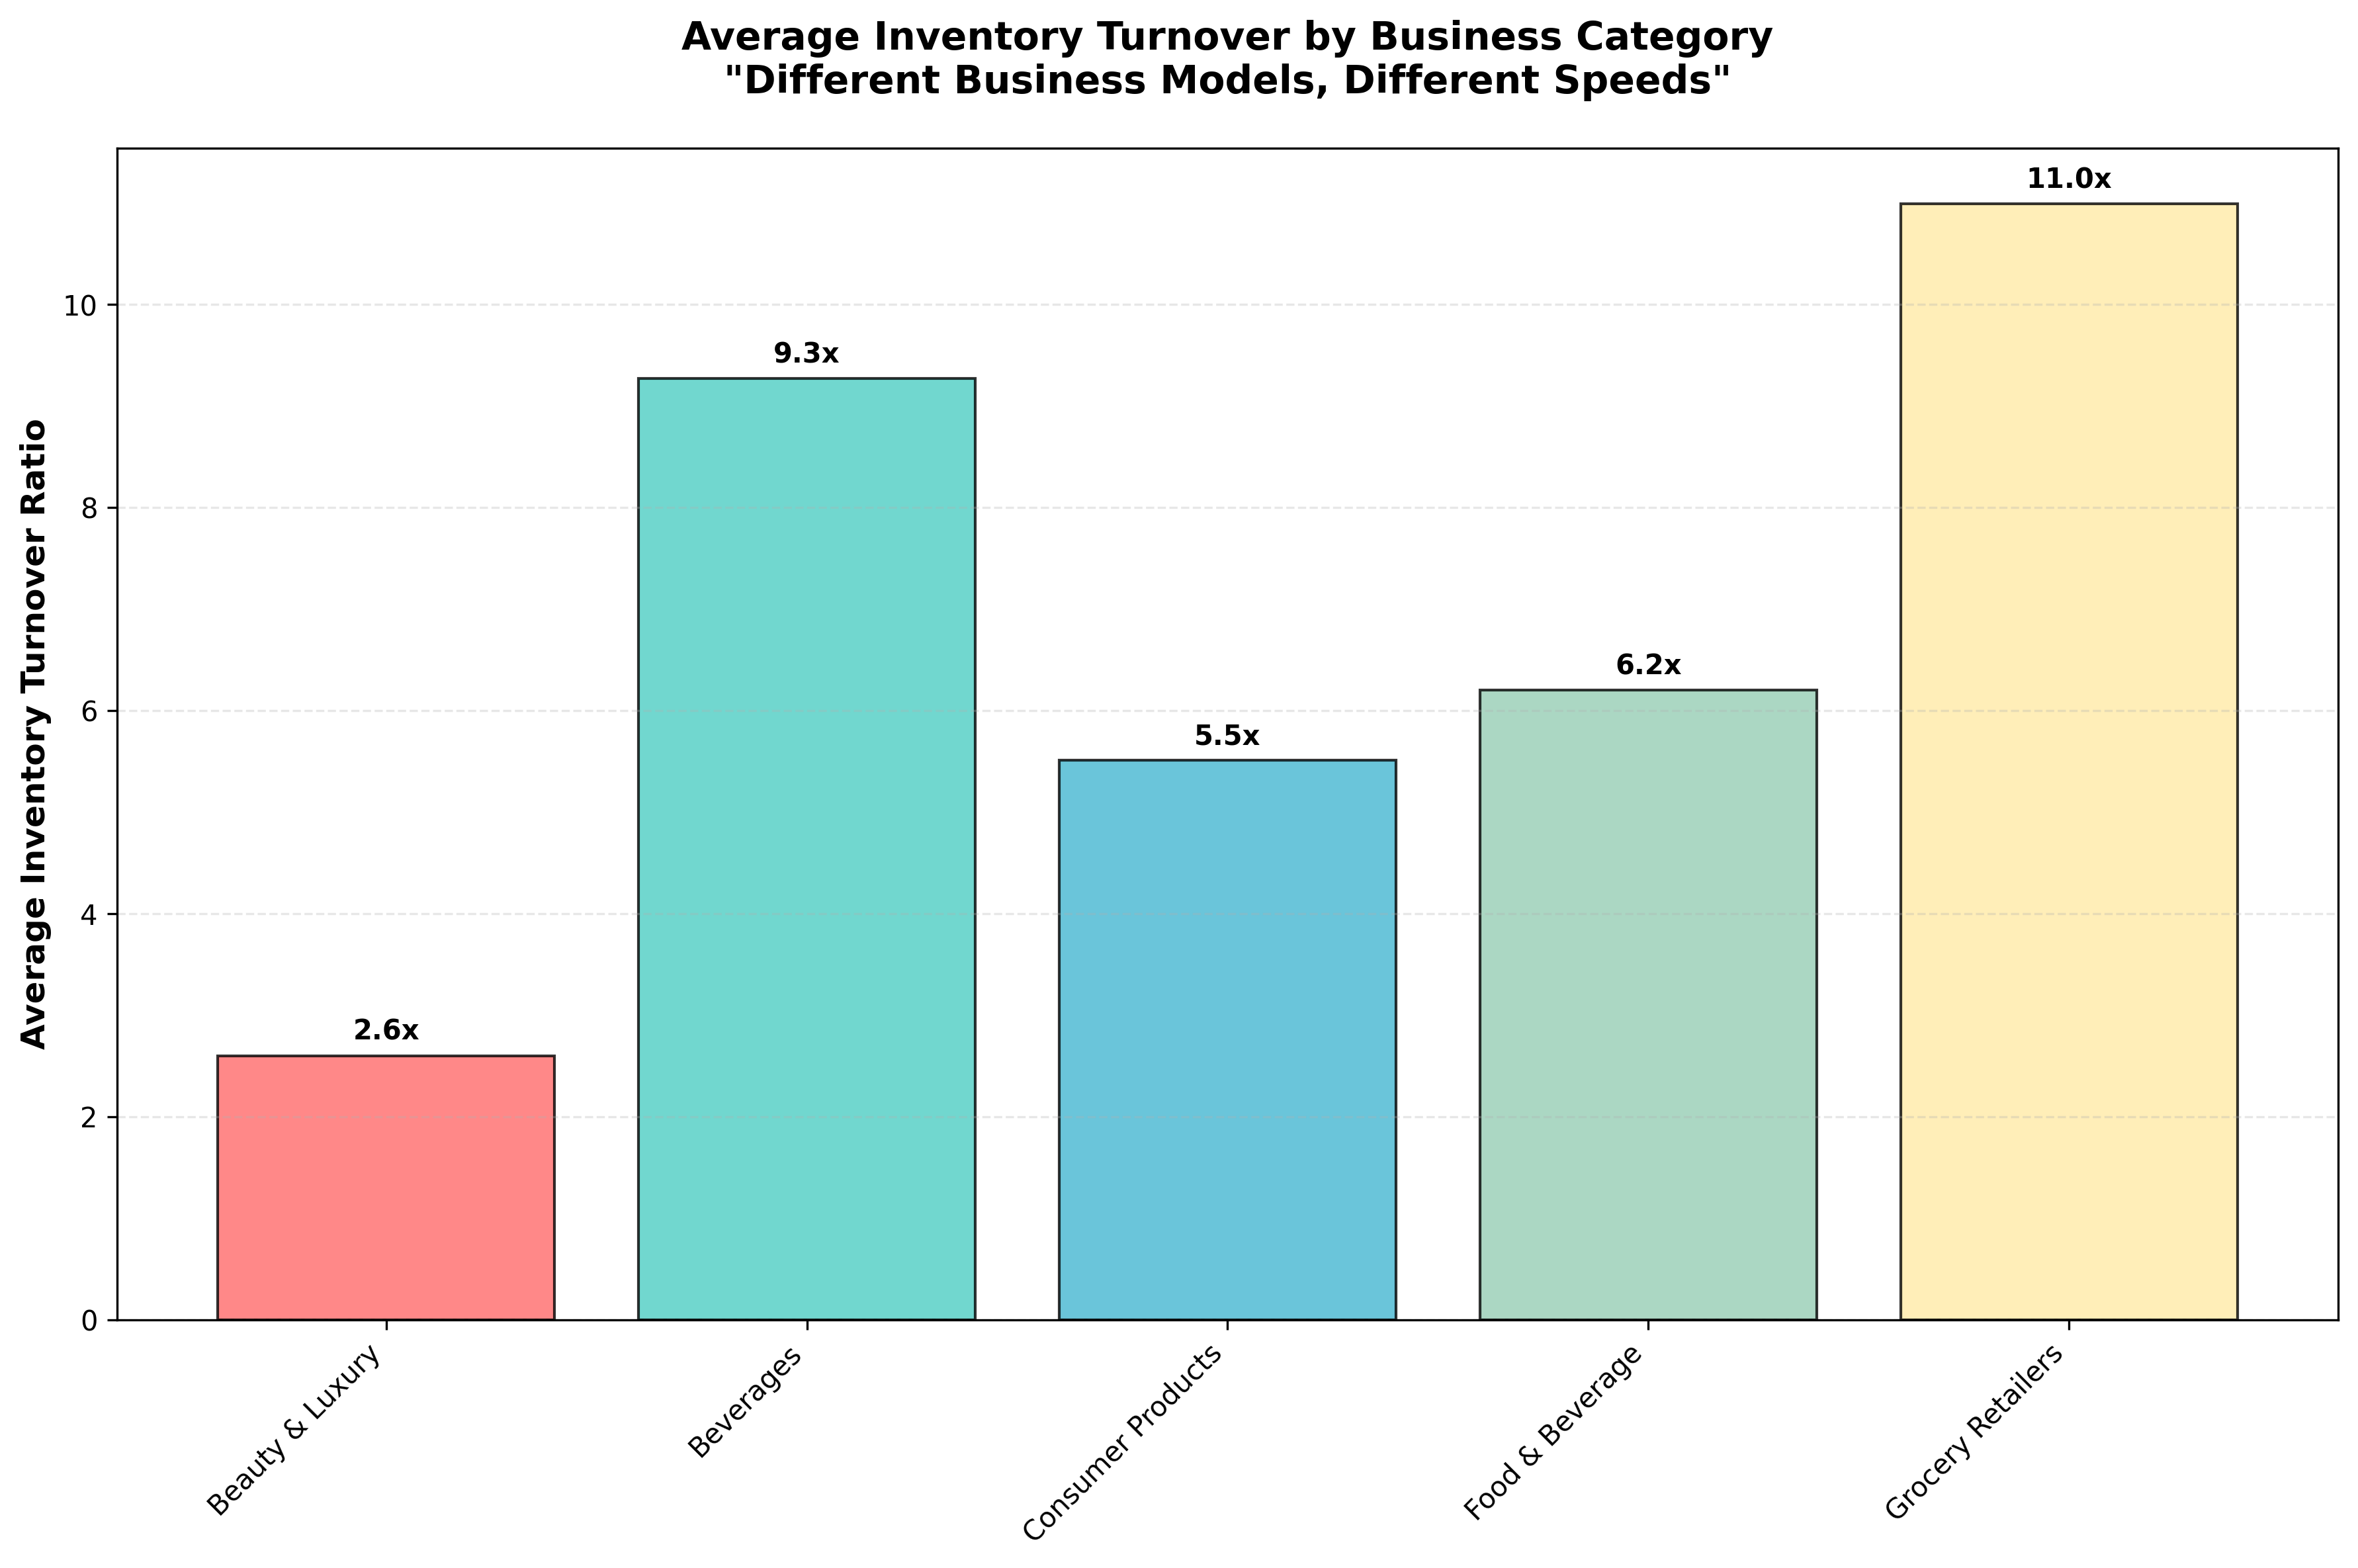
Food & beverage companies average 6.2x turnover, balancing the need for freshness with longer shelf lives and production cycles. Consumer products companies like Procter & Gamble (PG) and Colgate-Palmolive (CL) operate at a more leisurely 5.5x pace – after all, toothpaste and soap don't spoil like bananas. At the other extreme, beauty and luxury brands like Estée Lauder average just 2.6x turnover, reflecting their premium positioning, seasonal collections, and higher margin tolerance for slower-moving inventory.
From Days to Months: The Timeline Perspective
Converting turnover ratios to actual days provides a more intuitive understanding of these business rhythms. Kroger's 23-day cycle means that theoretically, every banana, every box of cereal, every gallon of milk gets sold and replaced in less than a month. Compare this to McCormick & Company (MKC) at 105 days – their spices and seasonings can sit comfortably for over three months, reflecting both the product's stability and consumer purchasing patterns.
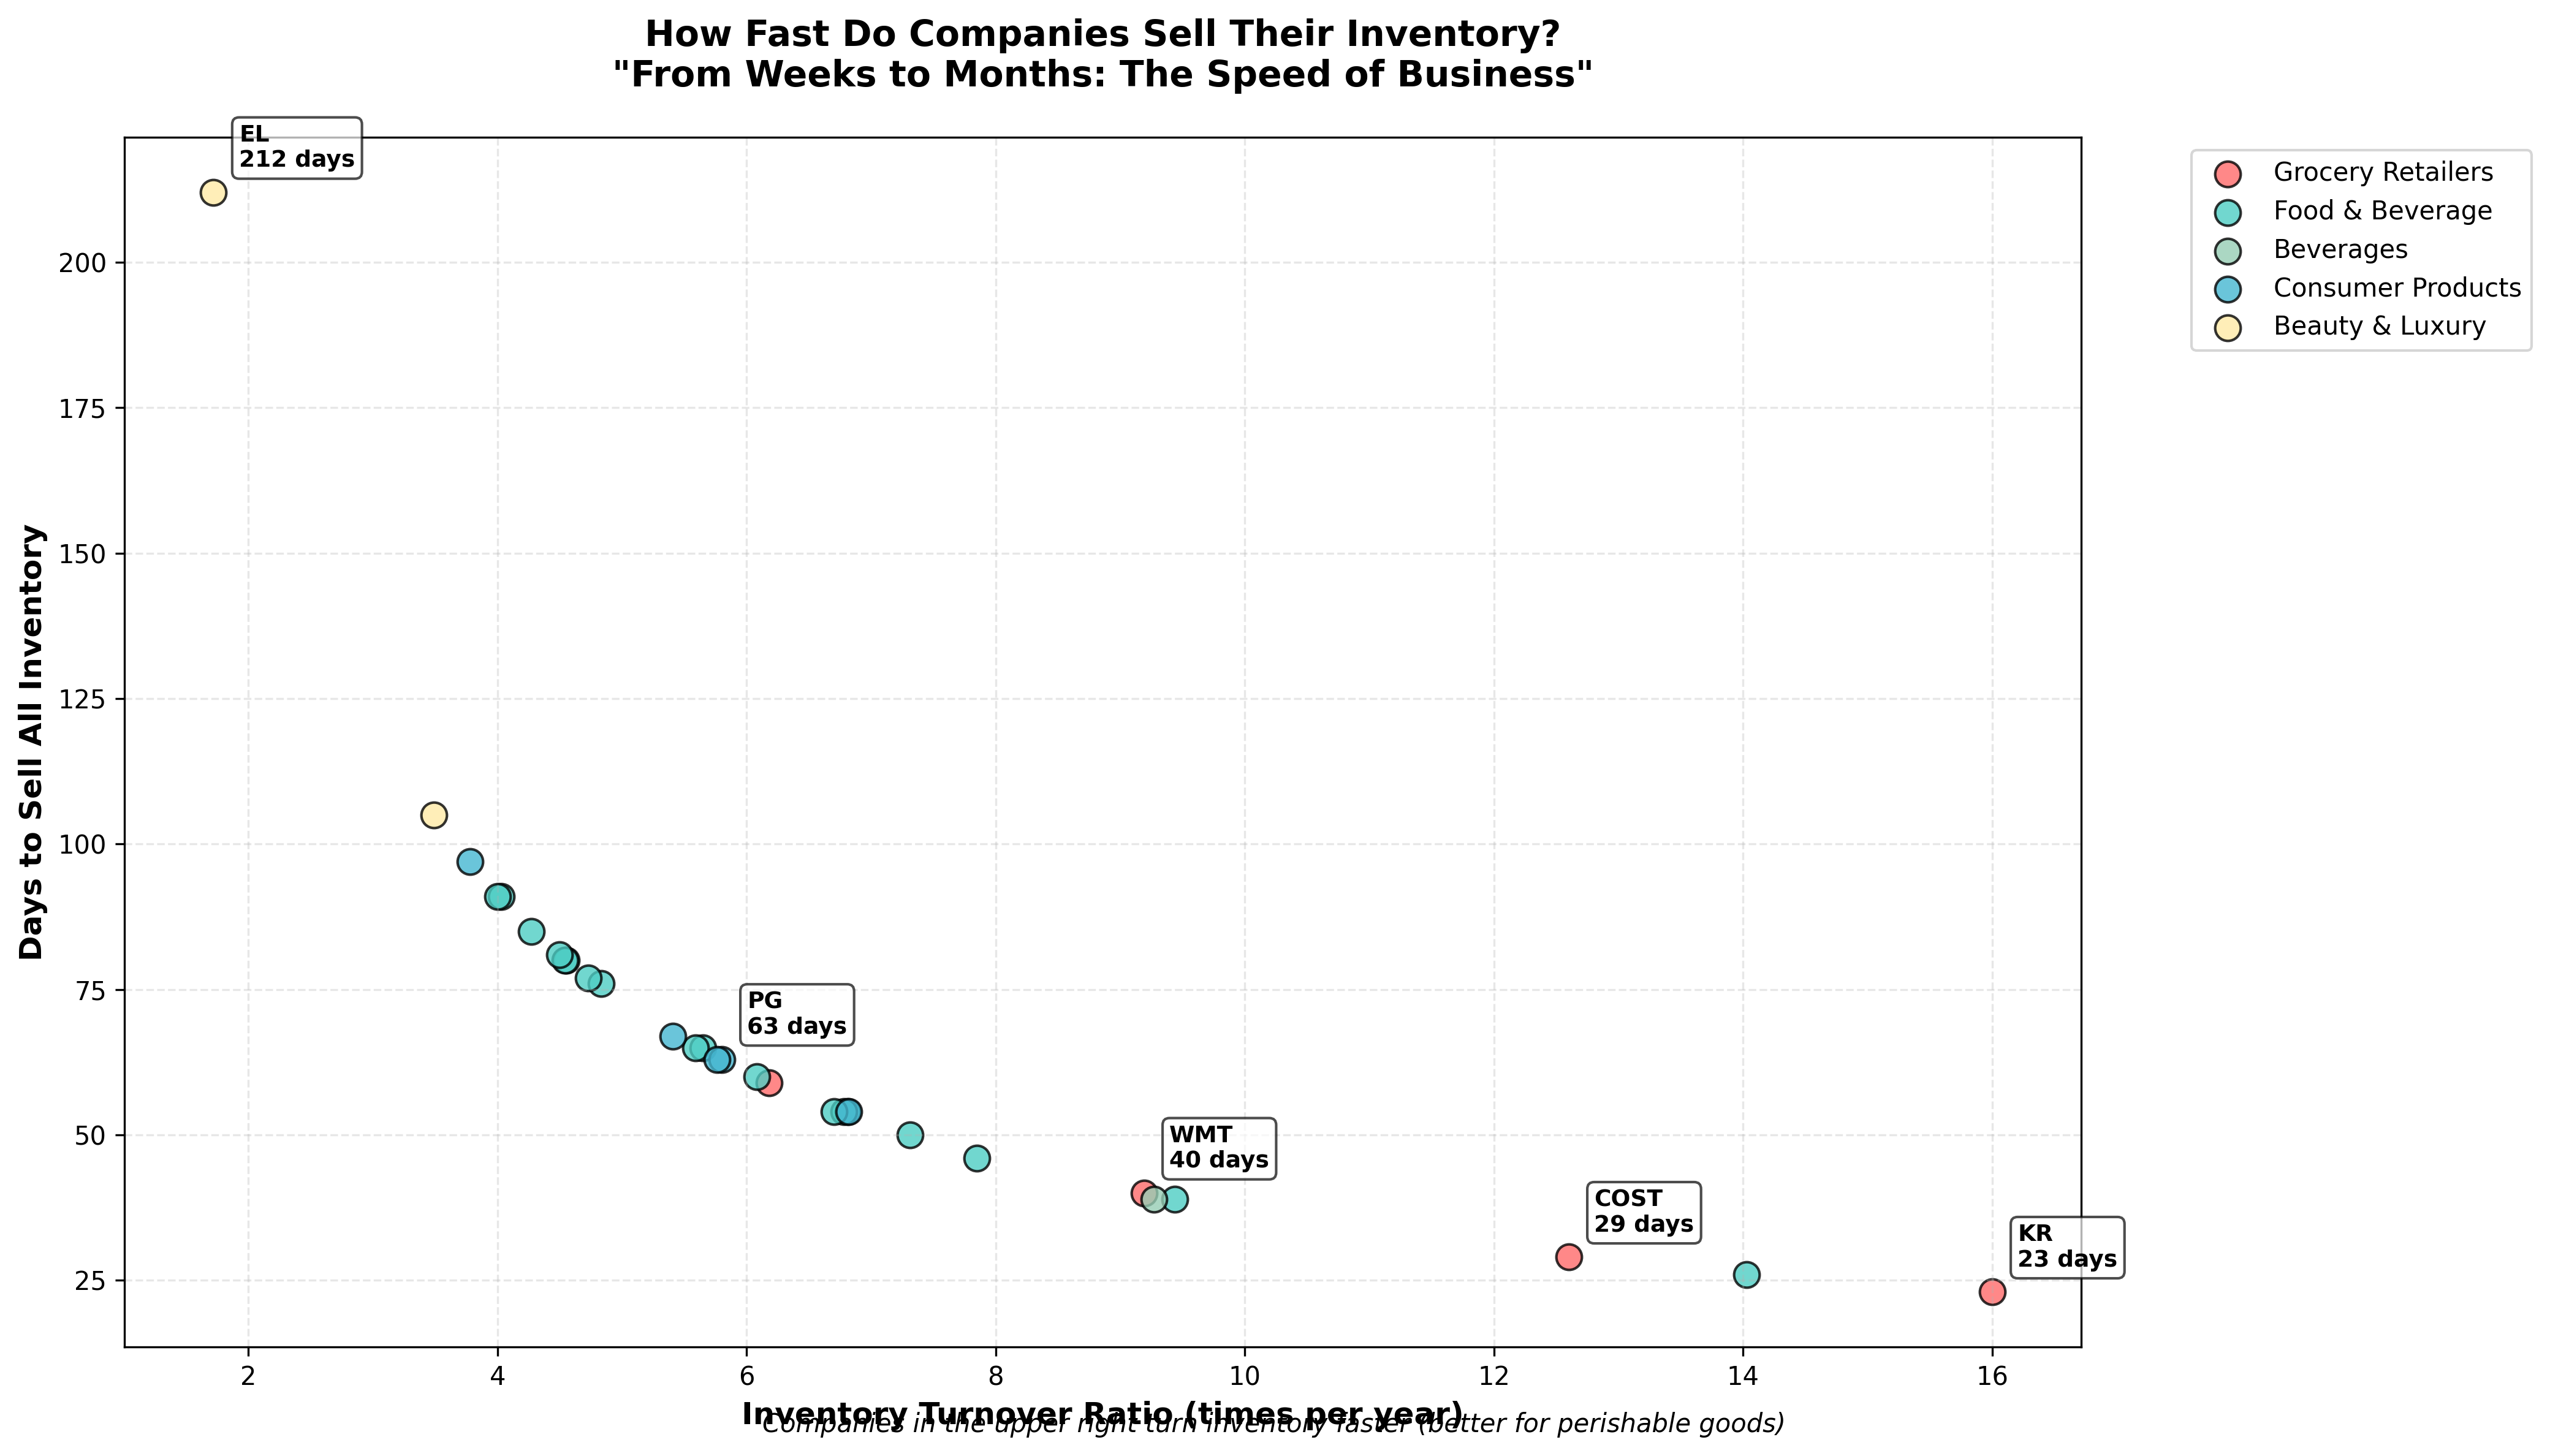
The beauty of this analysis lies in understanding what these numbers mean for different stakeholders. For consumers, faster turnover often means fresher products and competitive pricing. For investors, it can signal efficient management and strong demand. However, context matters – a luxury brand with slower turnover isn't necessarily poorly managed; it might be successfully maintaining exclusivity and premium pricing.
What These Numbers Really Mean
- High turnover (like Kroger's 16x) indicates efficient operations, strong demand, and minimal waste – crucial for perishable goods
- Moderate turnover (like PepsiCo's 7.85x) balances efficiency with production planning and market coverage
- Lower turnover (like Estée Lauder's 1.72x) can reflect premium positioning, seasonal inventory, or luxury market dynamics
- Industry context is crucial – what's excellent for groceries might be concerning for cosmetics, and vice versa
- Faster isn't always better – the optimal turnover depends on product type, market strategy, and profit margins
Understanding inventory turnover gives us a window into the operational heartbeat of American retail and consumer goods. From Kroger's lightning-fast grocery cycles to Estée Lauder's carefully curated luxury timelines, each company's turnover rate tells a story about their customers, their products, and their path to profitability. Whether you're a curious consumer, an aspiring investor, or simply someone who enjoys understanding how business works, these numbers reveal the fascinating complexity behind the simple act of buying everyday products.
Comments (0)
No comments yet. Be the first to comment!