Technology Sector Resilience
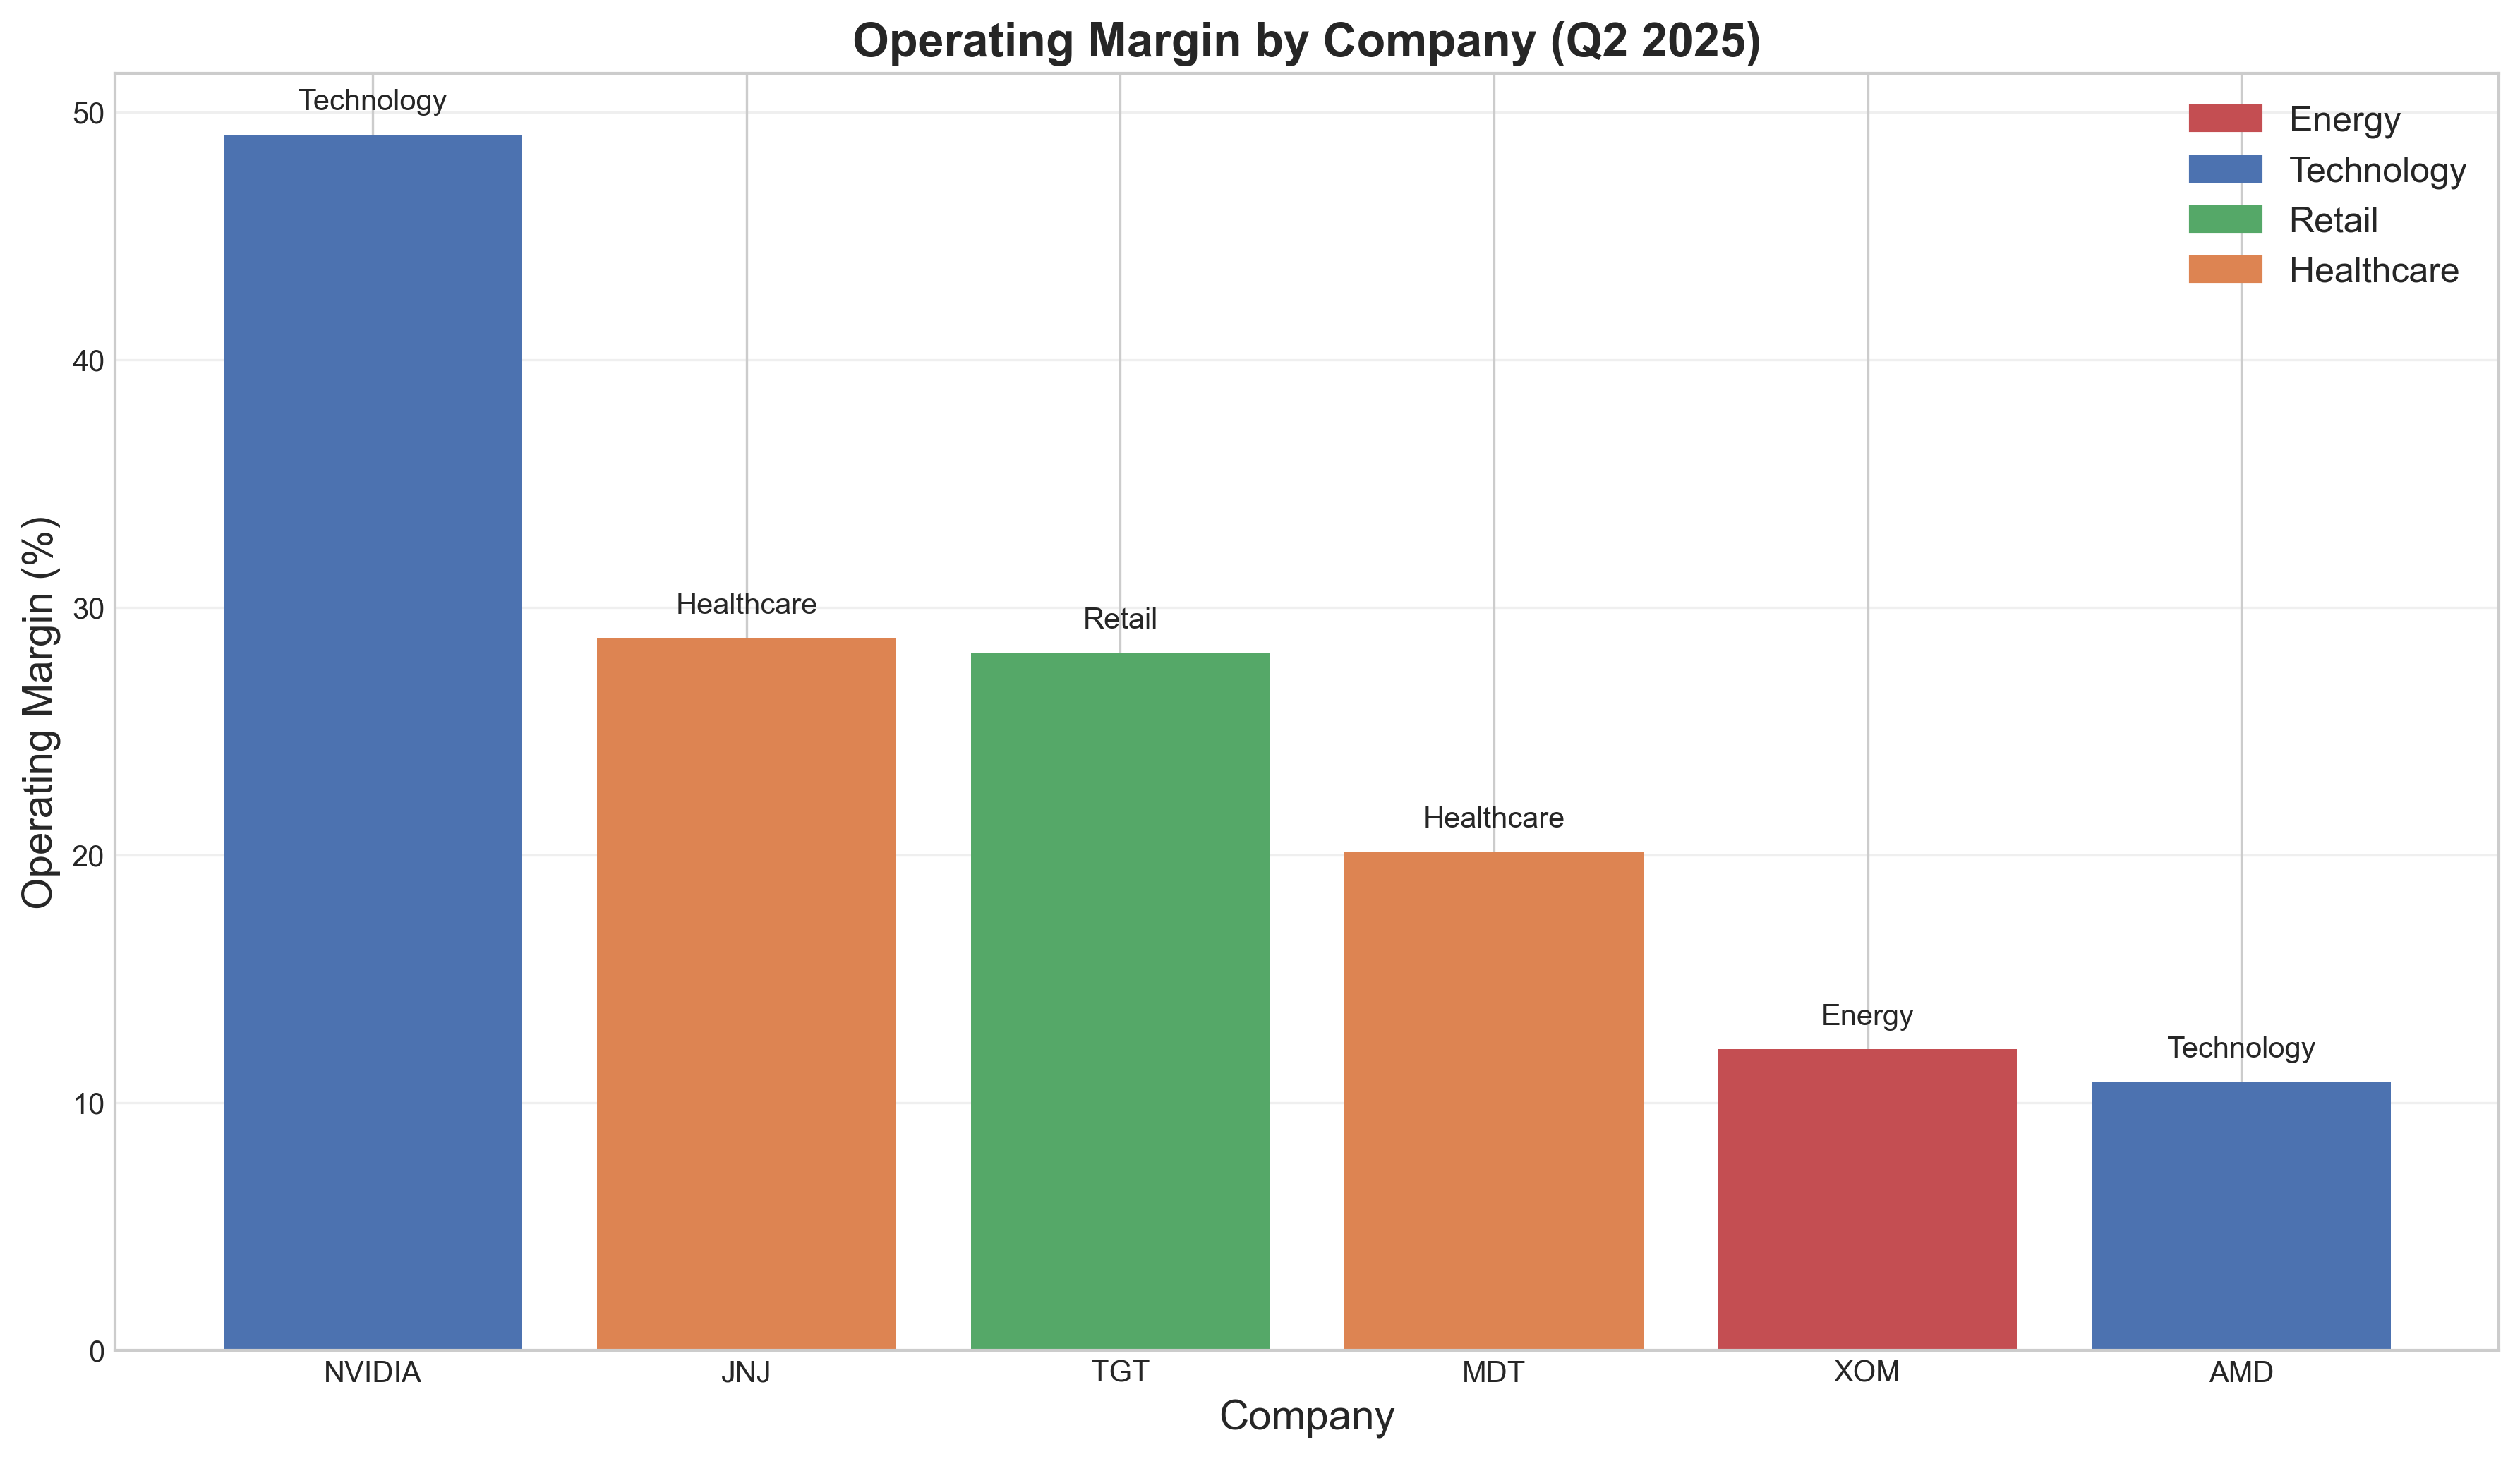
Technology companies have demonstrated remarkable resilience this quarter, with semiconductor manufacturers leading the pack in financial performance. Nvidia has emerged as the standout winner with an impressive 49.11% operating margin, more than quadruple AMD's 10.84%. The staggering contrast between these two semiconductor powerhouses highlights how efficiently Nvidia has managed to monetize the ongoing artificial intelligence revolution.
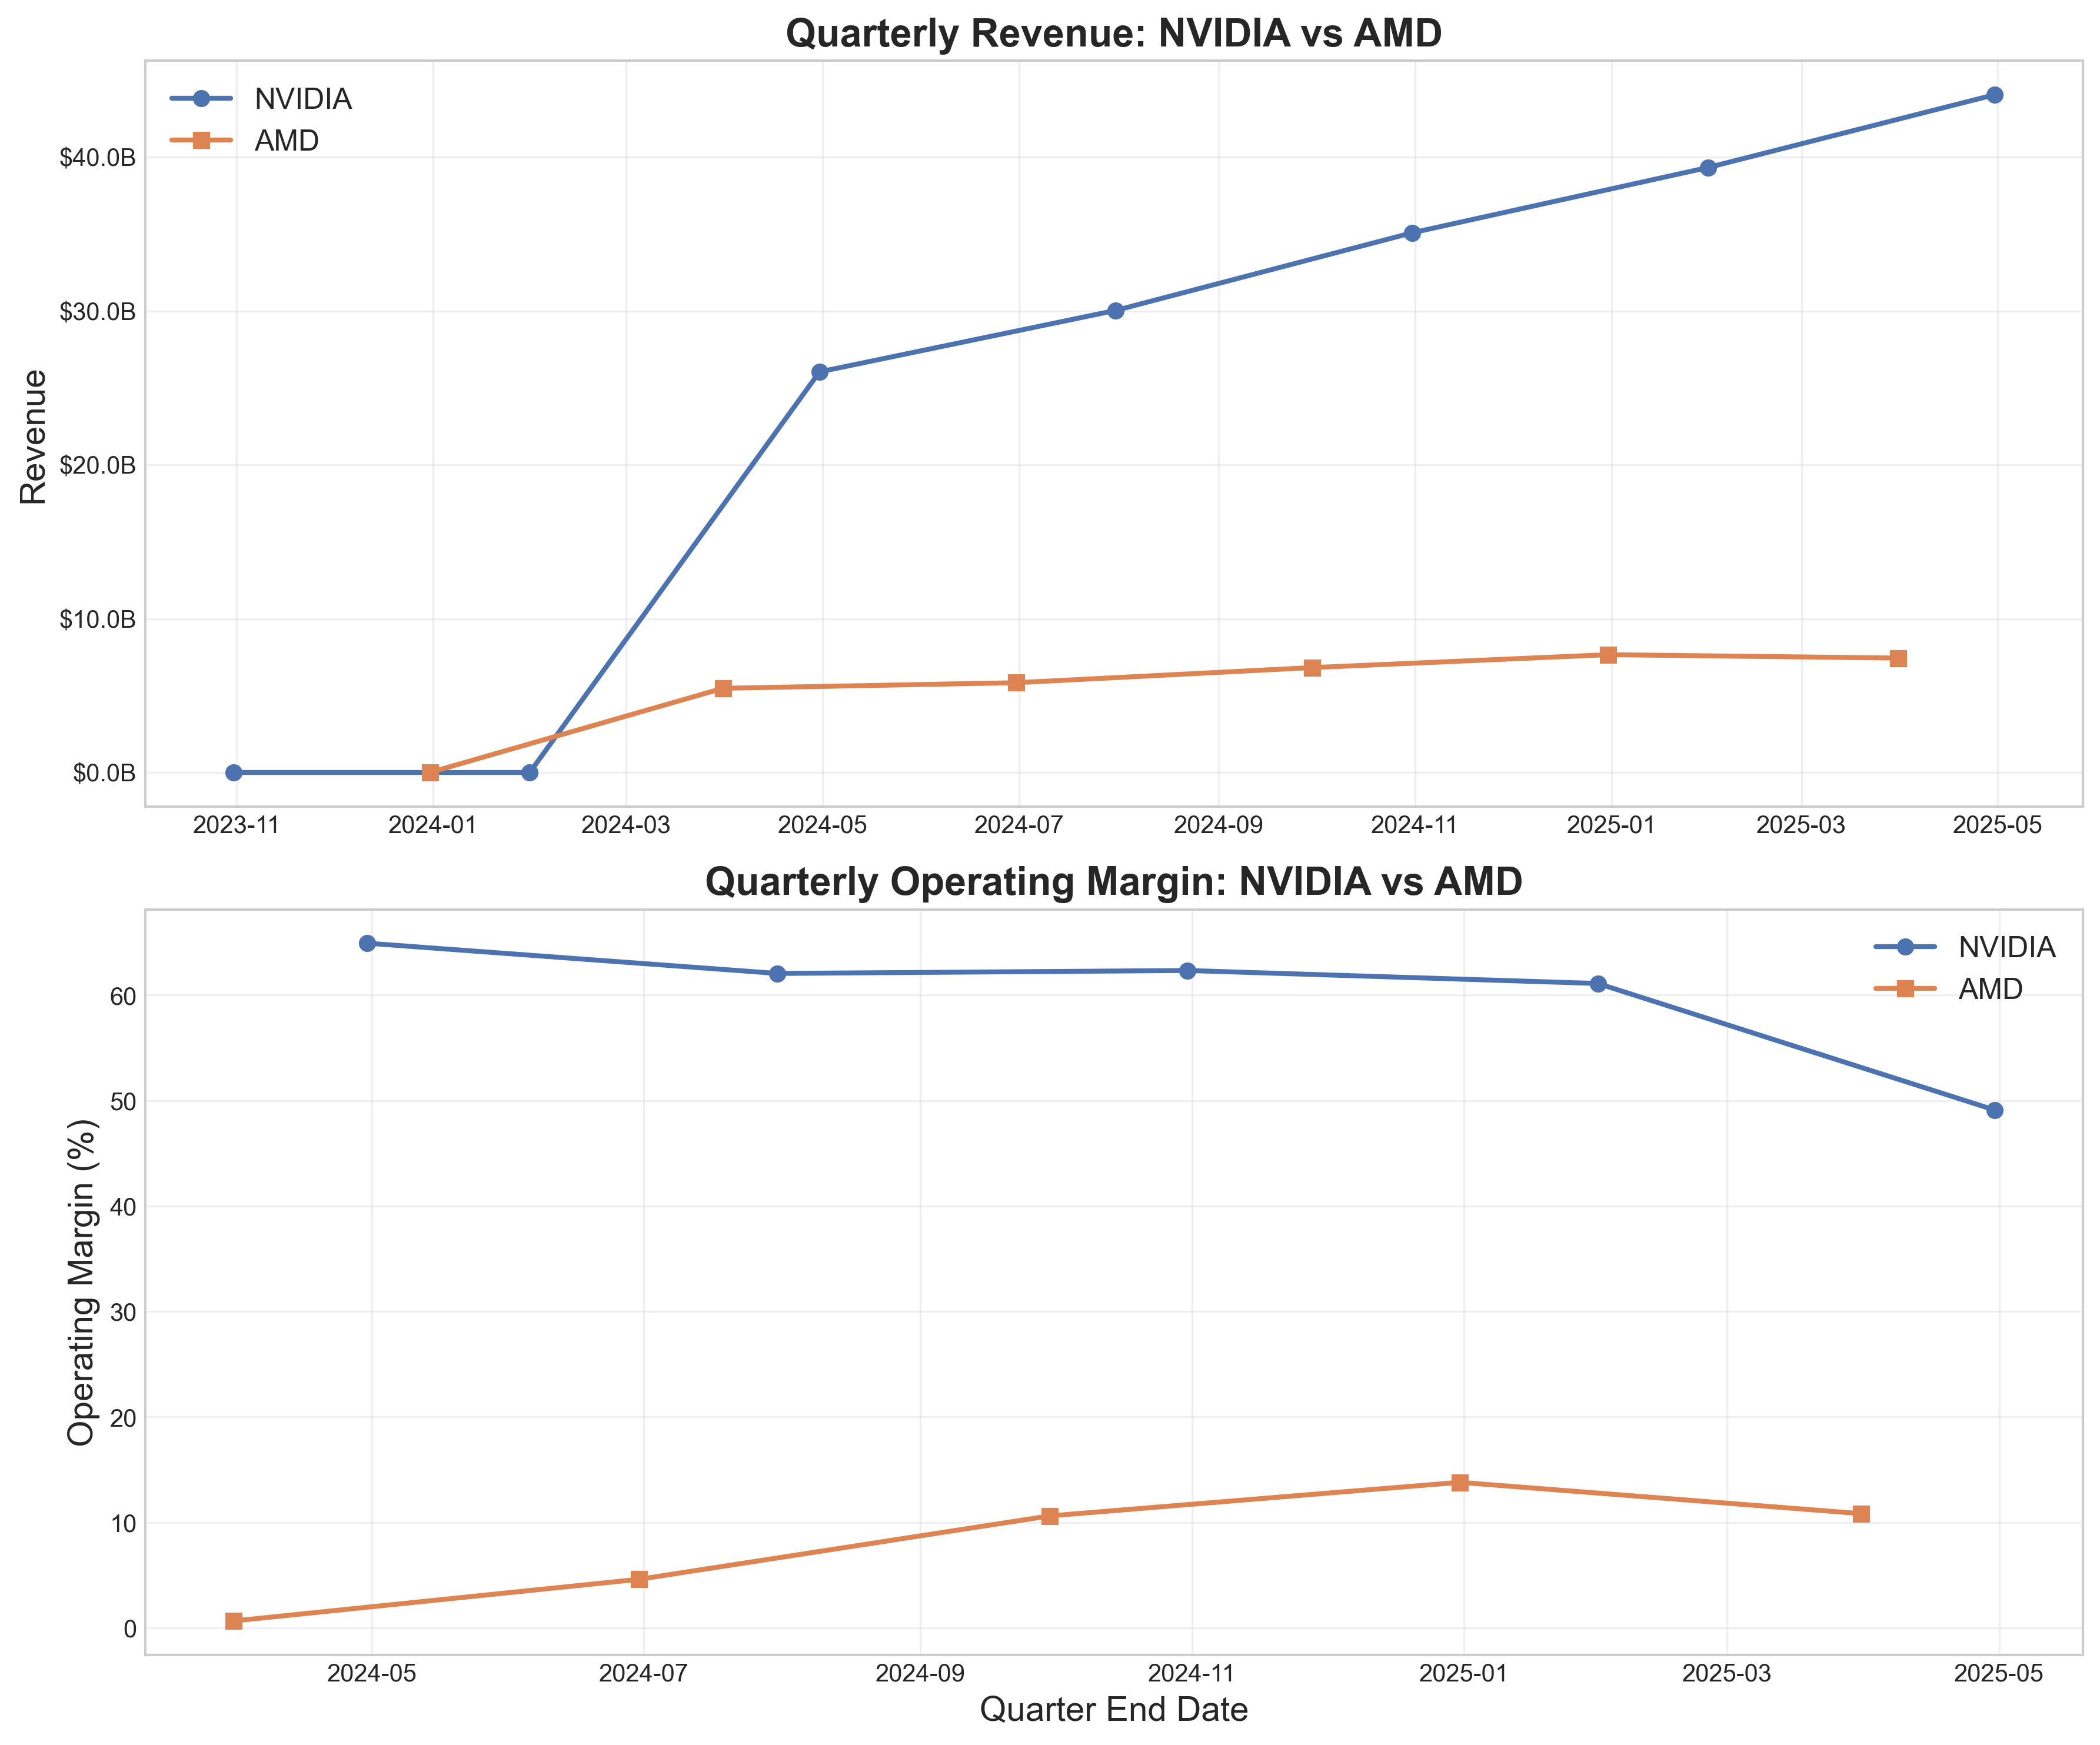
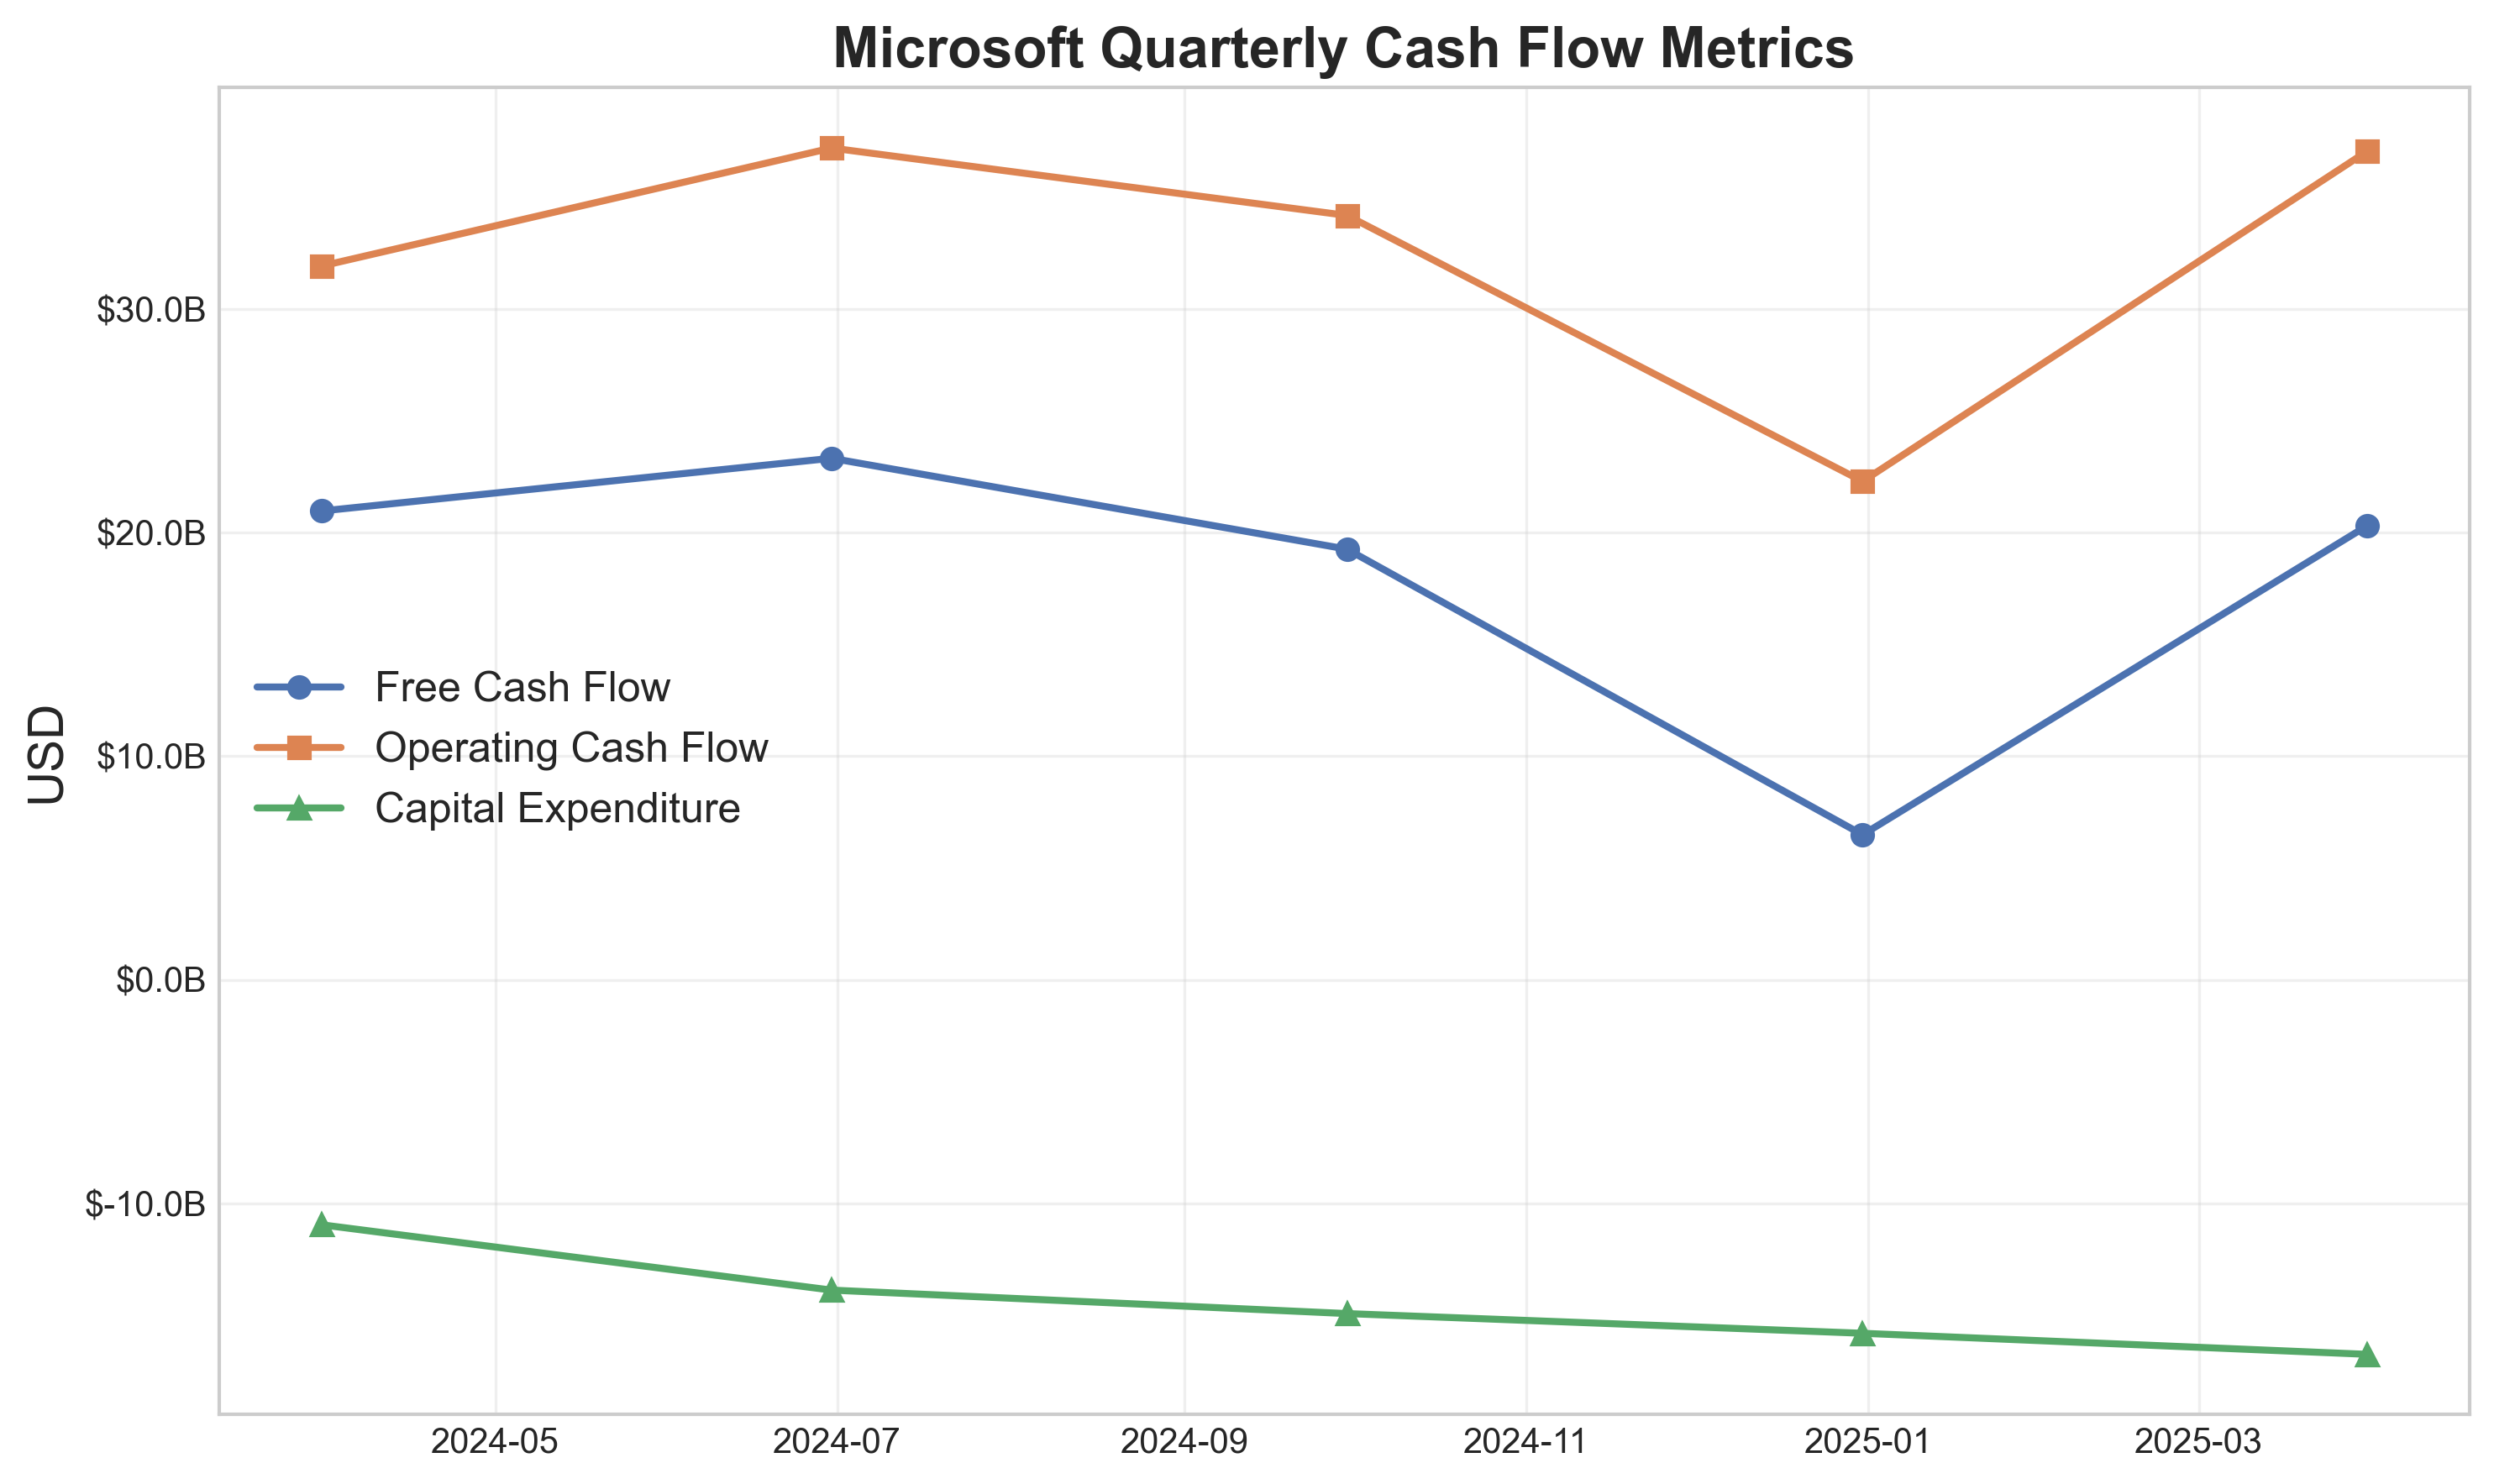
The quarterly performance metrics reveal how Nvidia has leveraged its first-mover advantage in AI-specific hardware, translating specialized technology investments into substantial profit margins. Meanwhile, Microsoft continues to demonstrate why cloud infrastructure remains a compelling business model with its robust cash flow generation despite ongoing macroeconomic uncertainties.
Healthcare's Mixed Results
The healthcare sector presented a more nuanced picture this quarter, with pharmaceutical-focused Johnson & Johnson outperforming medical device maker Medtronic. JNJ reported a 28.77% operating margin compared to Medtronic's 20.13%, highlighting the relative stability of pharmaceutical revenue streams over medical device sales in the current economic environment.
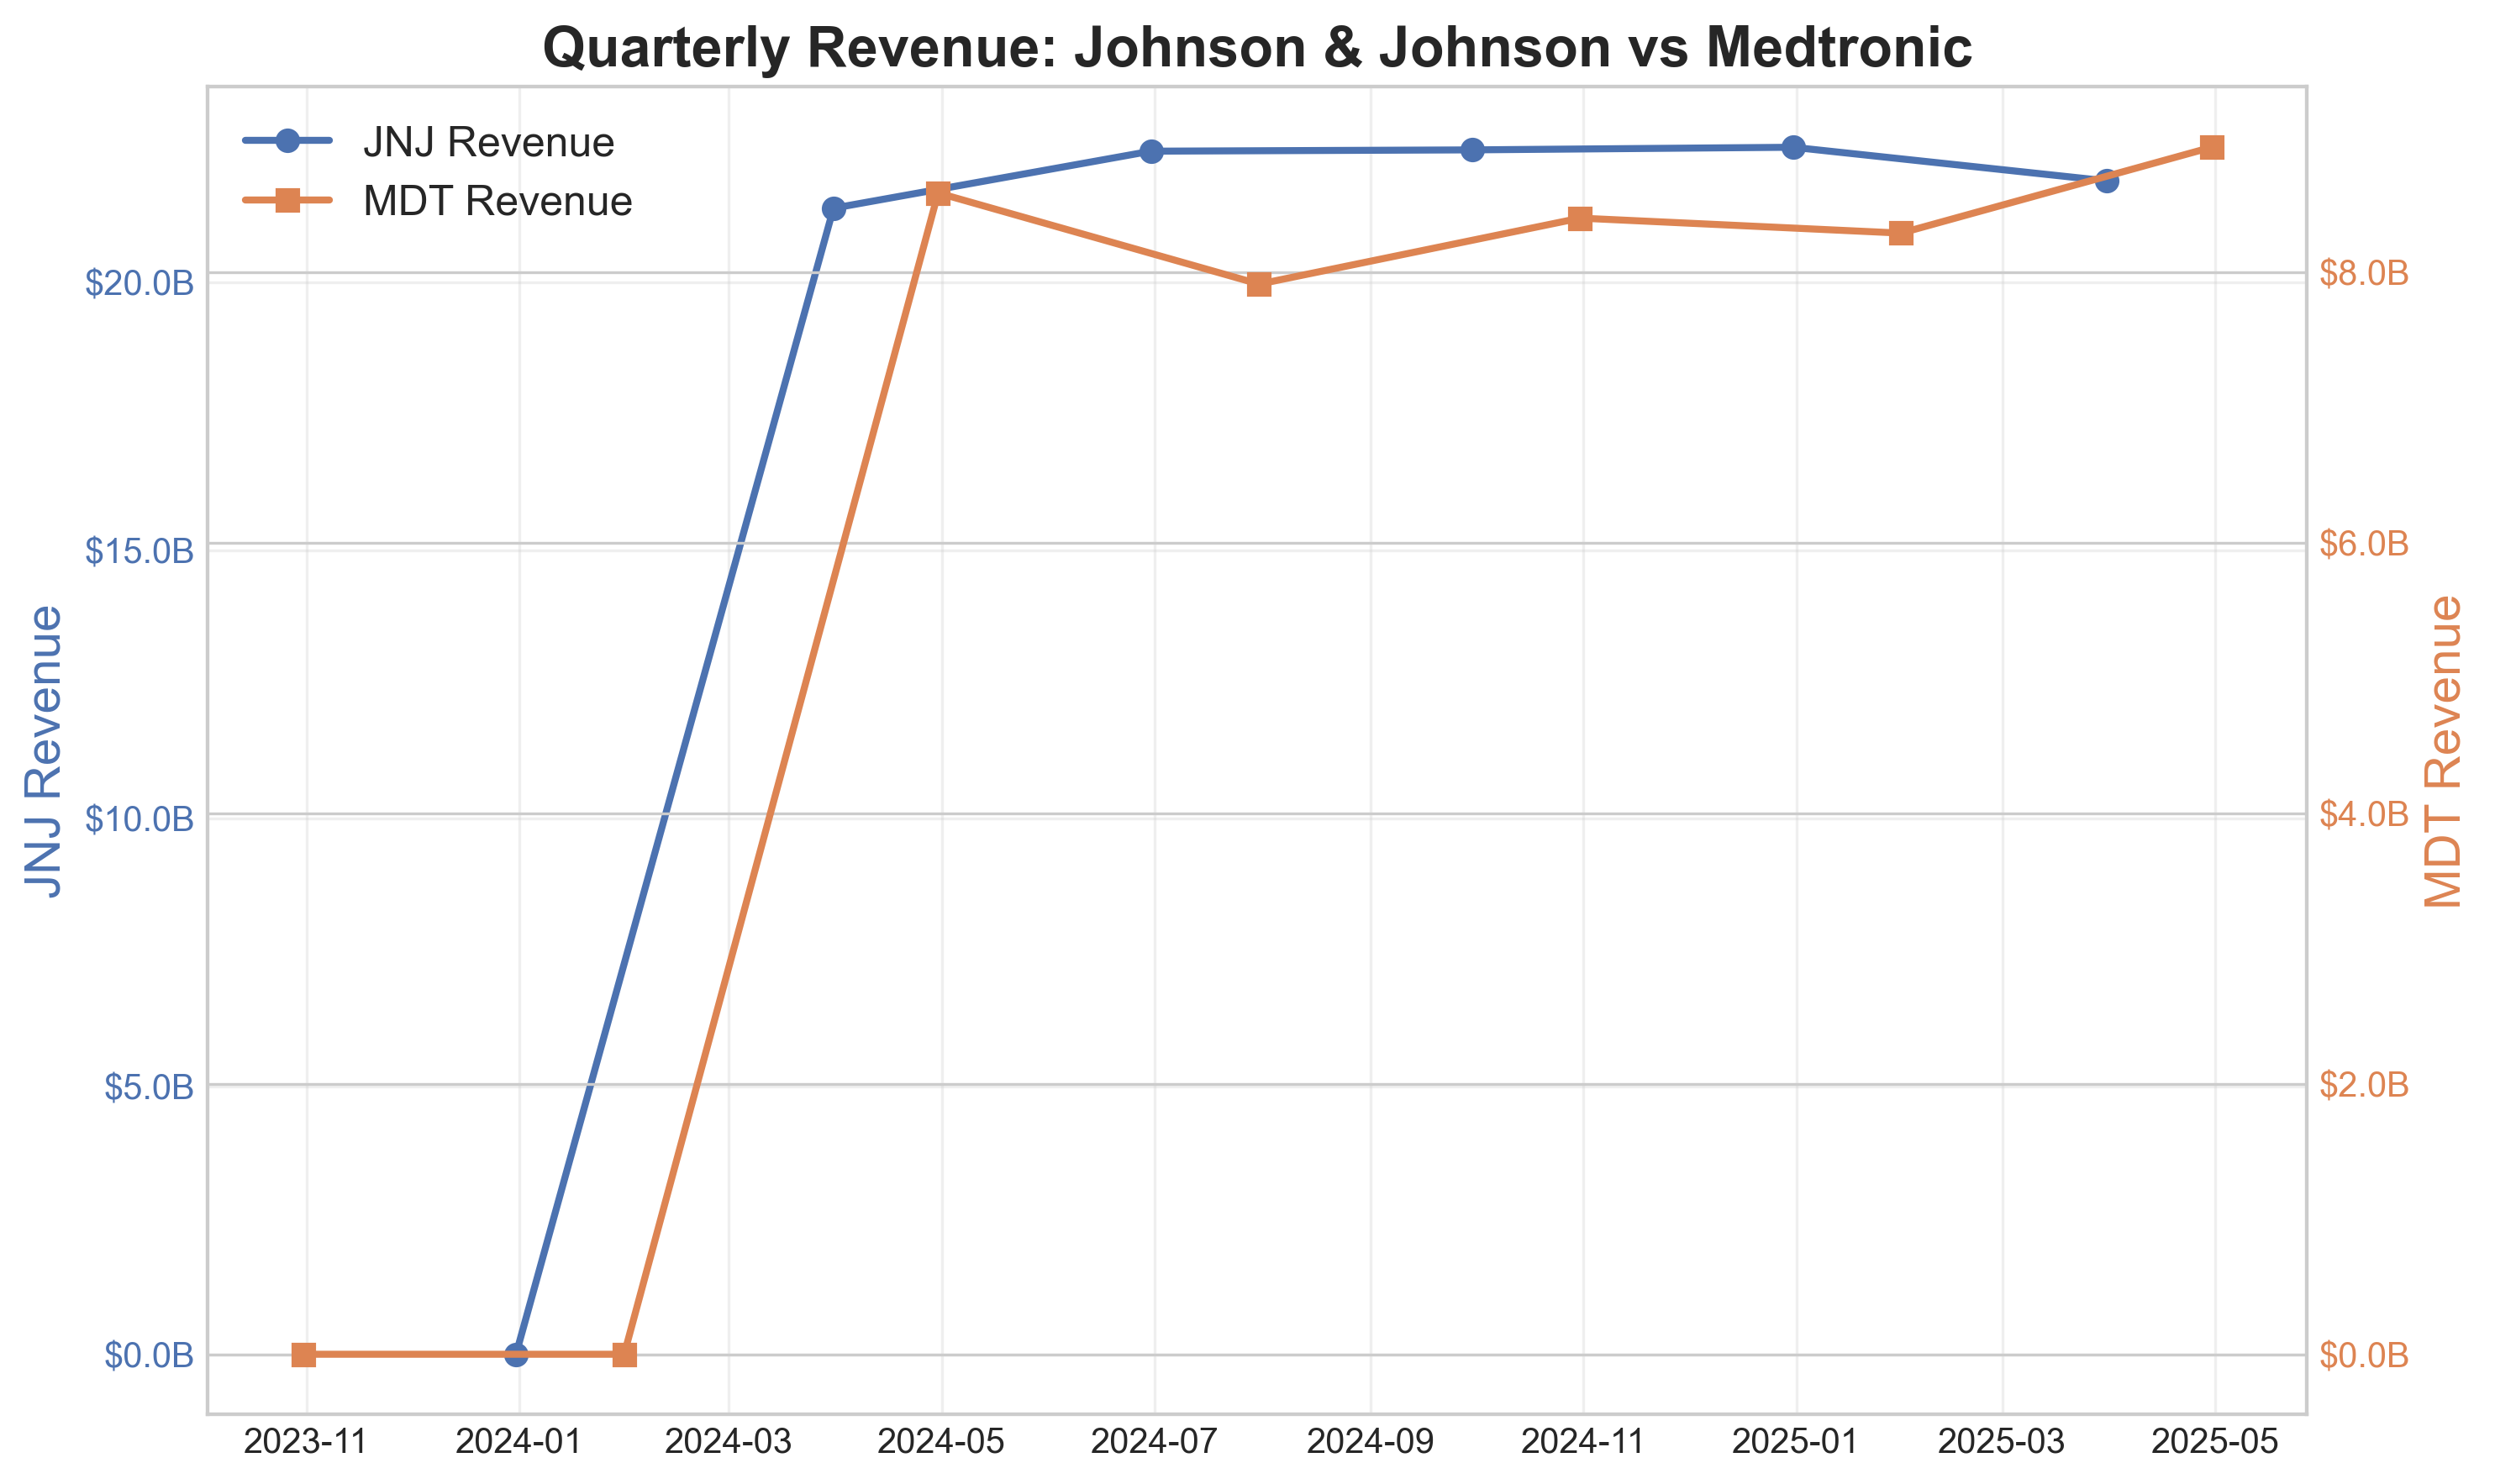
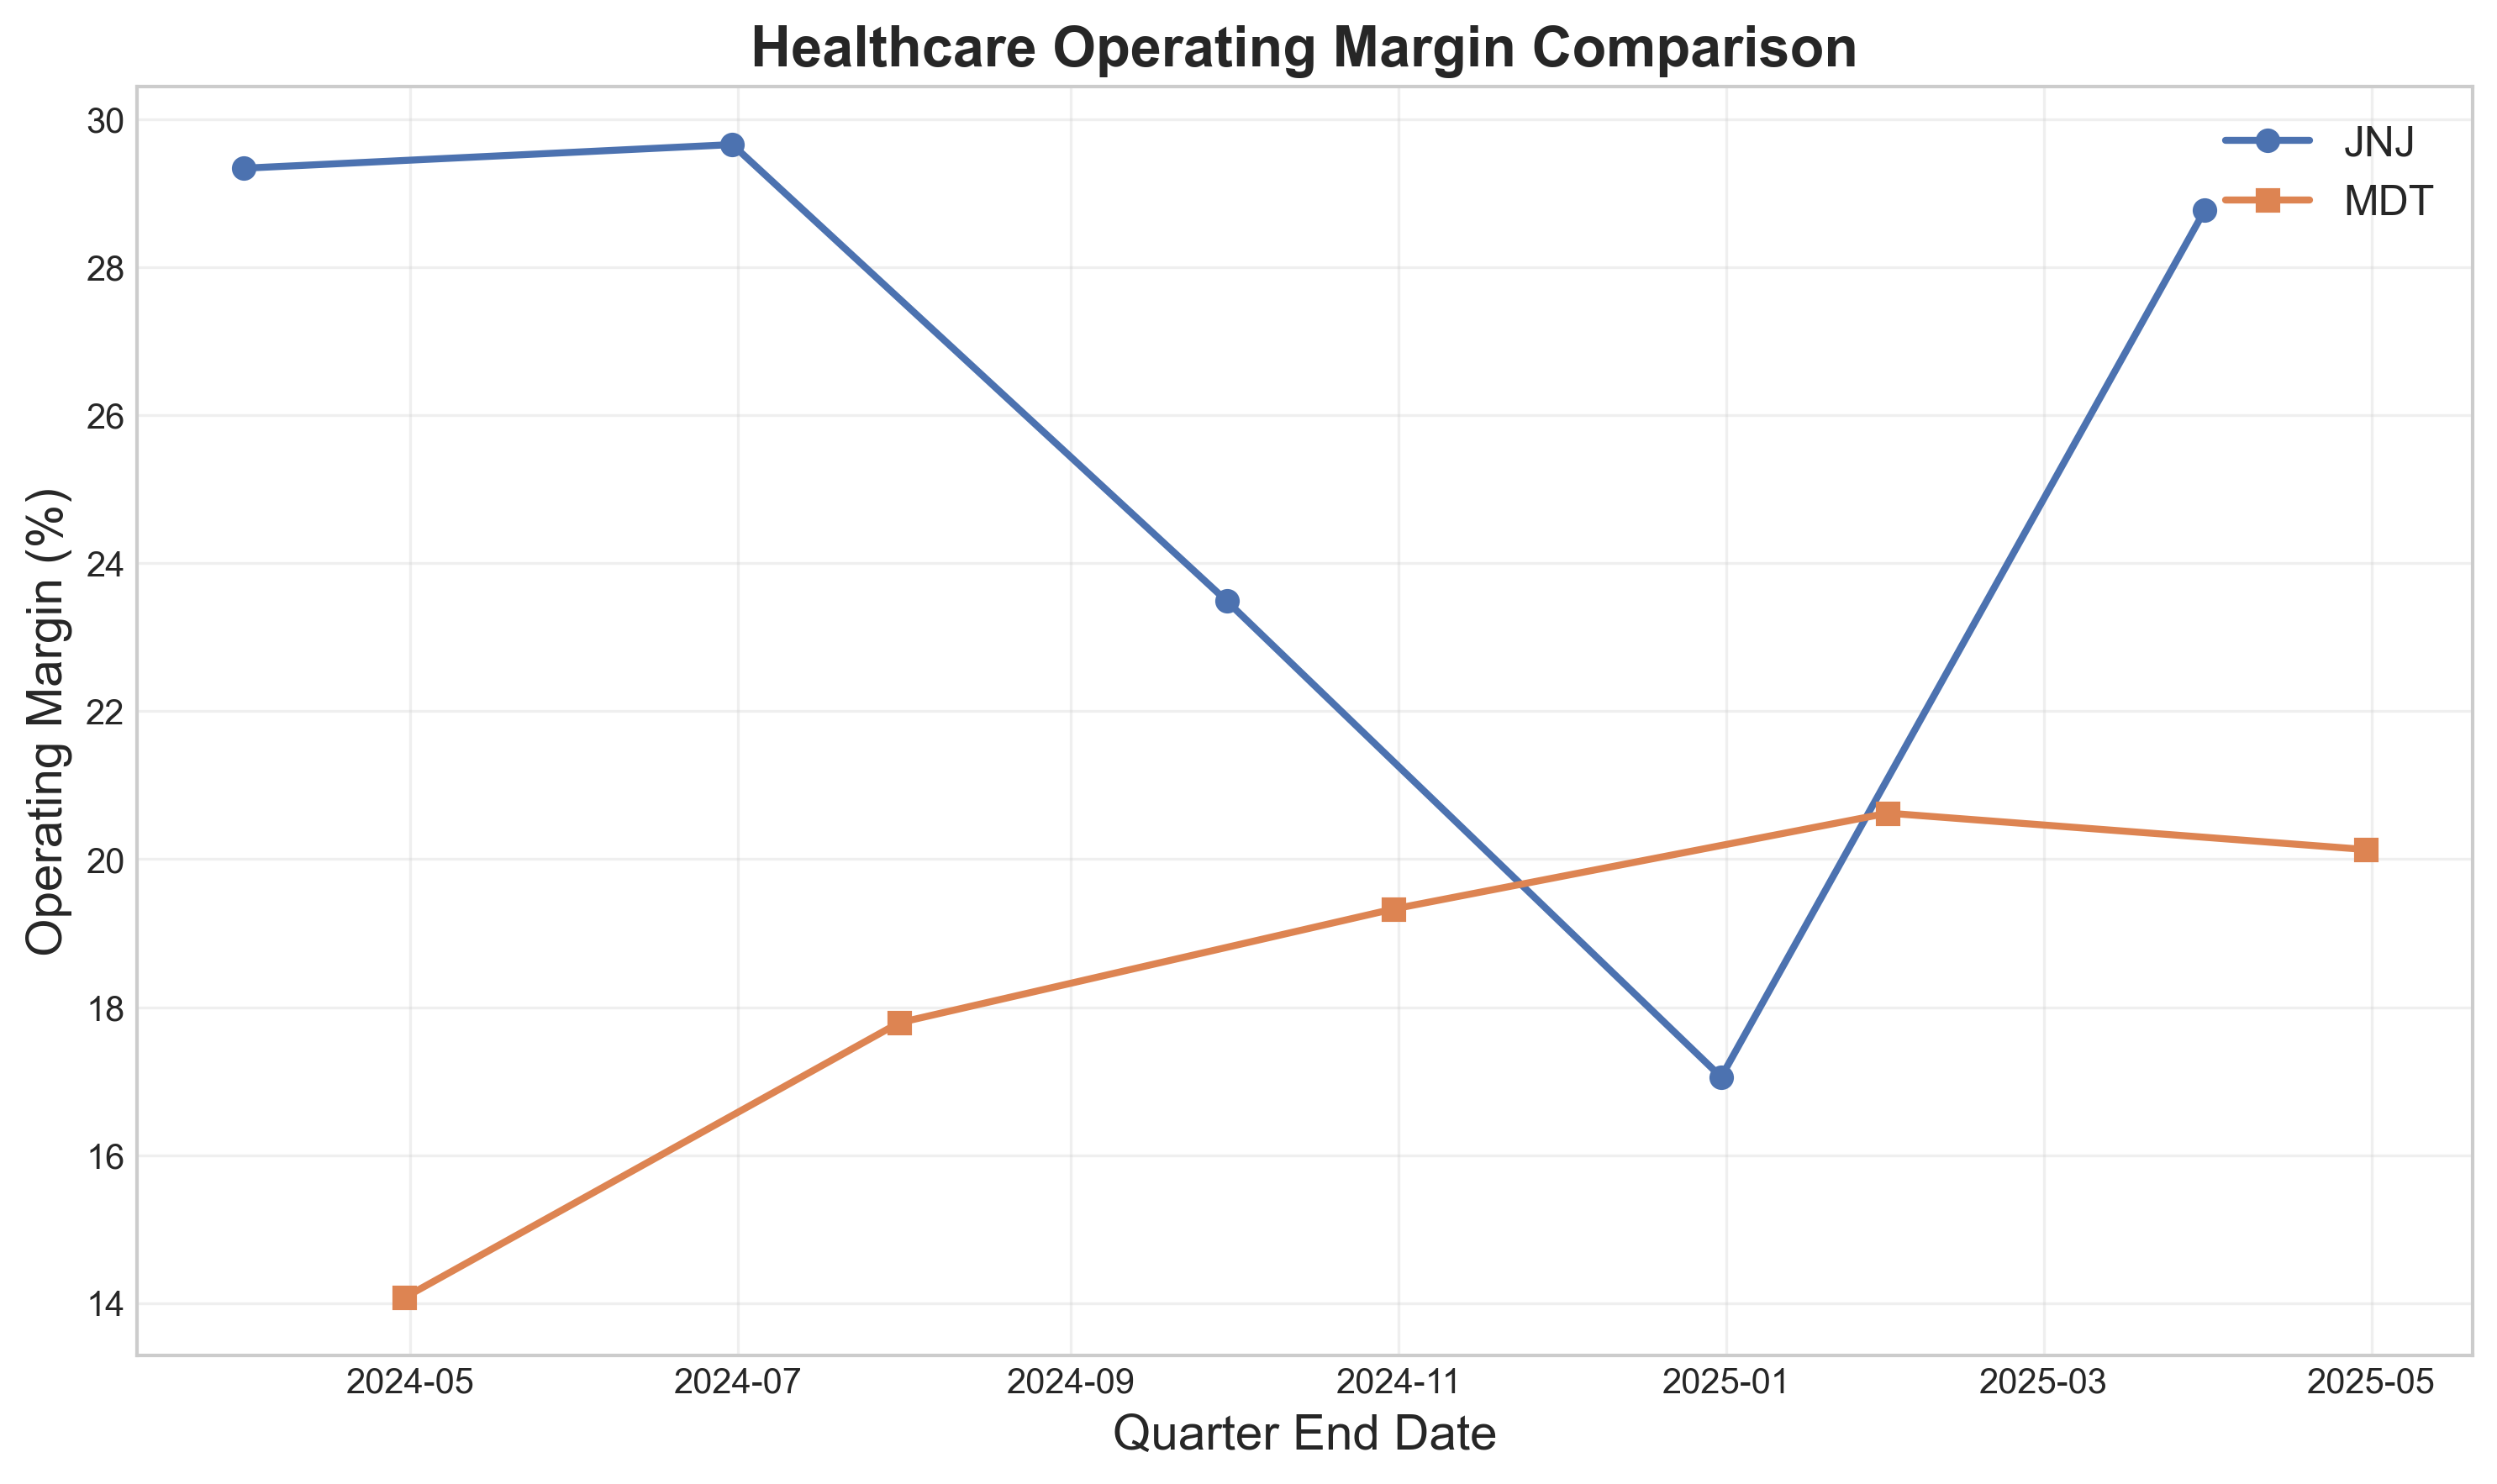
This divergence reflects healthcare institutions' prioritization of pharmaceutical treatments over elective procedures and new device investments, a trend that emerged during pandemic disruptions and has persisted through economic uncertainty. Johnson & Johnson's diversified portfolio has provided insulation against these market shifts, while Medtronic continues to navigate a more challenging sales environment for specialized medical equipment.
Retail Sector Challenges
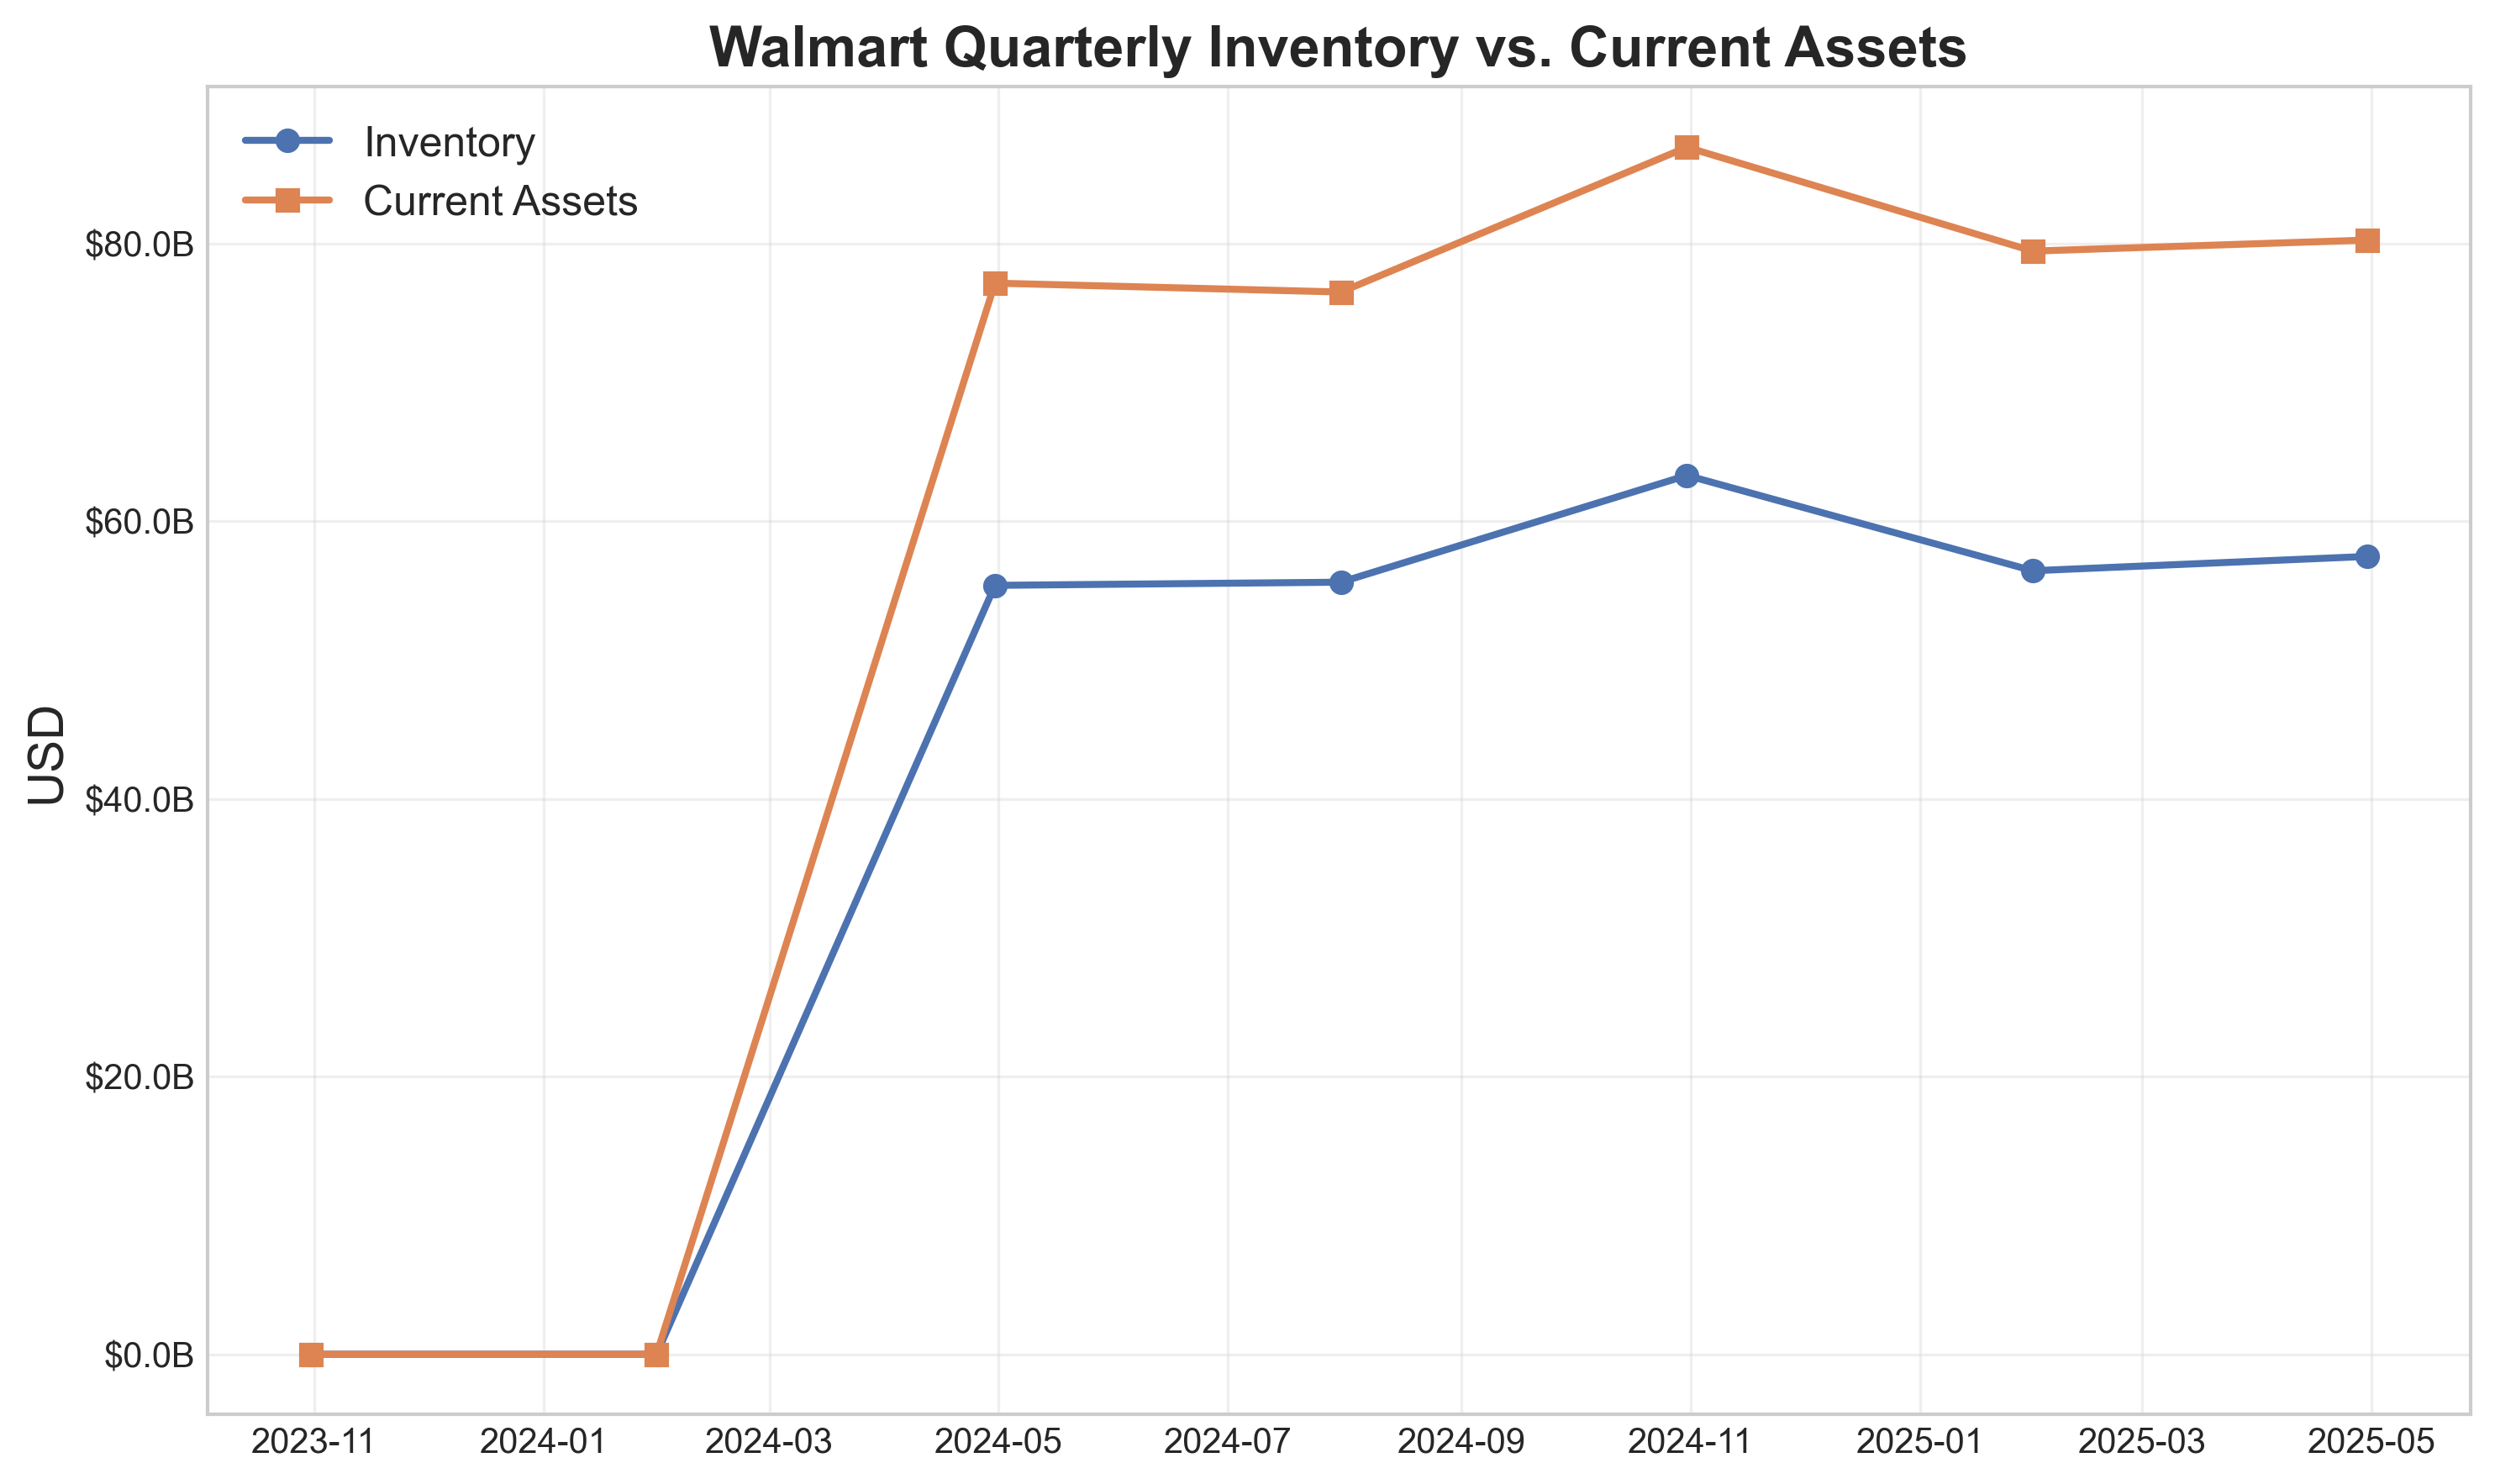
Traditional retailers have encountered persistent headwinds this quarter, with inventory management emerging as a critical differentiator between performers. Walmart's latest financial data shows inventory comprising 71.61% of current assets, highlighting the considerable capital tied up in merchandise amid changing consumer spending patterns.
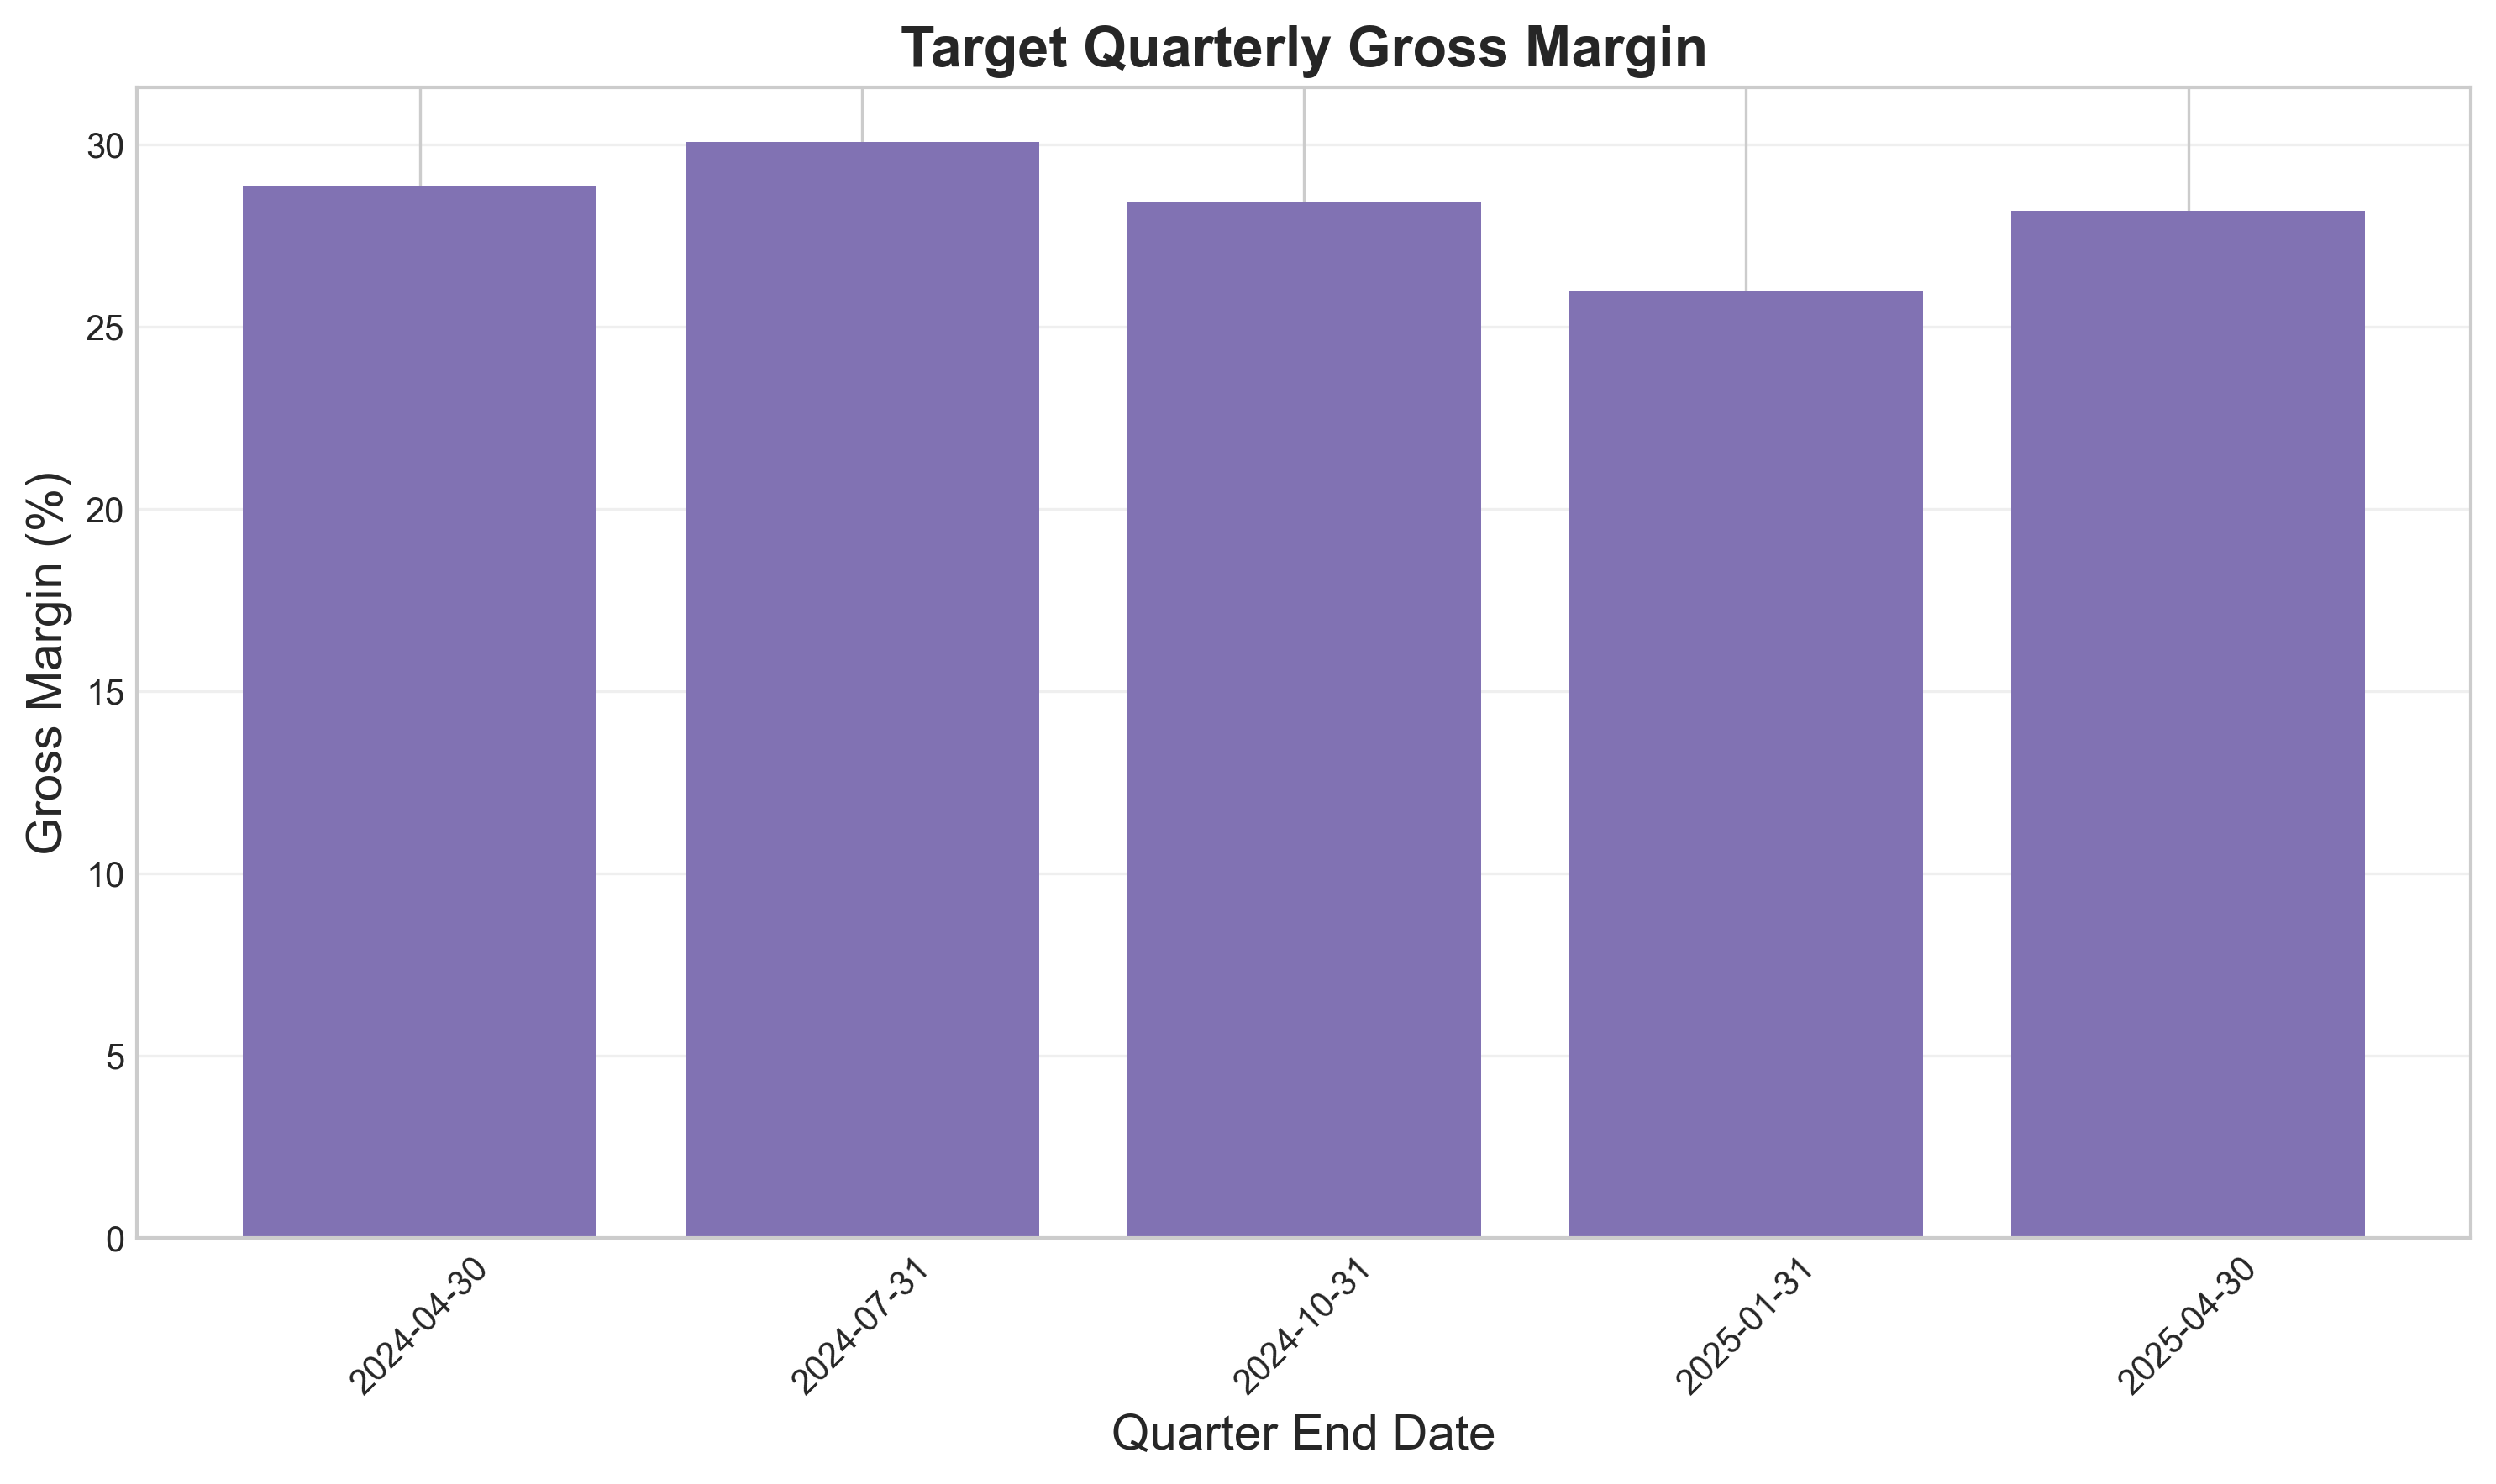
Target's ability to maintain a 28.17% gross margin reflects successful adaptation to shifting consumer preferences, with strategic focus on essential goods over discretionary purchases. The contrast between these retail giants reveals how inventory efficiency and product mix adjustments have become crucial survival strategies in a cautious consumer spending environment.
Energy Sector Pressure
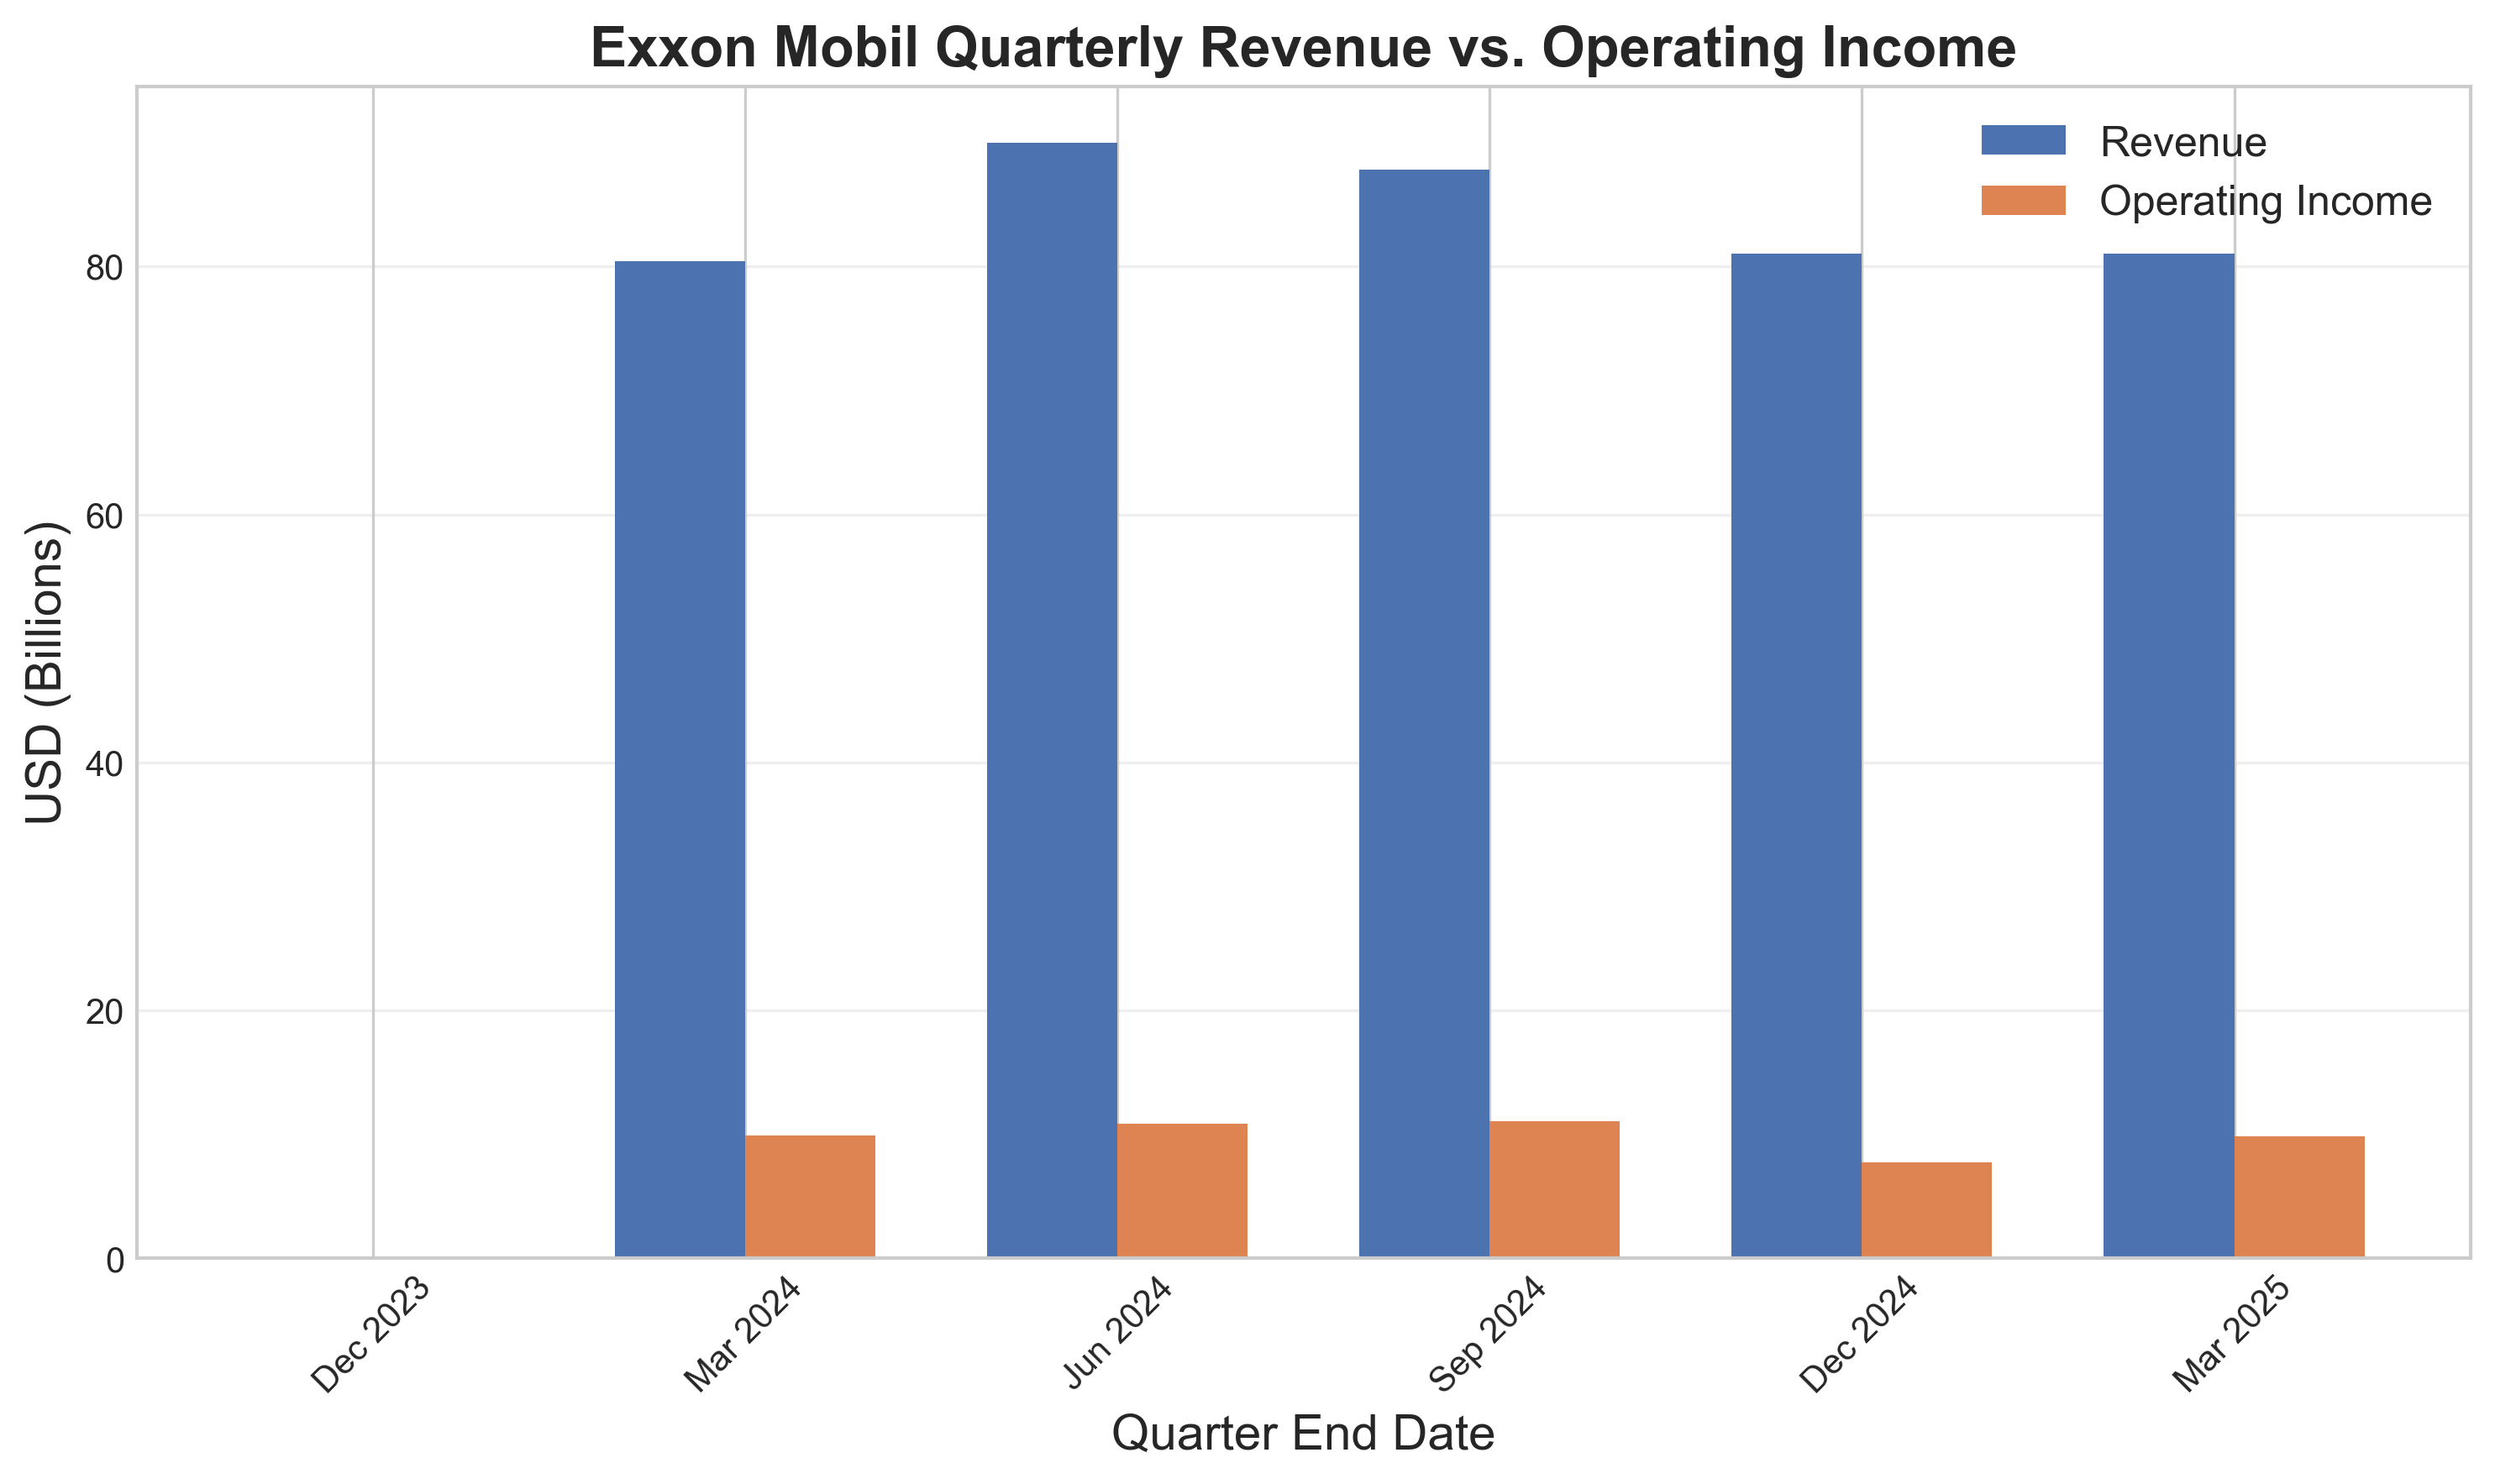
Energy companies faced significant pressure this quarter, with financial metrics reflecting the impact of global supply-demand imbalances. Exxon Mobil reported a 12.15% operating margin, substantially lower than companies in other sectors, while Chevron's quarterly cash flow dynamics highlight challenges in maintaining capital investment amid volatile market conditions.
The narrowing gap between operating cash flow and free cash flow for energy majors indicates the capital-intensive nature of maintaining production capacity, even as commodity price volatility challenges revenue predictability. This financial pressure is forcing strategic reconsideration of capital allocation priorities across the sector.
Cross-Sector Performance Comparison
| Sector | Top Performer | Operating Margin | Key Trend |
|---|---|---|---|
| Technology | NVIDIA | 49.11% | AI-driven demand |
| Healthcare | Johnson & Johnson | 28.77% | Pharma stability |
| Retail | Target | 28.17% | Essential goods focus |
| Energy | Exxon Mobil | 12.15% | Supply-demand imbalance |
As the Q2 2025 earnings season progresses, the divergence between sector performances has emerged as a defining characteristic of the current market environment. Technology's AI-powered boom contrasts sharply with energy's structural challenges, while healthcare and retail occupy the middle ground with varying degrees of success in navigating changing consumer and institutional spending patterns.
Looking Ahead
- Technology companies will face increasing pressure to demonstrate that AI investments can continue delivering exceptional margins as competition intensifies
- Healthcare providers must balance between pharmaceutical stability and rebuilding device sales as hospital capital expenditures normalize
- Retailers will need to further optimize inventory management and focus on high-margin essential categories to protect profitability
- Energy companies must pursue operational efficiency while balancing between traditional production and strategic energy transition investments
Market participants should closely monitor whether these sectoral trends strengthen or reverse in coming quarters, with particular attention to forward guidance signals about capital allocation priorities and margin sustainability. The exceptional disparity between sector performances suggests potential for significant portfolio rebalancing as investors digest the full implications of these divergent financial trajectories.
Comments (0)
No comments yet. Be the first to comment!