Introduction
As we navigate through the post-2024 economic landscape, the retail sector has become a fascinating study in resilience and adaptation. Two retail giants, Walmart (WMT) and Target (TGT), have emerged as particularly interesting cases, showcasing divergent paths in their recovery trajectories. This analysis, backed by comprehensive data from FRED, Tiingo, and SEC EDGAR, reveals how these retail titans have fared in an evolving consumer environment and what their performance signals for the broader retail sector.
Consumer Spending Trends: A Macro Perspective
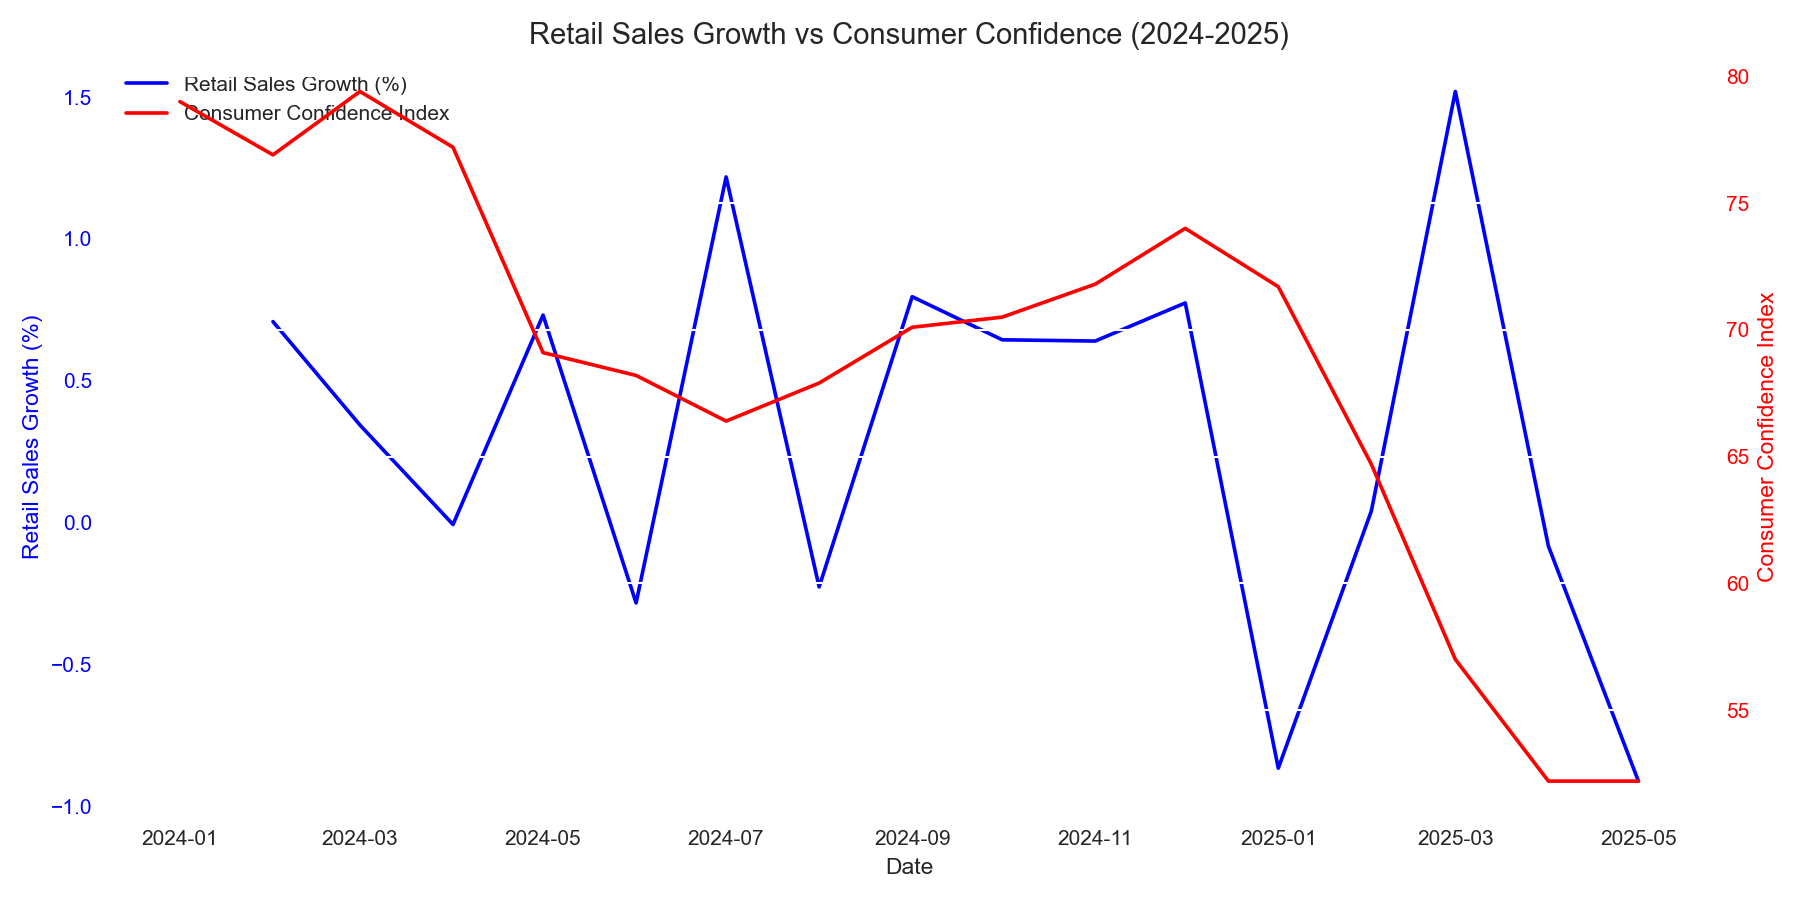
The retail sector has shown remarkable resilience, with average monthly retail sales growth holding steady at 0.32%. Consumer confidence, while cautious at an average of 68.7, reflects a market in transition. This moderate but consistent growth suggests a calculated return to regular spending patterns, though consumers remain selective in their purchasing decisions.
Stock Performance Analysis: A Tale of Two Retailers
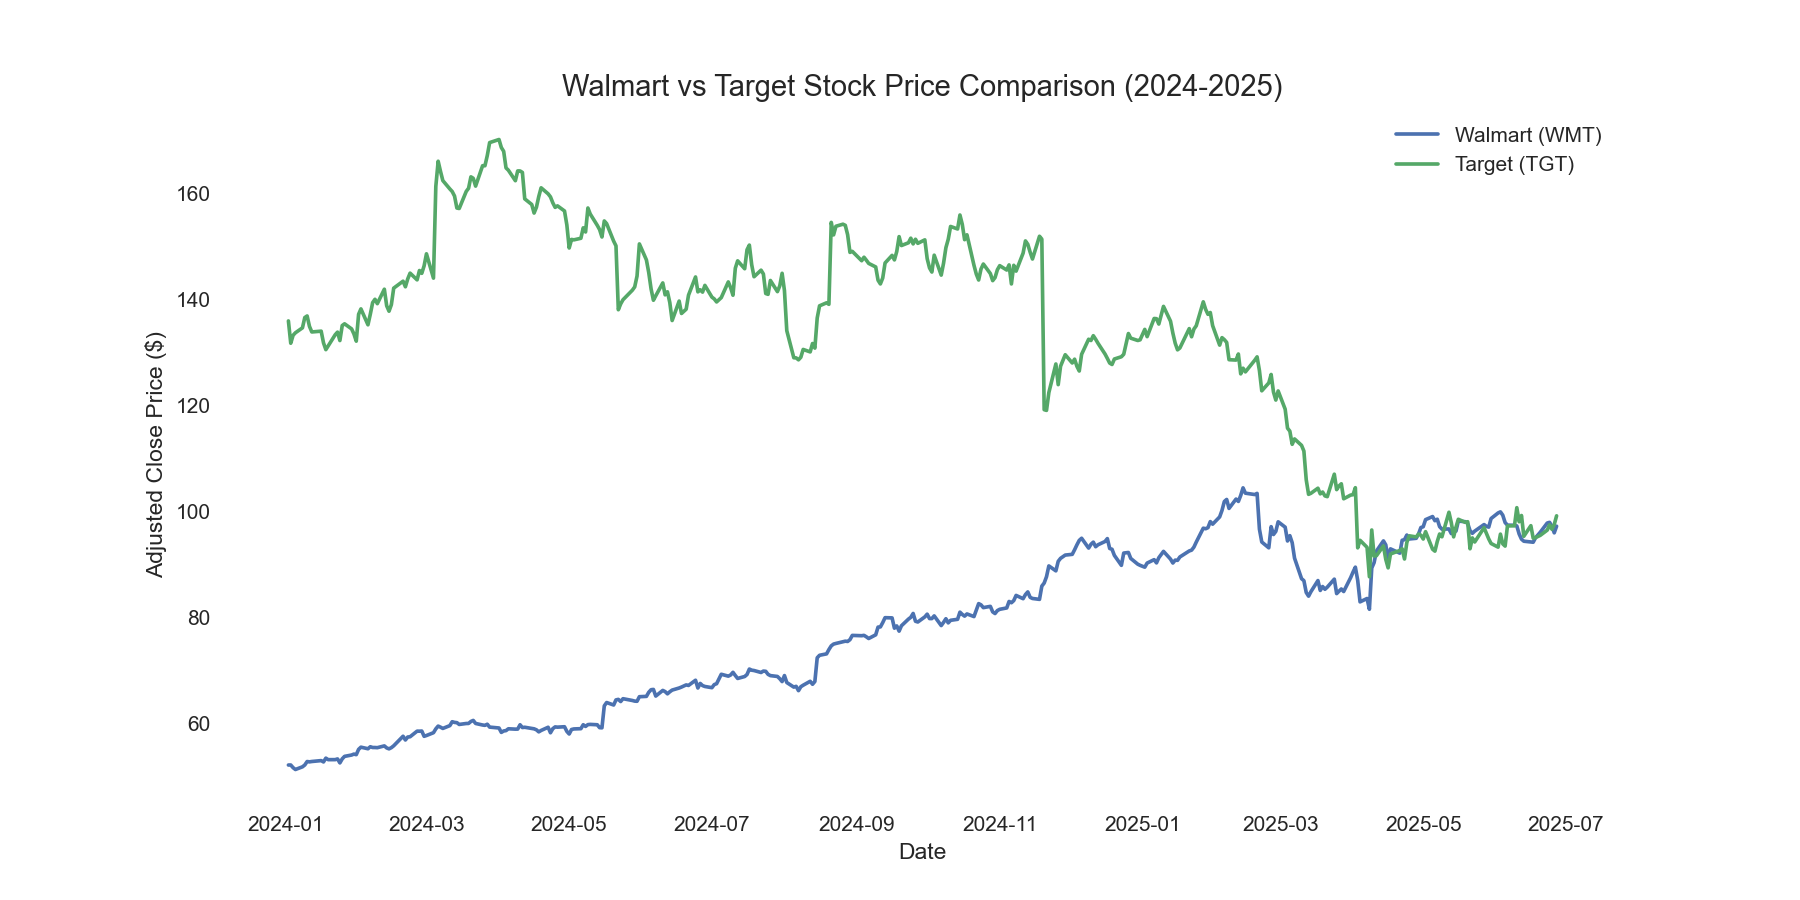
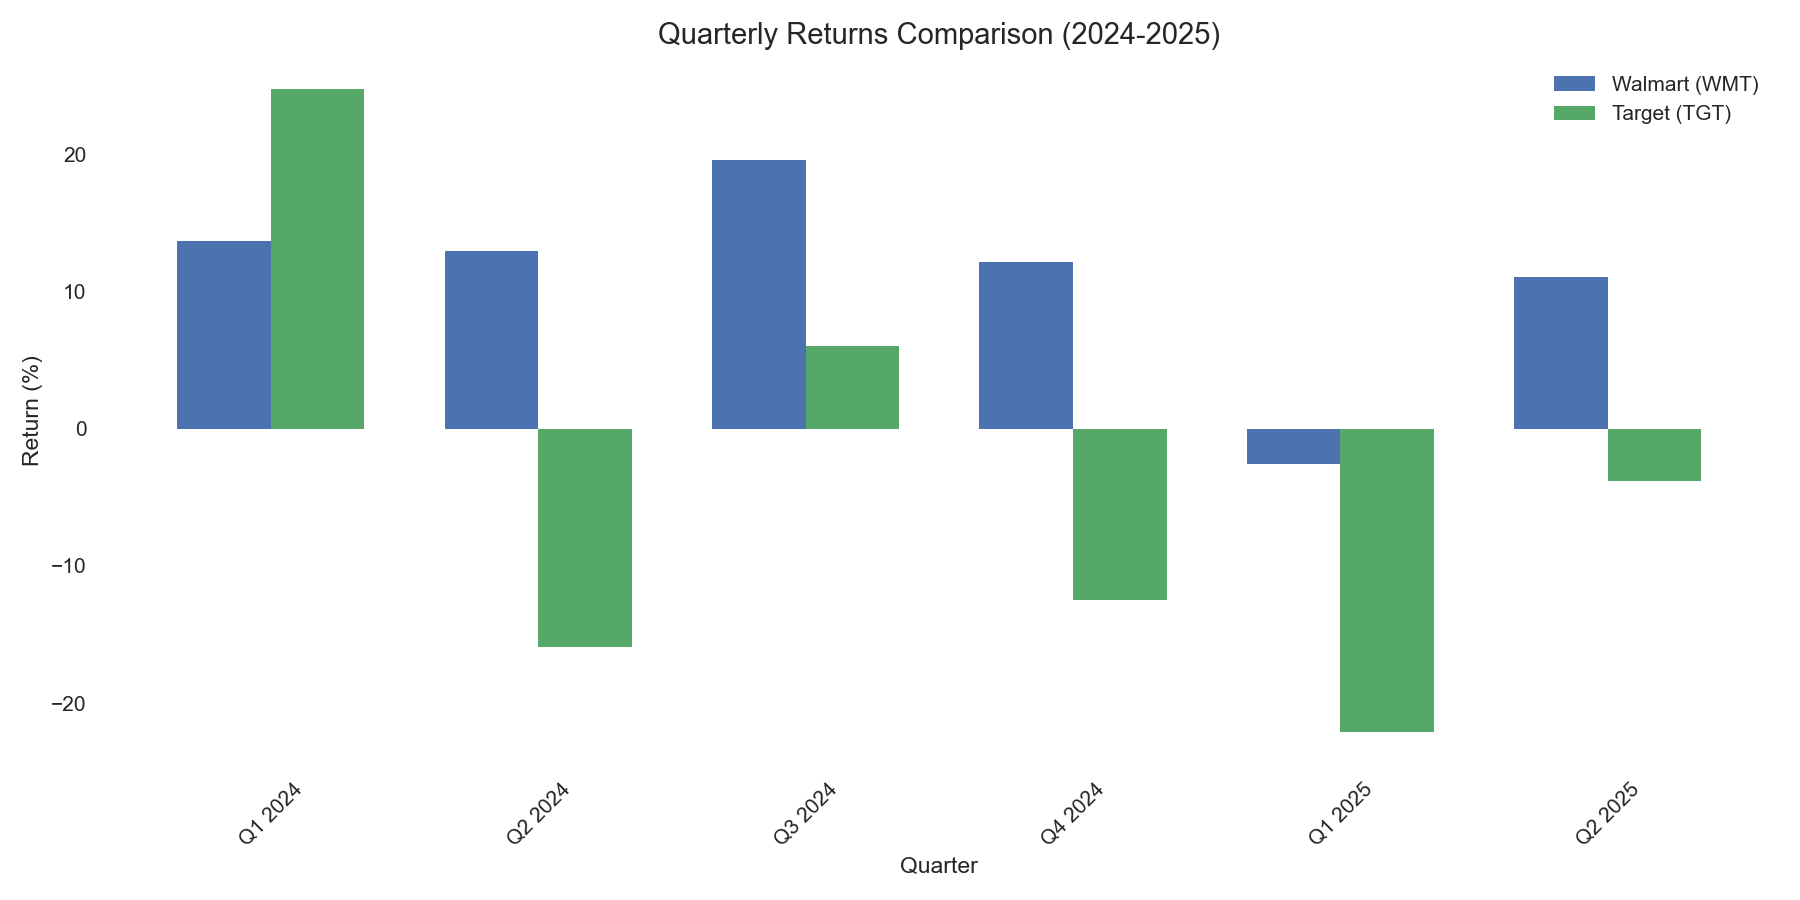
The stark contrast in stock performance between Walmart and Target tells a compelling story of divergent strategies and market reception. Walmart has demonstrated remarkable strength with an impressive year-to-date return of +86.33%, while Target has struggled, showing a decline of -27.04%. This disparity reflects not just different business approaches but also varying success in adapting to post-2024 consumer preferences.
Financial Metrics: Operating Efficiency and Profitability
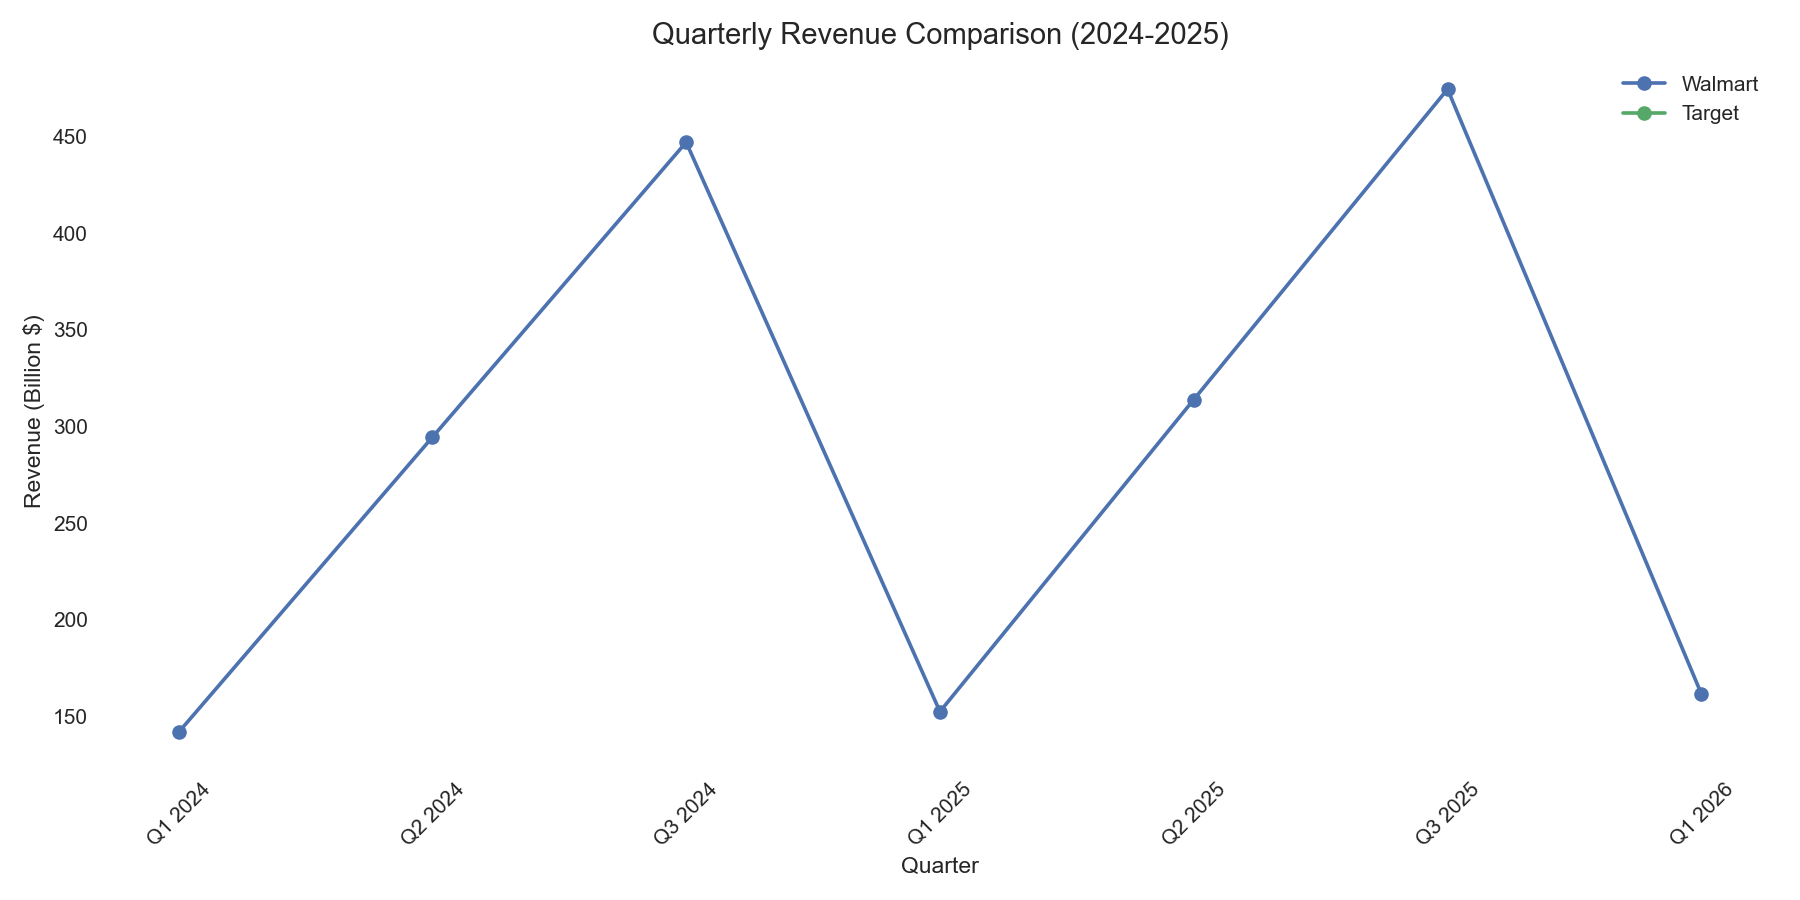
The financial fundamentals reveal the underlying strength of these retailers. Walmart's latest quarter showed robust performance with revenue of $161.51B, operating income of $6.84B, and net income of $5.10B. In comparison, Target's performance has been more modest, with operating income of $1.30B and net income of $0.94B. These numbers highlight Walmart's superior operational efficiency and market positioning.
Investment Implications and Conclusion
The data presents a clear picture: Walmart has emerged as the stronger performer in the post-2024 retail landscape. Its superior stock performance, robust financial metrics, and operational efficiency suggest a well-executed strategy aligned with current market conditions. For investors, Walmart represents a more stable investment option in the retail sector, while Target's recovery strategy may require more time to demonstrate effectiveness. The divergence in their performance serves as a valuable case study in retail sector adaptation and resilience.
Comments (0)
No comments yet. Be the first to comment!