What is the Low P/E Strategy? (Value Investing Made Simple)
Imagine you're shopping for a car. Two identical cars are for sale: one costs $20,000 and the other costs $30,000. Which would you buy? Obviously the cheaper one! The Low P/E (Price-to-Earnings) strategy applies this same logic to stocks. The P/E ratio is like a price tag that shows how much you're paying for each dollar of a company's annual earnings. A P/E ratio of 10 means you're paying $10 for every $1 the company earns per year. Lower P/E ratios often indicate 'cheaper' stocks that might be undervalued by the market – essentially, you're getting more earning power for your dollar.
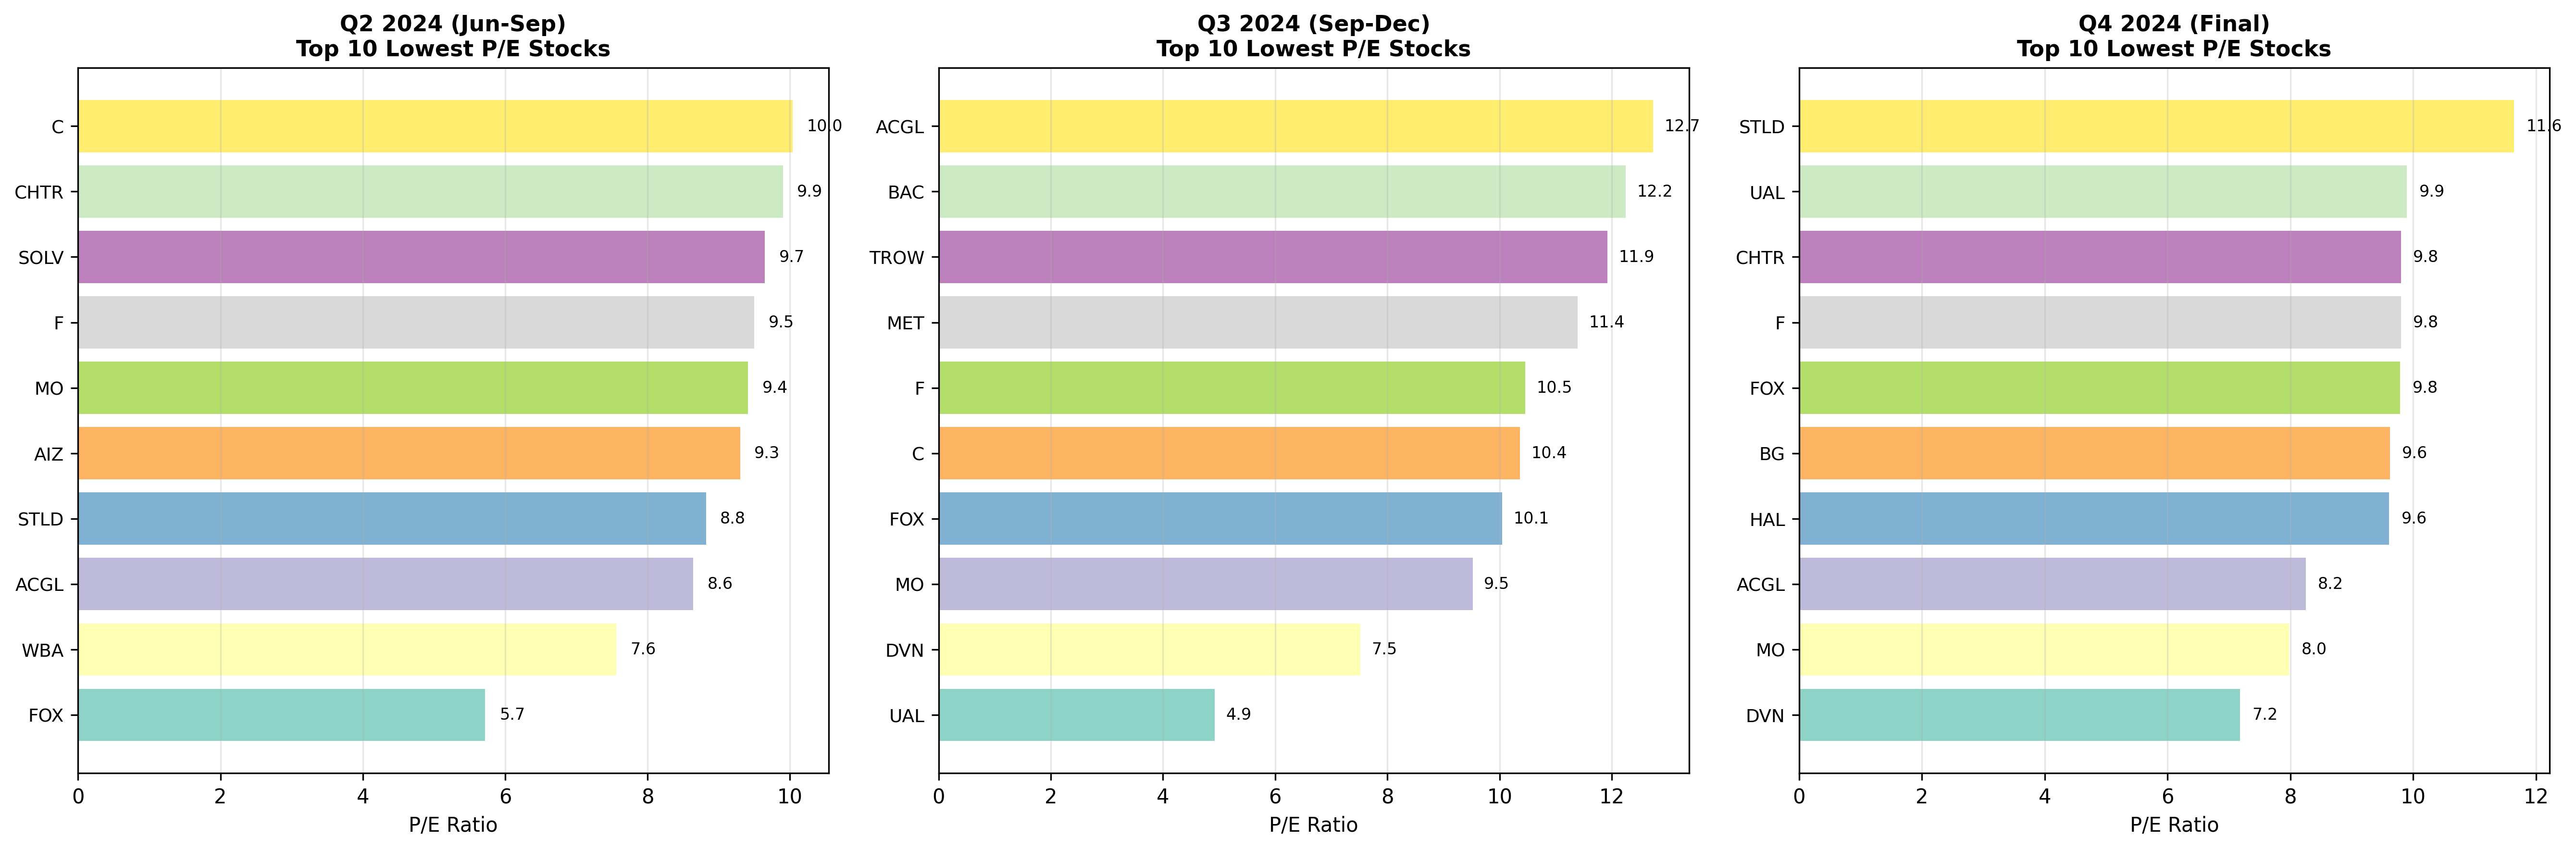
The Strategy in Action: How We Built Our Low P/E Portfolio
Our strategy was refreshingly simple: every quarter (every 3 months), we scanned all S&P 500 companies and picked the 10 stocks with the lowest P/E ratios. We then invested equal amounts in each stock – a technique called 'equal weighting.' Think of it like spreading your risk evenly across 10 different companies rather than putting all your eggs in one basket. We started with $100,000 in June 2024 and tracked the results through December 2024, rebalancing our portfolio three times as new earnings data became available.
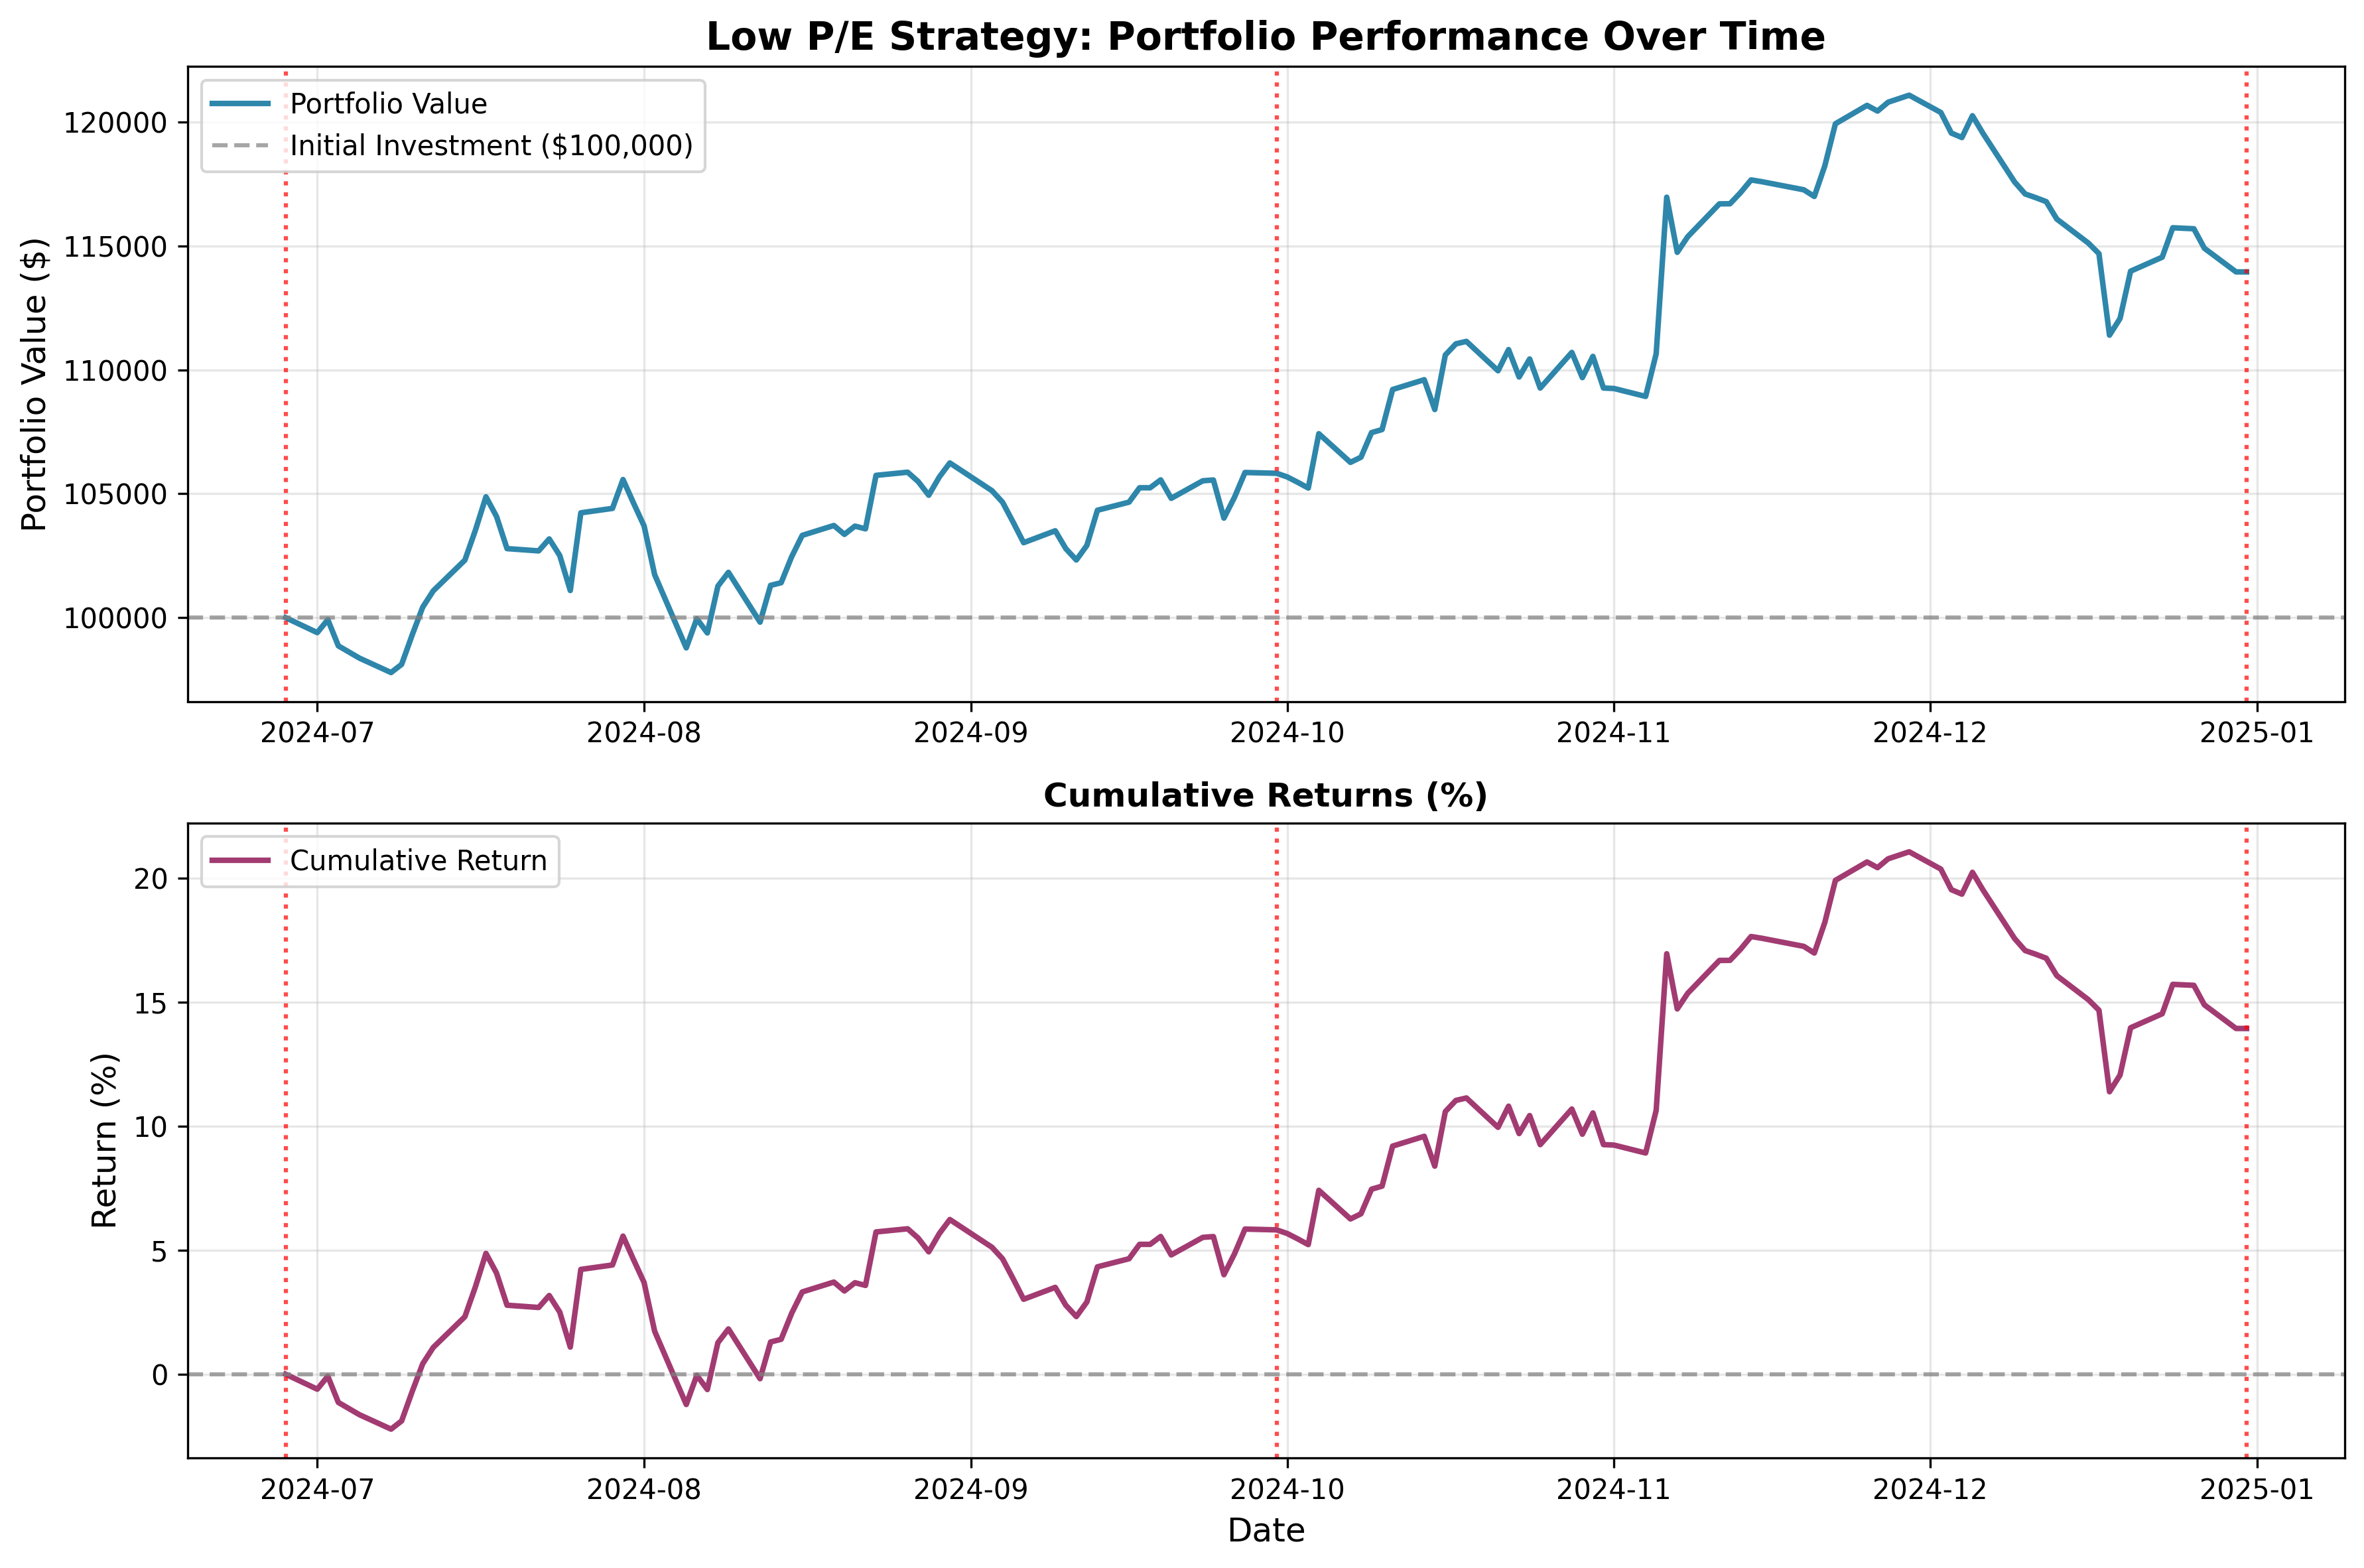
The Numbers Tell a Story: 13.95% Return in 6 Months
The results were quite impressive for such a simple strategy. Our $100,000 initial investment grew to $113,948 by the end of December 2024, representing a 13.95% total return in just six months. To put this in perspective, that's like earning almost $14,000 on a $100,000 investment in half a year! The strategy wasn't without its bumps – we experienced a maximum drawdown of 8%, meaning at one point the portfolio was down 8% from its peak value. However, the portfolio recovered and continued growing, demonstrating the resilience of diversified value investing.
| Metric | Value | What It Means |
|---|---|---|
| Total Return | +13.95% | Portfolio grew by nearly 14% in 6 months |
| Annualized Volatility | 17.58% | Moderate risk level - portfolio fluctuated but not excessively |
| Maximum Drawdown | -8.00% | Worst temporary loss from peak value |
| Best Day | +5.71% | Largest single-day gain |
| Worst Day | -2.91% | Largest single-day loss |
| Win Rate | 50.4% | Portfolio gained value on just over half the trading days |
Meet the Stars: The Companies That Made It Work
Throughout our 6-month journey, we held shares in 17 different companies across various industries. Some companies appeared in multiple quarters due to their consistently low P/E ratios, while others rotated in and out as market conditions changed. Devon Energy (DVN) emerged as a standout performer, featuring in our final portfolio with a P/E ratio of just 7.18. Altria (MO), the tobacco giant, provided stability across all three rebalancing periods. Ford Motor Company (F) showed the cyclical nature of the auto industry, appearing in all periods but with varying P/E ratios. These weren't glamorous tech companies or trendy growth stocks – they were mature, profitable businesses trading at attractive valuations.
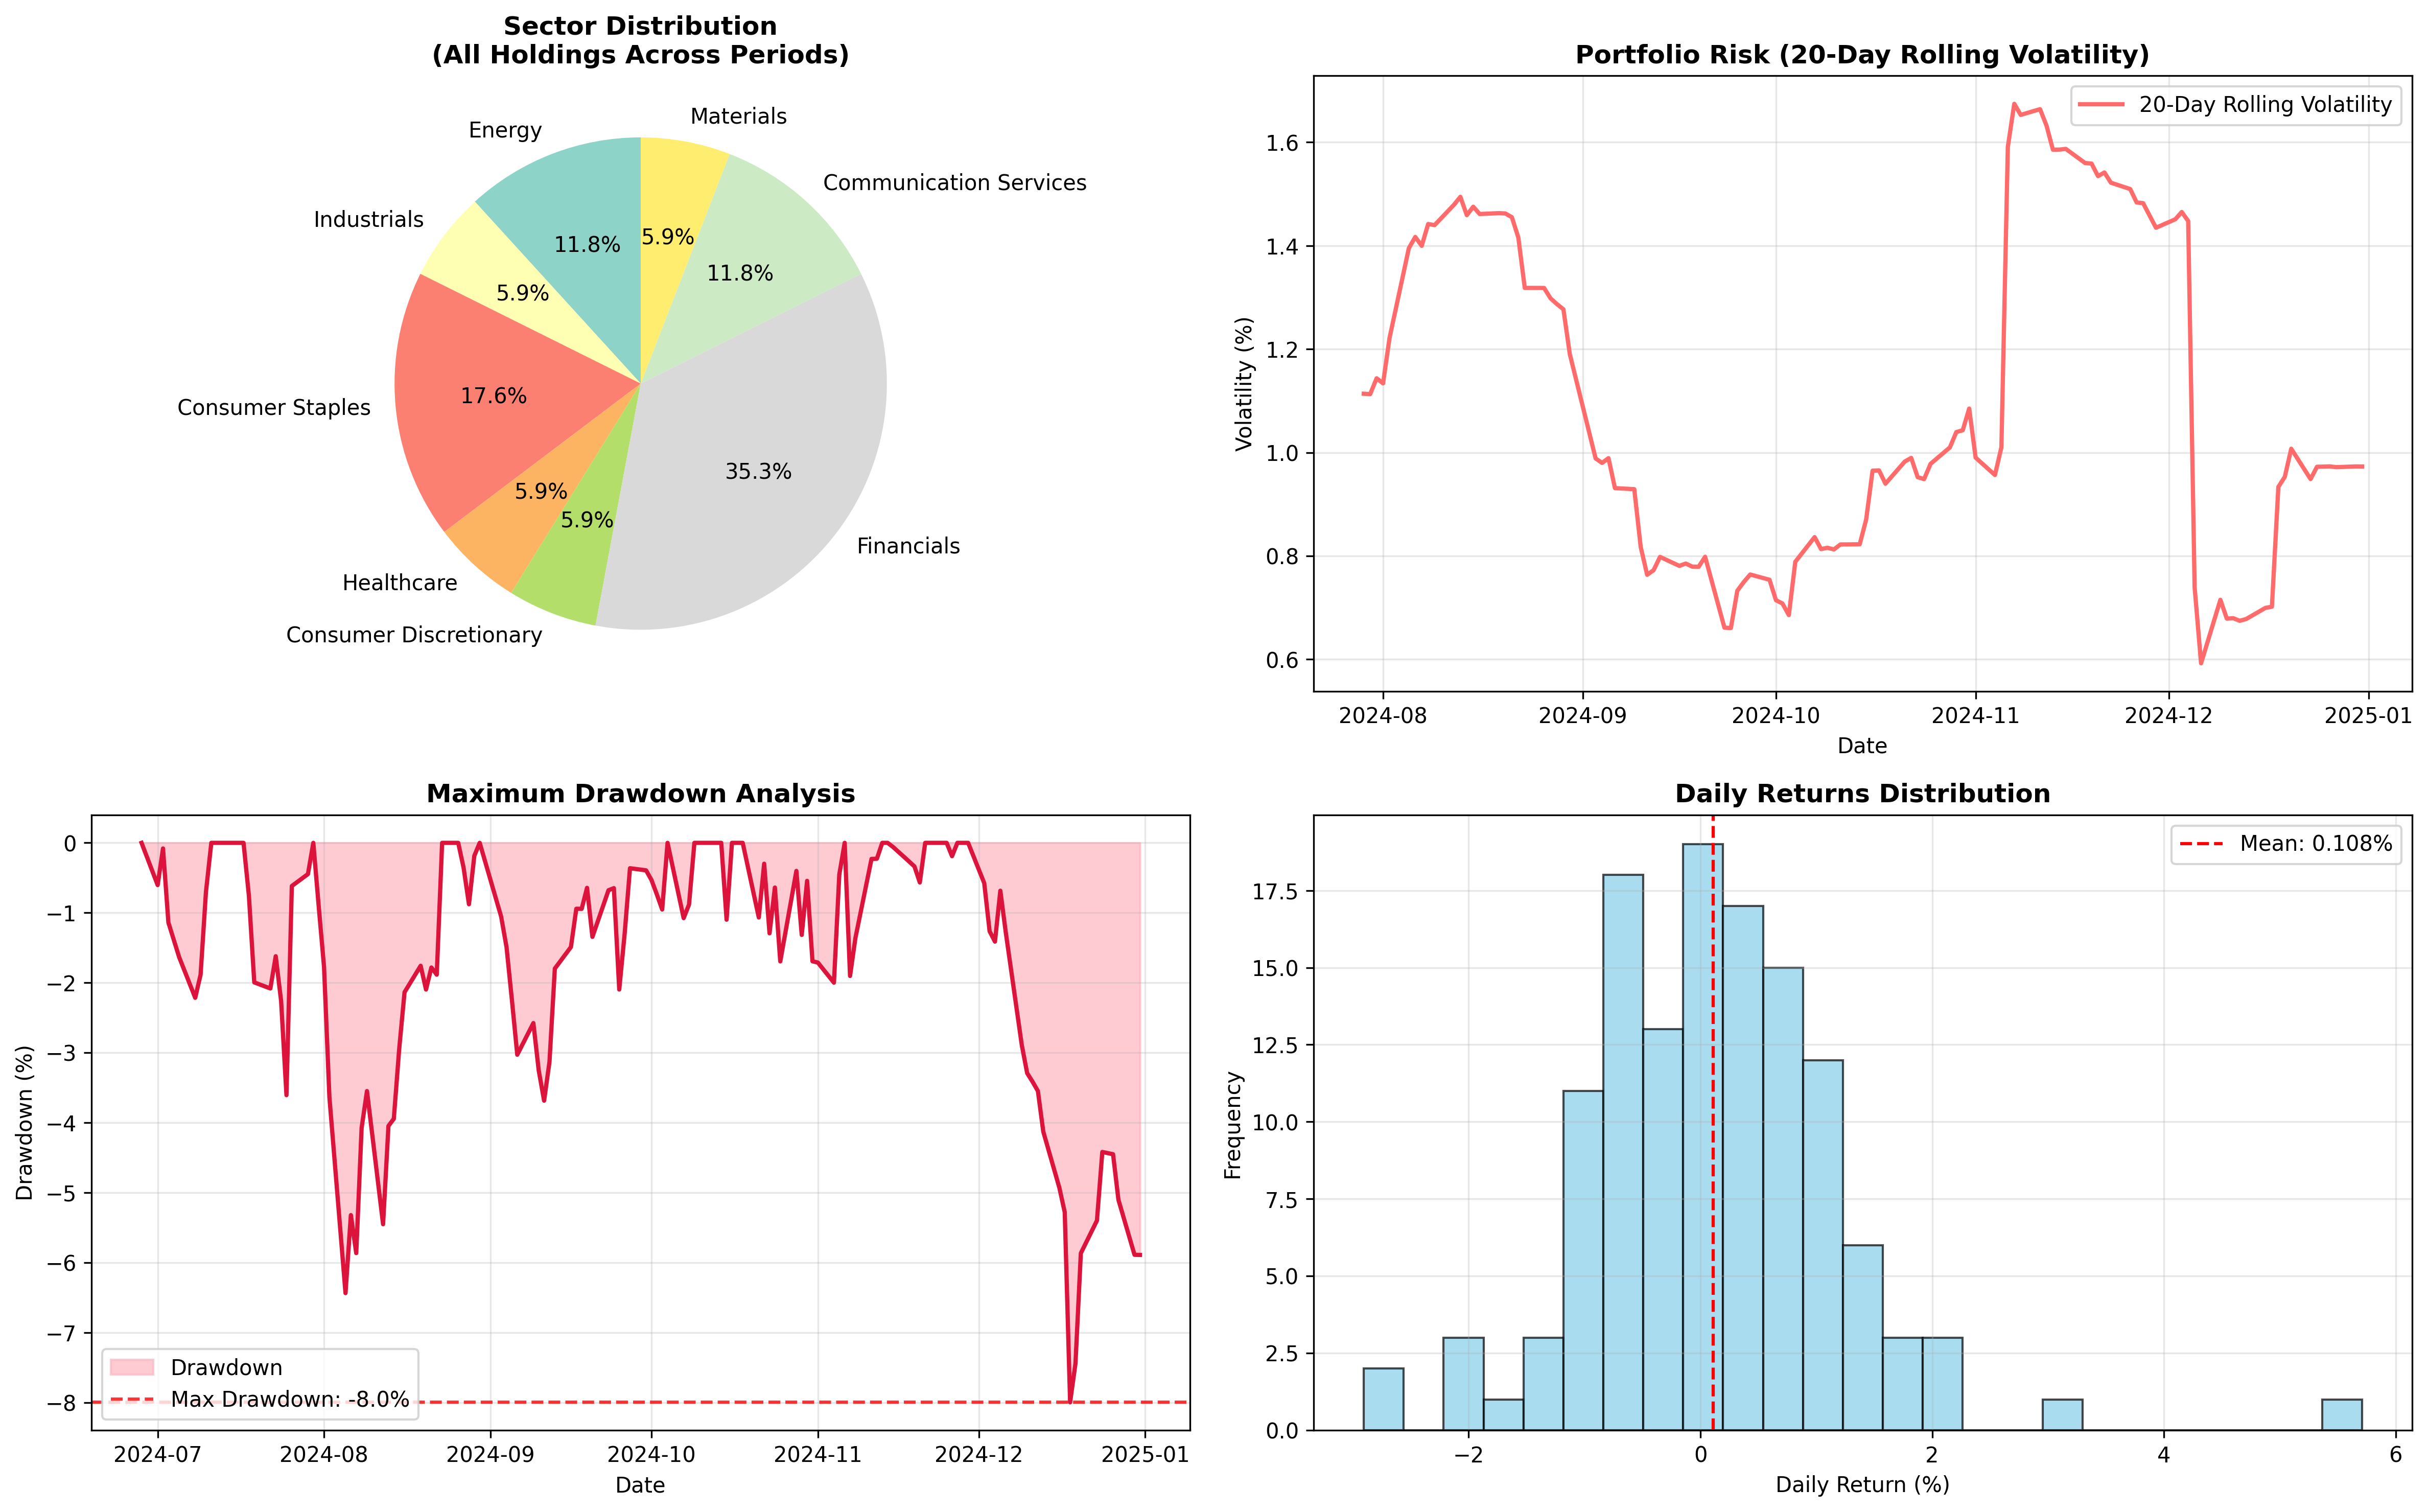
Understanding the Risks: It Wasn't Always Smooth Sailing
While the overall results were positive, the journey included some important lessons about risk. The portfolio experienced daily swings, with some days gaining over 5% and others losing nearly 3%. The strategy showed moderate volatility with an annualized volatility of 17.58%, which is reasonable for a stock portfolio but higher than bonds or cash. The maximum drawdown of 8% occurred during market turbulence, reminding us that even 'value' stocks can experience significant price movements. Interestingly, our portfolio gained value on only 50.4% of trading days, but the winning days more than compensated for the losing ones.
Key Insights for Beginner Investors
- Diversification Works: Spreading investments across 10 different companies and sectors helped manage risk while capturing opportunities
- Patience Pays: The strategy required holding stocks for full quarters, not trying to time daily market movements
- Value Can Be Found Anywhere: Our holdings spanned energy (Devon Energy, Halliburton), financials (Citigroup, Bank of America), consumer goods (Altria), and more
- Simple Metrics Matter: P/E ratio, while basic, proved effective at identifying potentially undervalued companies
- Rebalancing is Key: Updating holdings quarterly allowed us to capture changing market conditions and maintain our low P/E focus
- Past Performance Educational Only: These results show how the strategy performed historically but don't predict future outcomes
The Bottom Line: Value Investing in Practice
This backtest demonstrates that systematic value investing approaches can produce attractive results when applied consistently. The Low P/E strategy's 13.95% return in six months showcases the potential of focusing on fundamentally undervalued companies rather than chasing market trends. However, it's crucial to remember that this analysis is purely educational and historical. The companies that performed well in this period may not repeat their success, and market conditions constantly change. For beginners interested in value investing, this case study illustrates the importance of diversification, systematic approaches, and patience – core principles that have guided successful investors for decades. The strategy's success lay not in picking individual winners, but in consistently applying a proven investment principle across a diversified portfolio.
Comments (0)
No comments yet. Be the first to comment!