What is Free Cash Flow Efficiency and Why Does It Matter?
Free cash flow (FCF) efficiency measures how effectively a company converts its revenue into cash that's available for business operations, expansion, debt reduction, or returning to shareholders. In today's high-interest environment, this metric is increasingly important as it indicates a company's financial flexibility and operational strength. Think of it as a company's ability to turn sales dollars into actual cash in the bank—ready to use without restrictions.
Our analysis ranks S&P 500 companies based on their FCF efficiency, highlighting those businesses that are most adept at generating cash relative to their size. Companies at the top of our list have demonstrated exceptional ability to convert sales into usable cash, positioning them well regardless of economic conditions.
Understanding the Ranking Metrics
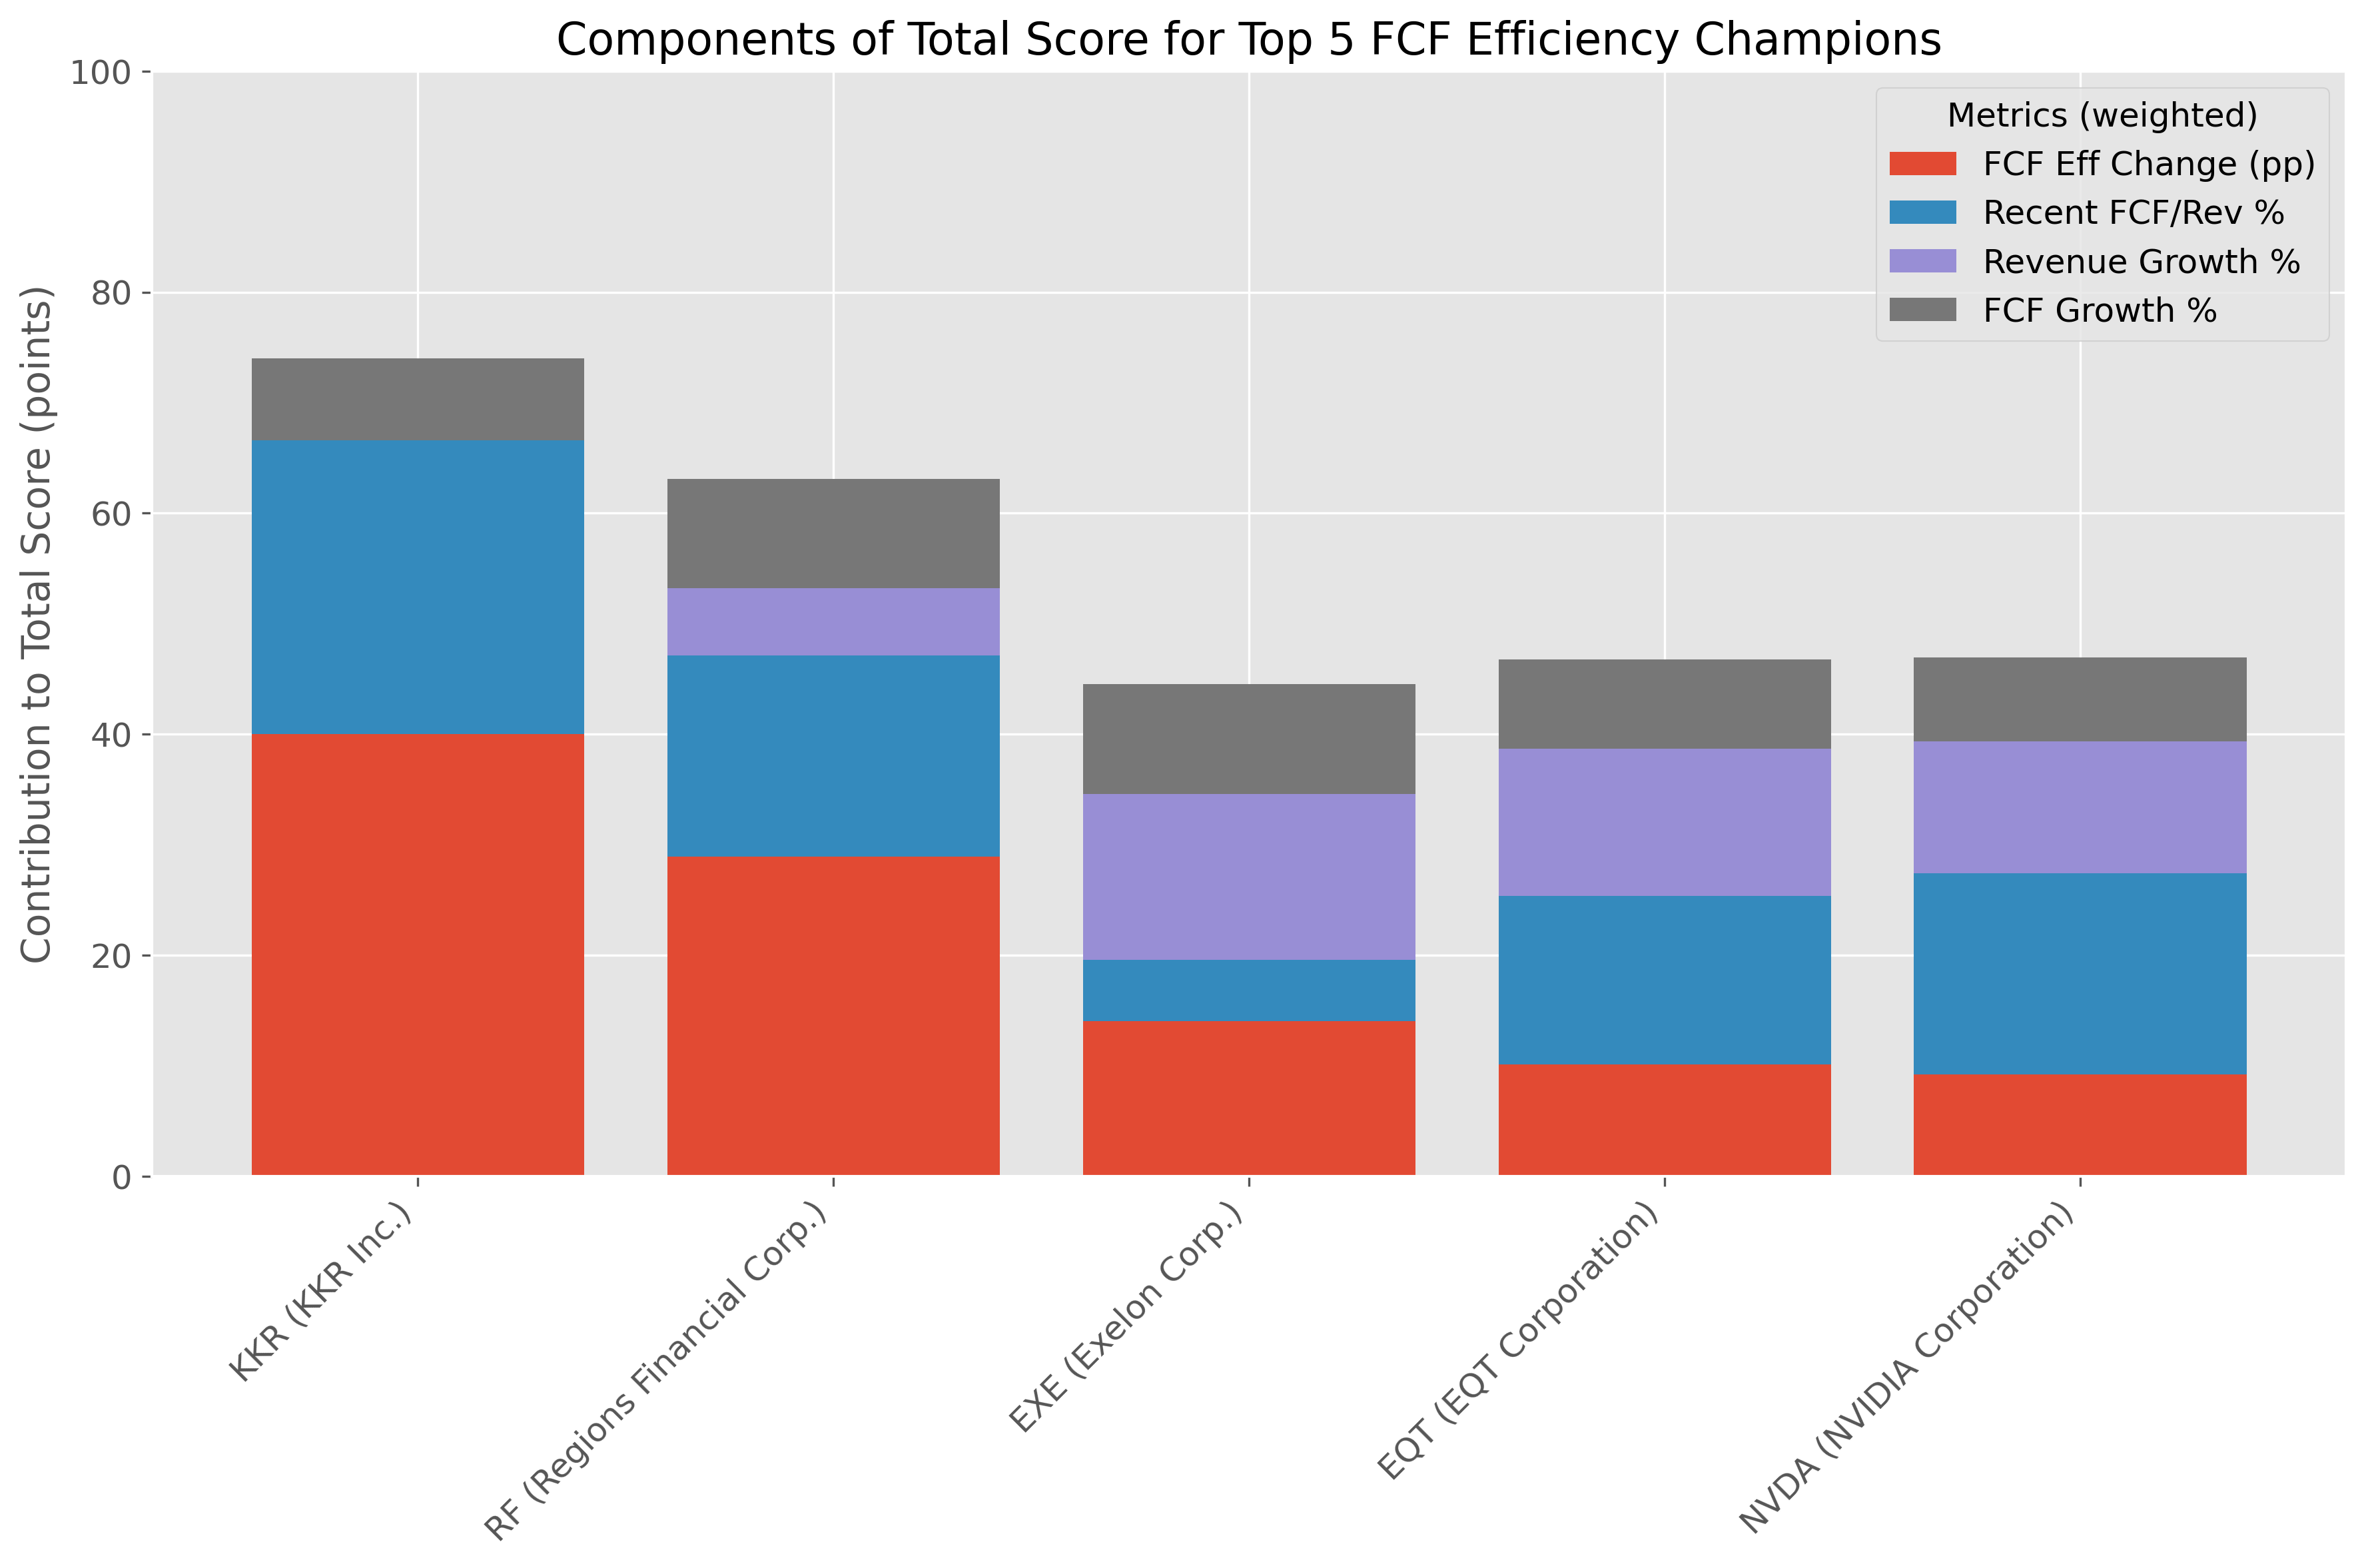
Our ranking system combines four key metrics, each telling an important part of the cash flow story:
- FCF Efficiency Change (40% of score): Measures how much a company has improved its ability to convert revenue to free cash flow over the past year, expressed in percentage points.
- Recent FCF to Revenue % (30% of score): Shows what percentage of each dollar in sales is converted to free cash flow in the most recent quarter.
- Revenue Growth % (15% of score): Indicates year-over-year sales growth, showing if the company is expanding its business.
- FCF Growth % (15% of score): Reflects year-over-year growth in free cash flow, showing if the company is generating more cash over time.
Each metric is normalized to a 0-100 scale and weighted according to its importance to calculate a final score out of 1000 points. This balanced approach rewards both current efficiency and improvement over time.
How We Calculate FCF Efficiency
The core calculation is straightforward: Free Cash Flow divided by Total Revenue, expressed as a percentage. For example, if a company generates $300 million in free cash flow from $1 billion in revenue, its FCF efficiency is 30%. The higher this percentage, the more efficient the company is at turning sales into available cash.
Free Cash Flow itself is calculated from the cash flow statement as Operating Cash Flow minus Capital Expenditures. It represents the cash a company generates after accounting for cash outflows to support operations and maintain its capital assets.
Key Patterns Among Top Performers
Looking at our top 5 companies, several interesting patterns emerge. KKR Inc. (KKR) and Regions Financial Corp. (RF), both from the financial services sector, lead the pack with outstanding improvements in FCF efficiency. KKR demonstrated a remarkable 67.06 percentage point increase in FCF efficiency while maintaining an impressive 82.79% FCF to revenue ratio. This means that for every dollar of revenue, KKR now generates about 83 cents in free cash flow.
Exelon Corp. (EXE) from the industrials sector shows a different strength profile, with explosive revenue growth of 104.66% and FCF growth of 306.87%. This indicates that EXE isn't just growing its business—it's becoming significantly more efficient at generating cash as it expands.
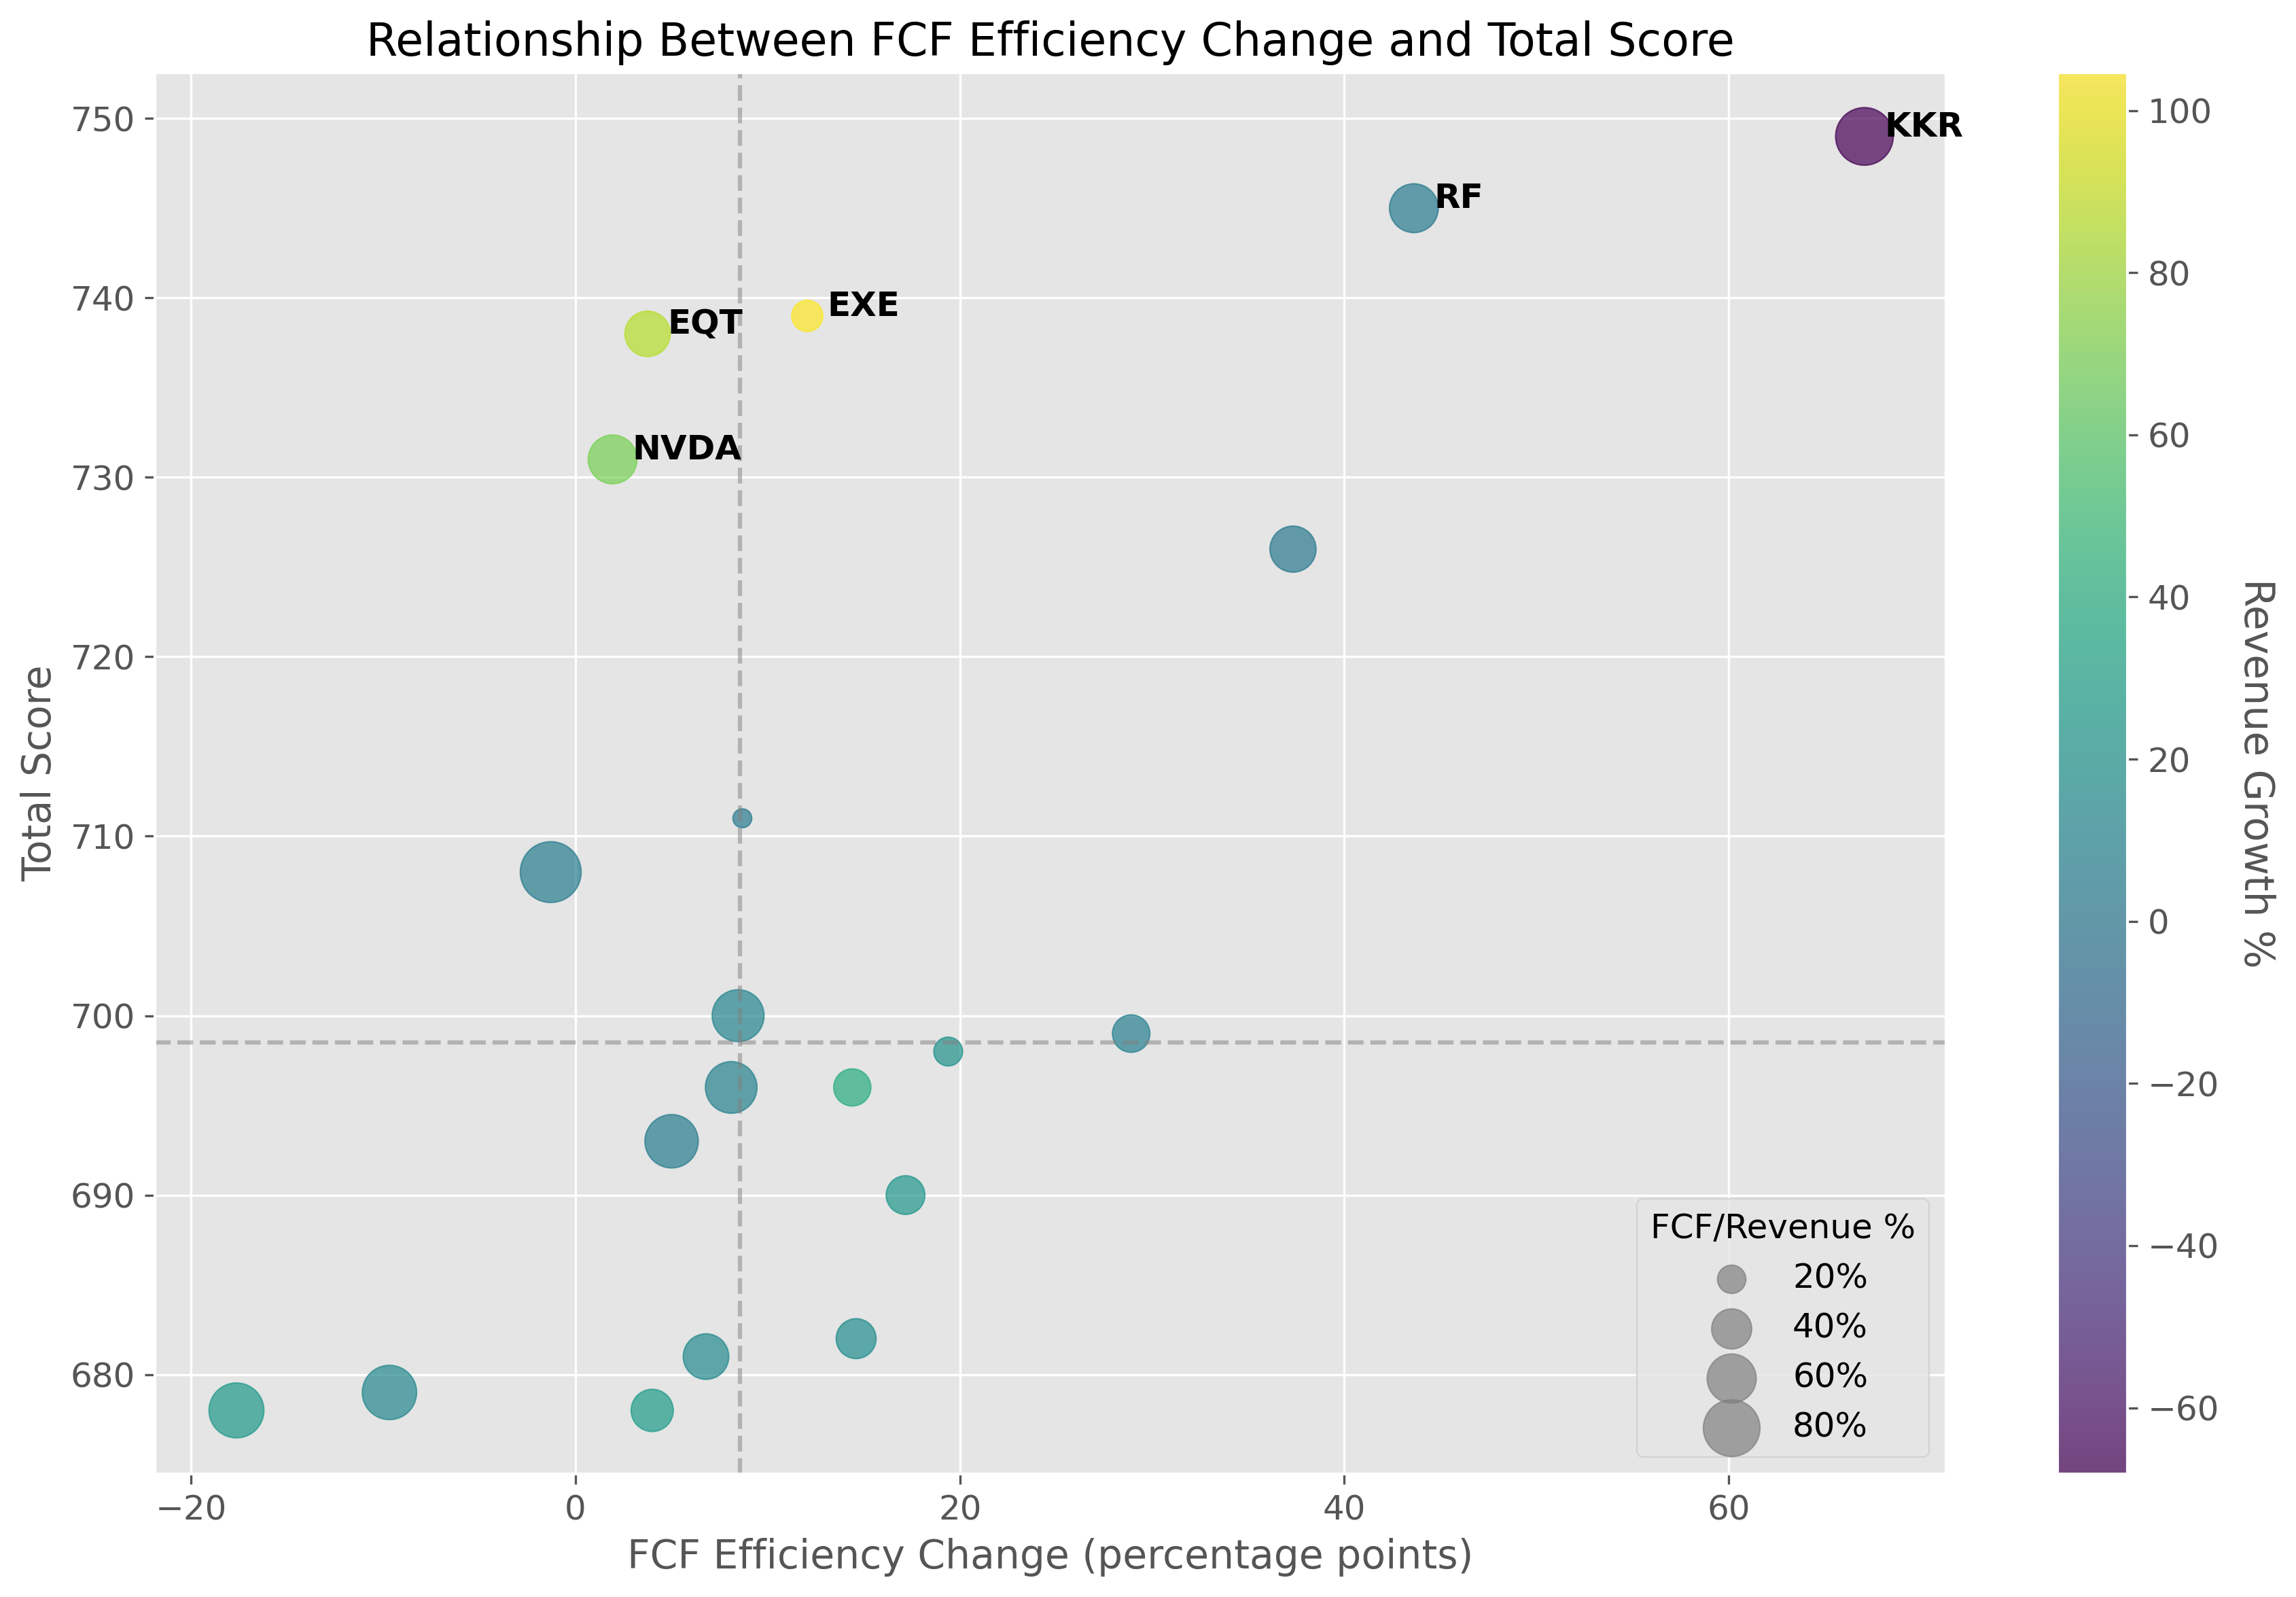
NVIDIA Corporation (NVDA), the sole technology company in our top 5, shows strong performance across all metrics. While its FCF efficiency improvement is more modest at 1.93 percentage points, it maintains a high current efficiency of 59.43% alongside healthy revenue growth of 69.18%. This balanced performance illustrates that established tech companies can continue to optimize their cash generation while growing their business.
Sector Trends in FCF Efficiency
When we look at the broader dataset of top performers, certain sectors stand out. Technology companies show consistent strength in converting revenue to cash, likely due to their scalable business models and relatively lower capital requirements compared to traditional industries. Financial services firms are showing significant improvements in FCF efficiency, potentially reflecting successful digital transformation initiatives that reduce operational costs.
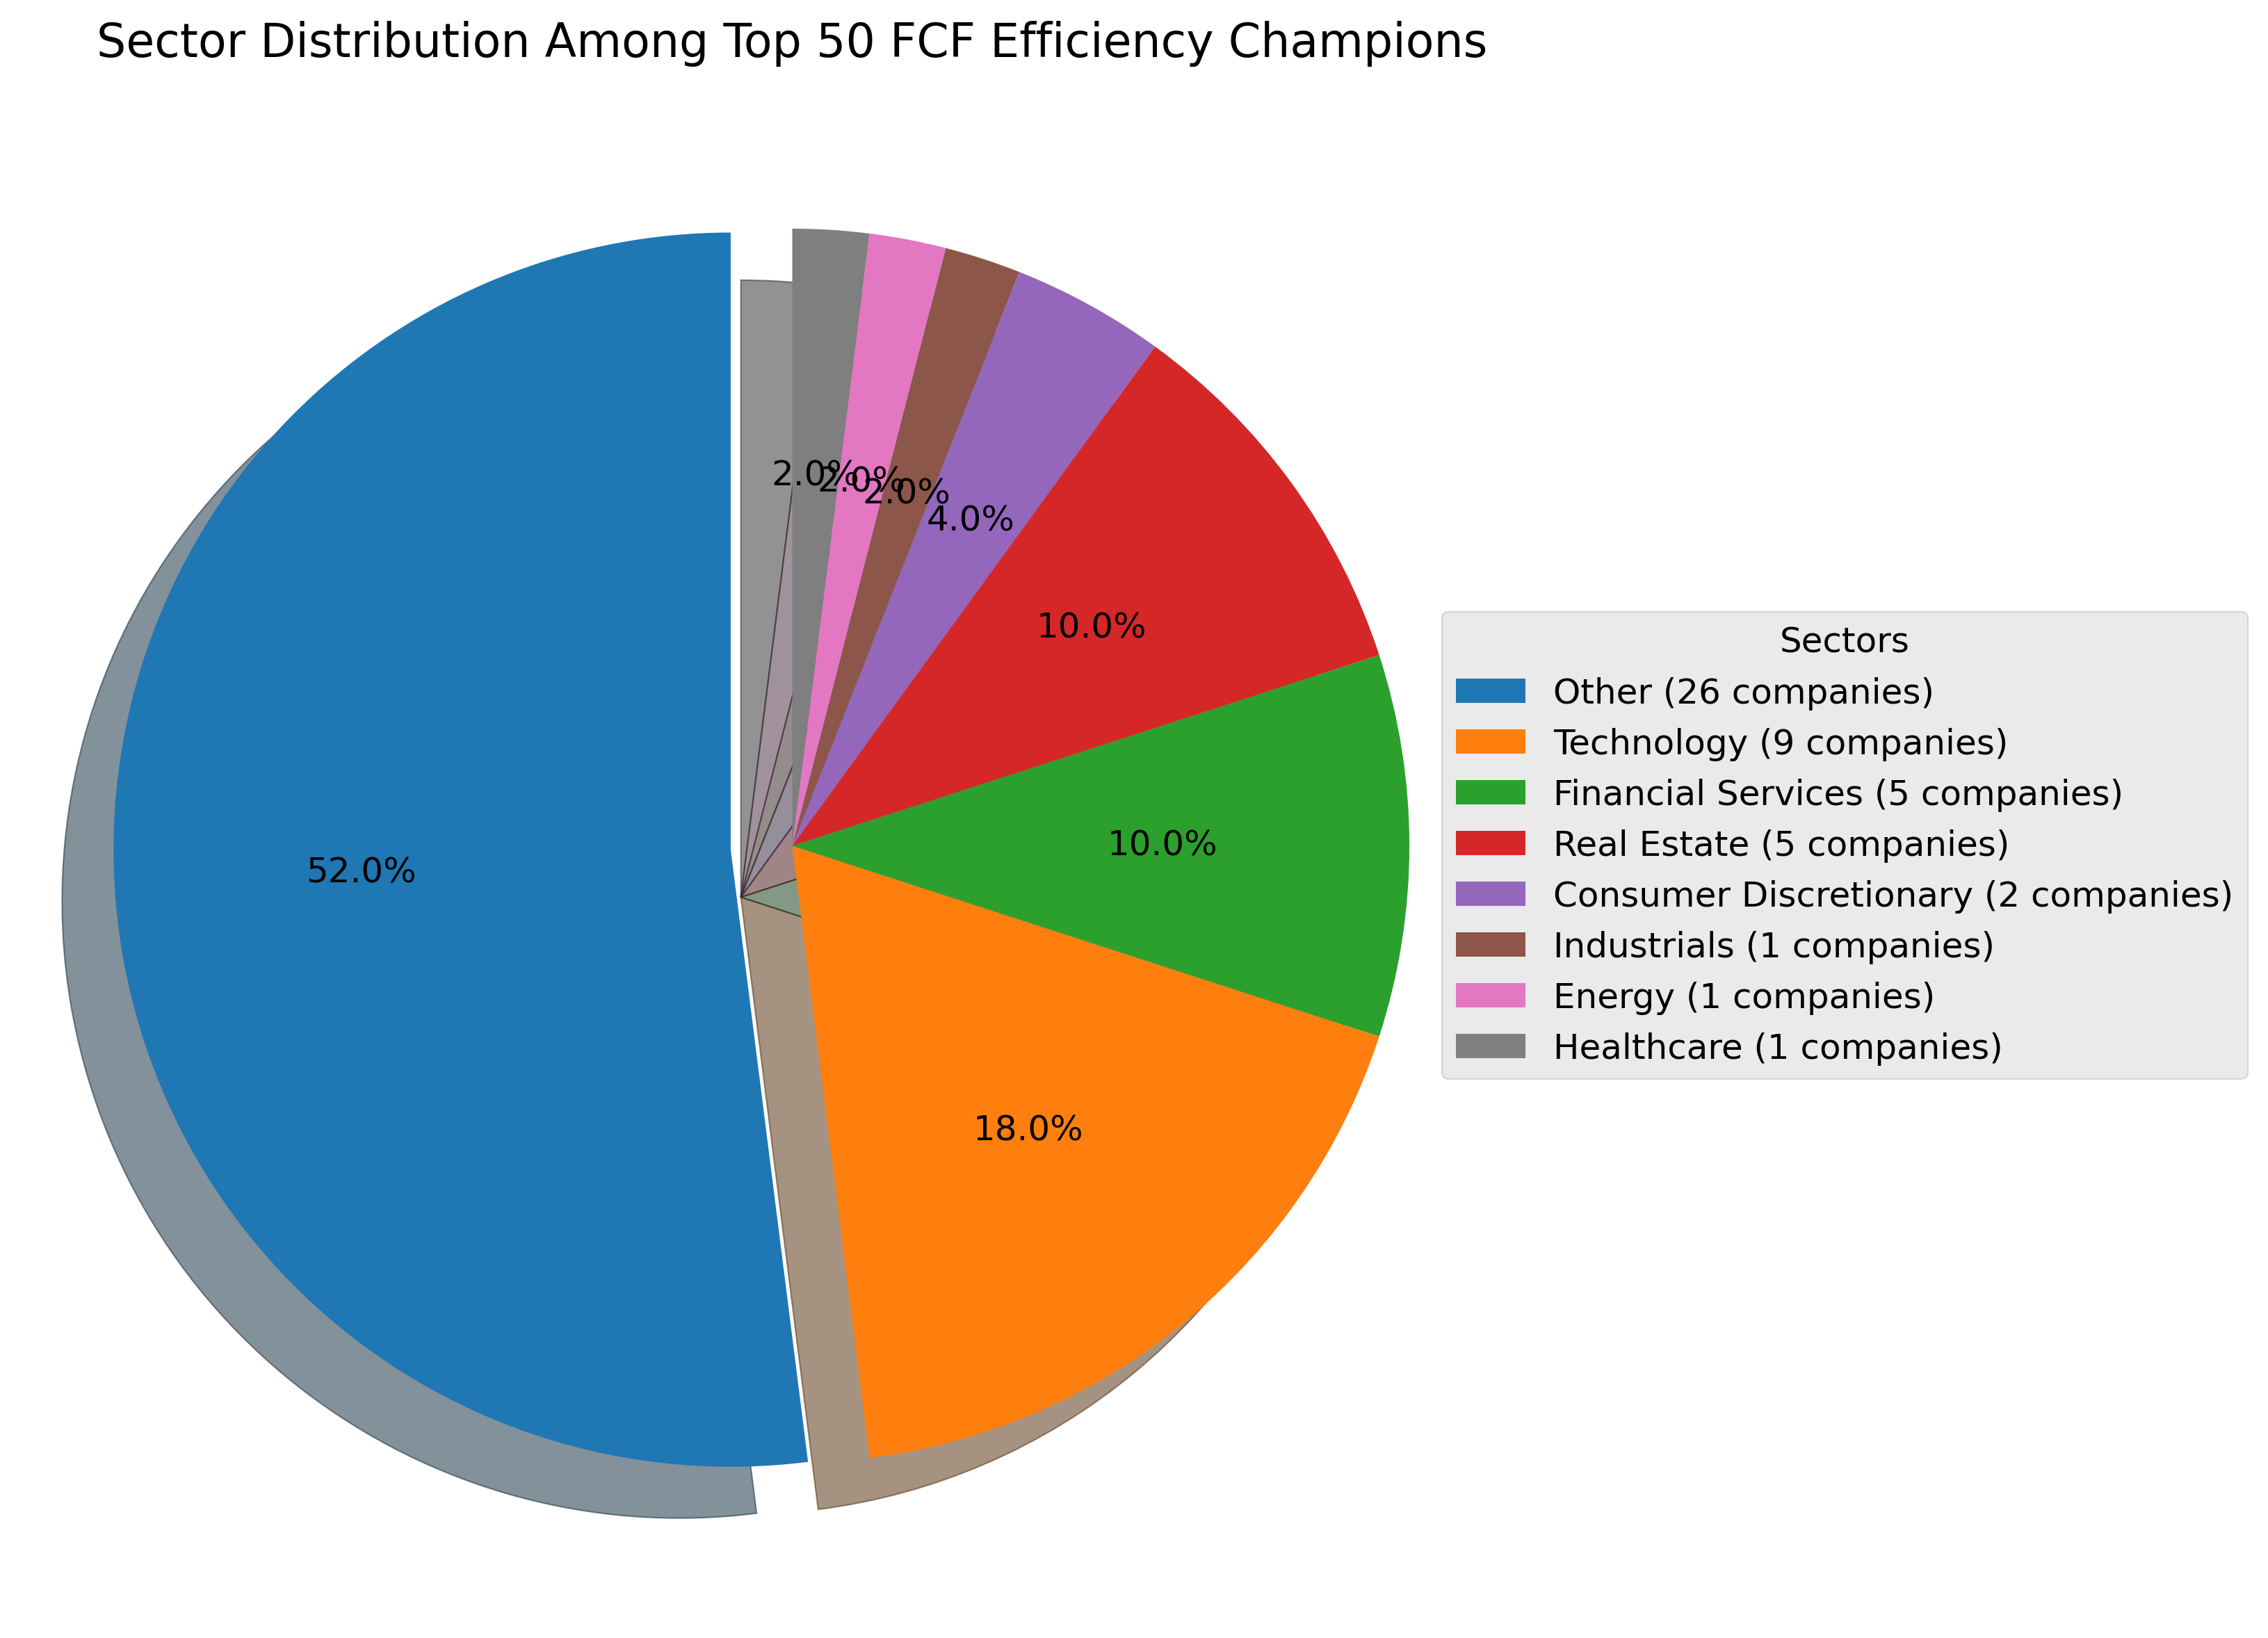
Interestingly, companies from capital-intensive sectors like Energy and Industrials appear less frequently in the top rankings, but those that do make the list (like EXE and EQT) show exceptional performance. This suggests that even in traditionally cash-hungry industries, innovative operational approaches can lead to superior cash efficiency.
Why FCF Efficiency Matters to Investors
Understanding FCF efficiency provides valuable context when evaluating companies. High efficiency often indicates strong operating models, effective management, and potential for future growth or shareholder returns. Companies with improving FCF efficiency may be undergoing positive transformations in their business models or operations.
- Financial Flexibility: Companies with high FCF efficiency have more options during economic uncertainty—they can continue investing, reduce debt, or maintain dividends.
- Quality of Earnings: Strong and improving FCF efficiency often indicates high-quality earnings, as the company is converting accounting profits into actual cash.
- Business Model Validation: Consistent FCF efficiency can validate a company's business model and competitive position.
- Management Effectiveness: Improvement in FCF efficiency frequently reflects successful management initiatives and operational discipline.
The top performers in our ranking demonstrate that FCF efficiency isn't limited to any particular type of business. Both high-growth companies and more established firms can excel at turning revenue into cash when they prioritize operational efficiency and disciplined capital allocation.
The Bottom Line
Free cash flow efficiency provides a valuable lens for understanding a company's operational strength and financial health. Our analysis shows that companies across various sectors can achieve excellent cash conversion when they focus on operational efficiency. The metrics we've highlighted—FCF efficiency change, current FCF to revenue percentage, revenue growth, and FCF growth—together offer a comprehensive picture of how effectively companies are generating and improving their cash positions relative to their size.
As the economic landscape continues to evolve, tracking these metrics can provide insights into which companies may be best positioned to navigate changing conditions while continuing to create value.
Comments (0)
No comments yet. Be the first to comment!